Quantcast
Viewing all 149 articles
Browse latest View live

The Alpha and Beta of GSK-3s – first in the Strange but Powerful Molecules Series

The Molecules that Play Dr. Jeckel and Mr. Hyde in Aging, Alzheimer’s Disease, and Type II Diabetes

By James P Watson, with summary and contributions from Vince Giuliano

IntroductionGSK-3s – The “Dr. Jeckel and Mr. Hyde” Molecules

Have you ever heard of Glycogen Synthase Kinase 3 alpha or beta?  If you haven’t, don’t feel bad…..they do so much more than just inhibit glycogen synthesis.  If you are interested in what causes aging or Alzheimer’s disease, however, you better learn about GSK-3, because this is big….really big!  Why hasn’t GSK-3s received more press?  Maybe it is because no PR agent has been hired to “pitch” this poorly named enzyme.  So I am going to pretend I am a PR firm hired to develop an advertising campaign for GSK-3α and GSK-3β.  The first thing that PR firms do is to develop a catchy “tag line” to describe the GSK-3s.  One possibility would be “GSK-3: We control much more than Glycogen Synthesis” (That isn’t that catchy, but GSKs do control over 50 molecular pathways).  Most people don’t even know what glycogen is, so maybe a better tag line would be “GSK-3: the Master Molecular Multi-tasker” (every modern woman can relate to that!).  Another one that might get attention is the Great Satan Kinase, but actually that slights it’s good side.  For the engineers or science geeks who may read this blog, we have another PR slogan for GSK-3: “The Multipurpose Signal Amplifier and Multipurpose Signal Dampener”.  Even that technical mumbo-jumbo doesn’t really reflect how powerful the GSK-3 enzymes are, however.  For this reason, our PR firm has finally decided to give GSK-3s a “human face” -

The Molecular Dr. Jeckel and Mr. HydeImage may be NSFW.
Clik here to view.

They are your worst enemy and your best friend. They can throw a “monkey wrench” in all of the major molecular signaling cascades (like the Insulin/IGF pathway, the mTOR pathway, etc.).  They can keep you healthy or they can make you age. They can cause Alzheimer’s disease and Diabetes or they can protect you from these diseases.  In fact, because the way they function as amplifiers, GSK-3s can kill your cells by activating apoptosis pathways.  This is why they are both “good” and “bad” for you.

This is the first of what we expect to be a series of blog entries  on less-familiar but very important  and well-studied  molecules encountered in humans which have major impacts on aging and health – the Strange But Powerful Molecules Series.  GSK-3s have been studied in the cancer research community for over 30 years, but have largely been ignored in the aging research community despite their profound impacts on aging processes.  Additional posts in the series will be concerned with other lesser-known candidates of similar great importance, starting with the P66shc protein and with the non-coding gene known as ANRIL.  We characterize GSK-3 kinases, what they do, their impacts on biological pathways, why they are of critical importance for certain disease processes and aging, and about the ways they can be activated or turned off.

KEY POINTS

As is often the case, this blog gets quite complicated. So, we summarize some of the most important points here.

  1.  The GSK-3s are important because they “signal amplifiers” that turn on genes or up regulate enzymes, but are also “signal dampeners” that turn off genes or down regulate enzymes. They have about 50 targets, approximately half of which are transcription factors and half are other (non-transcription factor) enzymes within the cell.  They have so many different impacts on the cell that they are best referred to as “molecular multi-taskers”.  They play important roles in multiple disease processes and in aging itself.
  2. “In the pathways in which GSK-3 acts, it serves as a key regulator of normal cellular functions. However, when GSK-3 is dysregulated, it also has a key role in causing diseases such as diabetes, Alzheimer’s disease, bipolar disorder and cancer(ref).”  GSK-3s now are well documented to play key roles also in Chronic Traumatic Encephalopathy, Fronto-temporal dementia, Multiple Sclerosis, Diabetes type II, colitis, and arthritis.  “Aberrant activity of GSK-3 has also been implicated in the pathologies of many diseases and disorders such as metabolic disorders (diabetes, atherosclerosis, heart disease), neurological disorders (Parkinson’s, Alzheimer’s, amyotrophic lateral sclerosis, schizophrenia, bipolar disorder, mood disorders), cancer and aging (cellular senescence, cancer stem cells, control of stem cell pluripotency and differentiation), immune disorders and other maladies among others(ref).3, 4, 5, 6, 7
  3. The GSK-3s exercise regulatory functions which impact on cell cycle and division dynamics and a DNA repair pathway.
  4. GSK’s directly impact aging since they can function as molecular mediators of the Insulin/IGF pathway and the mTOR pathway.  However, when GSK-3s are inhibited by compounds such as lithium, they can “bypass” the normal methods of blocking these “pro-aging pathways” and can therefore make a direct impact towards reducing aging by inhibiting the Insulin/IGF pathway and inhibiting the mTOR pathway.  This mechanism may be why GSK-3 inhibitors are such powerful compounds.
  5. The GSK’s act by phosphorylating key molecules.  They prefer molecules which are already phosphorlated, so they can be thought of as being phosphorylation amplifiers.  They can increase phosphorylation, by a factor of 100 or 1,000.  With this kind of amplifier muscle, they can activate or shut down important signaling cascades.
  6. In normal resting tissues GSK-3s are active, turned on,  Many kinds of signals can turn GSK-3s off, for examples, insulin signaling and growth factor signaling.  The molecular process of turning GSK-3s off and degrading them is also phosphorylation, this time of the GSK-3 itself..
  7. GSK-3 plays important roles in both the innate and adaptive immune systems.  For this reason, GSK-3 inhibition may help treat some types of autoimmune diseases where there is a hyperactive innate or adaptive immune system.
  8. GSK-3 plays a major role in inflammatory processes and in neuroinflammatory diseases in particular. Among its functions are control of various triggers of inflammation. And the production of pro and anti-inflammatory cytokines.
  9. There are two major isoforms of GSK-3, the alpha isoform which regulates longevity-related processes and he beta isoform which regulates aging and “shortivity”-related processes.  The main molecular bodies of the two isoforms are very similar, but they have different molecular “tails.” What they do biologically is quite different.
  10. GSK-3 alpha when active negatively regulates at least three pro-aging pathways: mTOR, Wnt and P53. Basically, in normal quiescent cells GSK-3α restrains runaway aging due to activation of these pathways.  If GSK-3α is not functioning normally, accelerated aging can occur.
  11. GSK-3β, on the other hand can promote the formation of both beta-amyloid plaques in the brain and tau tangles in nerve cells, the two main “usual suspect” causes of Alzheimer’s disease.  Unlike GSK-3α, its expression increases with aging.  It is thought to be an important long-term contributor to age-related neuro-degeneration.  GSK-3β plays a role in signaling pathways like those involved in glycogen metabolism.  It appears that its aberrant inhibition may be relevant in diabetes and neurodegenerative disorders.  This isoform also promotes degradation of NF-kappaB and reduction of inflammatory conditions. So it is far from being all-bad.
  12. Many health-beneficial effects are associated with inhibition of GSK-3β and activation of the beta-catenin pathway, including bone mass maintenance, less osteoporosis, reduced insulin signaling, less atherosclerosis and lowered blood pressure.  These might be limited however by competition for beta-catenin by pathways that respond to high states of oxidative stress, where beta-catenin is required as a cofactor.  Therefore, effective therapeutic inhibition of GSK-3β might require additional anti-oxidant interventions such as suppression of P66shc.
  13. Blocking GSK-3β enhances expression of many proteins, an example being Nrf2 since GSK-3β phosphorylates Nrf2.  This fact alone could explain some  of the health benefits induced by lithium and a number of phytosubstances.
  14. However, since GSK-3β also phosphorylates the inflammatory factor BF-kappaB, it appears that in the presence of inflammation there may be a cost trade-off to blocking expression of GSK3β.
  15. There appears to be a number of effective GSK-3β inhibitors.  Lithium is a good one, and many its neurological impacts and others of its health-producing effects could be due to GSK-3 inhibition, lower cholesterol, less oxidized LDL signaling.
  16. While beneficial effects can sometimes be realized by inhibiting GSK-3, care must be taken that such inhibition or activation does not also produce a negative effect via the other isoform or via a different pathway than that targeted.  As a phosphorylation amplifier, like a PA system amplifier GSK-3t does not necessarily pay attention to the message itself.

 THE SCIENCE OF GSKS

1.  INTRODUCTION TO THE GSKs – serine/threonine protein kinases

They are “Molecular Multi-taskers” that functions as “signal amplifiers” for kinase cascades and transcription factor activation of genes

Discovered in the 1980s,GSKs3s were at first thought to merely be a “negative regulator” of glycogen synthase, and thus got their name.  However, as more and more research has been done, the consensus emerged that GSKs exerts a broad, regulatory influence on 50+ targets and that glycogen synthesis inhibition was not the primary function of GSKs.  Today we know that at least 25 transcription factors are activated/inhibited by GSK-3s  and an additional 25+ other proteins are activated/inhibited by GSK-3s.  For this reason, GSK-3s are are now viewed as “multitasking molecules” that act as “signal amplifiers” for many molecular pathways involving inflammation, gene expression, cell mobility, and apoptosis.  Most recently, it has become clear that GSK-3s regulate lifespan as well.  GSK-3s now are well documented to play a role in Alzheimer’s disease, Chronic Traumatic Encephalopathy, Fronto-temporal dementia, Multiple Sclerosis, Diabetes type II, Cancer, colitis, and arthritis.

GSK-3  do their “work” by phosphorylating substrates.  A kinase phosphorylates substrates (a molecule on which an enzyme acts) by transferring phosphate groups to them from high-energy donor molecules.  This in turn can have a profound effect on the properties of the phosphorylated substrate.  “The phosphorylation state of a molecule, whether it be a protein, lipid, or carbohydrate, can affect its activity, reactivity, and its ability to bind other molecules. Therefore, kinases are critical in metabolism, cell signalling, protein regulation, cellular transport, secretory processes, and countless other cellular pathways(ref).” And, in its special role of being a kinase amplifier, GSK-3 can be considered to be “the mother of all kinases.”

The GSKs have a rather special property in that they only phosphorylate substrate proteins that are already phosphorylated, and in this respect function essentially as phosphorylation amplifiers. The literature speaks of already-phosphorylated substrates as being “primed,” and the GSKs impact differently on primed and unprimed substrates.

2.  Substrates phospherylated by GSK-3 These include the following:

A. Transcription factor phosphorylation – GSK-3s activate at least 13 transcription factors and inactivate 12 transcription factors by phosphorylation. This, of course, implies contributing to turning genes on and off. As mentioned, GSKs prefer phosphorylating these transcription factors if they are “primed”. That means that another kinase must phosphorylate the transcription factor first. Only then, GSK-3 will come along and further activate the transcription factor. In this sense, GSKs are “amplifiers” of another signaling kinase cascade. (sort of like how p66shc is a “ROS amplifier” for redox signaling).

B. Non-transcription factor proteins – GSK-3s activate another 10 non-transcription factor proteins and inactivate another 14 non-transcription factor proteins. For these proteins, the GSK-3s also prefer activating the “pre-primed” proteins that have already been phosphorylated on another residue by another kinase cascade. Thus GSK-3s also function as a “kinase cascade amplifier”, rather than an original stimulus for the pathway. Think, then, of GSK signaling being like mass-media signaling, in some cases indifferent to the messages being communicated.

Here is a diagram of the transcription factors that are substrates of GSK phosphorylation.  The yellow ones are activated and the black ones are inactivated.  The diagram has left off the STAT transcription factors, which include STAT1, 2,5, and 6.  The “big picture” here is that GSK-3s act as a “kinase signal amplifier” to increase gene expression or increase gene suppression by phosphorylating the transcription factor.  GSK-3 inhibitors would have the opposite effect on these transcription factors, meaning that the black ones would be “yellow” and the yellow ones would be “black” with a GSK-3 inhibitor such as Lithium, a non-selective  “ATP noncompetitive inhibitor” of GSK-3β, or maleimide derivatives, which are selective “ATP competitive inhibitors” of GSK-3β.

Reference: May 2014  GSK-3 as potential target for therapeutic intervention in cancer

 Image may be NSFW.
Clik here to view.
GSK1

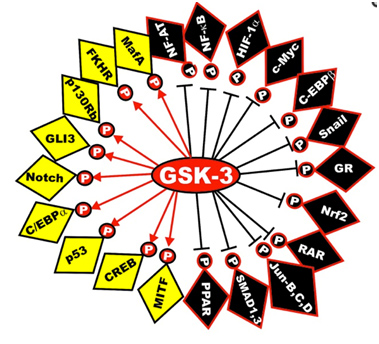
Next is a diagram of the other proteins that are activated or inactivated by GSK-3s. The yellow ones are activated by GSK-3s, whereas the black ones are inactivated by GSK-3 phosphorylation. As mentioned below, a GSK-3 inhibitor such as Lithium, a Maleimide derivative, or a Thiadiazolidindione would exert the opposite effect, turning the yellow proteins “black” and the black proteins “yellow”.

Illustration reference:   GSK-3 as potential target for therapeutic intervention in cancer

Image may be NSFW.
Clik here to view.
GSK2

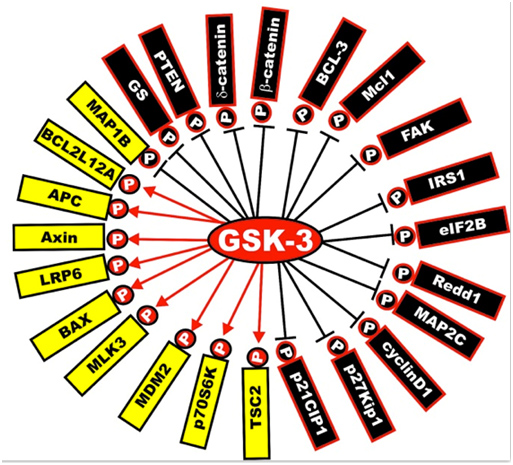
Frequent readers of this blog can note that GSK-3 impacts on a great many of the “usual suspects” related to disease processes and aging. That is their importance.

3.  How GSK-3s are activated and how they are inactivated

Ser-9 or Ser-21phosphorylation inactivates GSK-3s.

GSK-3s are normally activated when the cell is resting, but are inactivated by external stimuli. For instance, GSK-3s are actively inhibiting glycogen synthase until insulin signaling occurs. Then insulin inhibits GSK-3 and thus the “inhibition of an inhibitor of glycogen synthase” results in the synthesis of glycogen within the cell (liver, muscle, or fat cell). Most all of the ways that GSKs are inactivated is via phosphorylation of GSK-3.  This “phosphoinactivation” pathway goes through PI3K.  Growth factors, amino acids, Toll-like receptors (TLR), T cell receptor (TCR), CD28, and cytokine receptors have all been shown to mediate the PI3K/Akt-mediated “phosphor-inactivation” of GSK-3α and GSK-3β.  GSKα is inactivated by the phosphorylation of Serine 21 (Ser-21).  GSK-3β is inactivated by the phosphorylation of Serine 9 (Ser-9). Activation of Akt occurs when it is phosphorylated at thr-308 by PDK1 and with phosphorylation of Ser-473 by mTORC2.

Upon activation by PDK1 + mTORC2, Akt can phosphorylate GSK-3β at Ser-9.  PKC, p70S6K, p90RSK, and PKA can phospho-inactivate GSK-3s as well.  Inactivation of GSK-3s results in the activation of transcription factors important for regulating the innate and adaptive inflammatory response. The following diagram illustrates  how GSK-3s are inactivated and what their downstream targets are:

Reference for illustration:2012 Glycogen Synthase Kinase 3: A Point of Convergence for the Host Inflammatory Response

Image may be NSFW.
Clik here to view.
GSK3

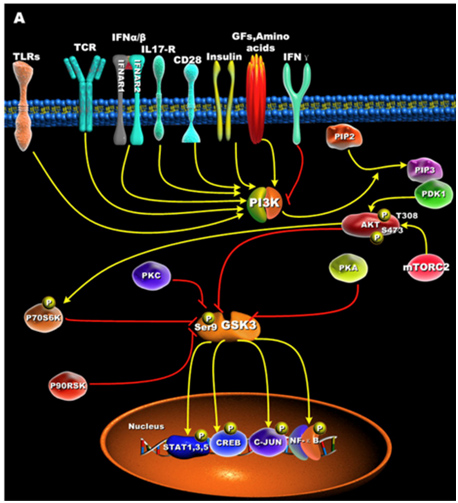
4.  Isoforms of GSK-3

There are two isoforms of GSK-3, alpha and beta.

a. The “alpha isoform” of GSK-3

- a longevity regulator – the mainly good guy

GSK-3α is encoded from a distinctly different gene than GSK-3β. GSK-3 isoforms also have different substrate preferences, especially in the brain (probably the same in peripheral tissues).  GSK-3α expression does NOT increase with aging, whereas GSK-3β expression increases with aging.  Whereas GSK-3β “knock out” embryos die by day 16 due to liver failure, GSK-3α knockout mice are viable and display increased insulin sensitivity and reduced fat mass.  However, these GSK-3α “knock outs” still have metabolic and neurological abnormalities in adulthood.

GSK-3α is most abundantly expressed in the brain with particular abundance in the hippocampus, the neocortex, and the cerebellum.    In the hippocampus, GSK-3β is more abundantly expressed than GSK-3α (GSK-3α is the “good GSK 3″, whereas GSK-3β is the “bad GSK-3,” though not always).  There is mounting data that GSK-3α is an “upstream cause” of longevity and that GSK-3α negatively regulates three pro-aging pathways – mTOR, Wnt, and p53.  However, GSK-3α does not seem to have that much of an effect on another pathway we would like to see suppressed in aging, the Insulin/IGF pathway (see below).

A.  Inhibition of the mTOR pathway – GSK-3α inhibits mTOR and this is the primary mechanism by which GSK-3α exerts its “anti-aging effects”.   In GSK-3α “knock out” mice, there is an increase in the phosphorylation of three mTORC1 targets:  4E-BP1, S6 Kinase, and ribosomal S6 protein.  This results in a decline in autophagy of these GSK-3α “knock out” mice. The three markers of autophagy reduced in these GSK-3α  “knock out” mice are ATG6, LC3-I/II ratio, and p62.

It also appears that GSK-3α is needed for autophagosome formation.

In summary, the “unrestrained” or “constitutive up regulation” of the mTOR pathway appeares to be the major mechanism by which GSK-3α “knock outs” exhibited accelerated aging.

B. Inhibition of Wnt signaling – The inhibition of Wnt signaling is a minor mechanism by which GSK-3α works.  WNT signaling can be a “pro-aging pathway”.  Klotho-deficient mice have accelerated aging due, in part, to increased Wnt signaling.  GSK-3α inhibits Wnt signaling by phophosphorylating beta-catenin, which targets it for ubiquitin proteasomal degradation.

C. p53/sestrin pathwaySestrins are target genes of p53. Sestrins protect cells from various stressors by functioning  as antioxidants and as mTORC1 inhibitors.  GSK-3β can regulate p53 activity, but I am not sure if GSK-3α can do the same.

D. Insulin/IGF-1 pathway – Although GSK 3α “knock out” mice have an increased expression of IRS-1, this does not result in an increase in Akt phosphorylation or activation of downstream targets of the Insulin/IGF pathway.  For this reason, it does NOT appear that GSK-3α has that much of an effect on the Insulin/IGF pathway.

GSK-3α activity is increased by phosphorylation of tyrosine-279 and GSK-3α activity is decreased by phosphorylation of serene-21.  Thus upstream “phosphorylators” of GSK-3α  can regulate how active this protein is.   Unfortunately, I could not find any inhibitors or activators of GSK-3α Most of the work in GSKs has been focused on GSK-3β, which is the “bad GSK”.

Reference:May 2014  GSK-3 as potential target for therapeutic intervention in cancer

b. The “beta isoform” of GSK

- a pro-aging regulator, especially in the brain, the necessary but sometimes bad guy

The strongest data on the fact that GSK-3β is “upstream” in the cause of neurodegenration is the fact that GSK-3β induces both the formation of Amyloid-beta aggregates and also results in the hyperphosphorylation of tau.  The molecular mechanism for both of these GSK-3β effects are now well established.  No other explanation for AD has been shown to explain both the Amyloid beta part of this disease and the tau hyperphosphorylation part of this disease. GSK-3β expression increases with aging.  it appears to be a “pro-aging” pathway that is “upstream” and occurs prior to the formation of the following events and pathologies in the brain”

A. Synaptic dysfunction – Synaptic dysfunction is an “early feature” of AD.  It precedes and may even cause the neurodegeneration.  Both GSK isoforms are expressed in synapses, especially the hippocampal synaptosomes

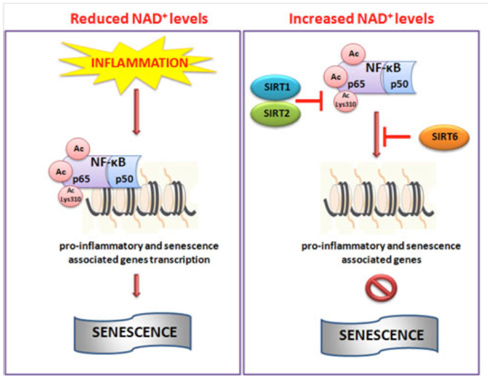
B. GSK-3β and NF-kB – GSK-3β phosphorylates NF-kB and promotes the proteasomal degradation of NF-Kb NF-kB is the master of inflammation.  It is no surprise then to find out that there are many interactions between GSK-3β and the NF-kB pathway.  First of all, GSK-3β directly phosphorylates NF-kB at serene 468. This results in the proteasomal degradation of NF-kB. In addition, GSK-3β interacts with I-kappaB alpha in epithelial cells.  This results in the prevention of the degradation of I-kappaB alpha. Thus GSK-3β has an anti-inflammatory effect on the NF-kB pathway. This appears to be an exception to the idea that this GSK-3β isoform is “bad” for aging people.

C. GSK-3β and Wnt signaling – GSK-3β is a central figure in Wnt signaling – it can either increase the degradation of beta-catenin (in unstimulated cells) or increase Wnt/beta-catenin signaling in stimulated cells. The importance of this is treated below when we discuss how GSK-3β is involved in malignant transformations in certain cancers. In the Wnt pathway, scaffolding regulatory proteins control the specificity of GSK-3β mediated signaling.  In the absence of cell stimulation, CK1 phosphorylates beta-catenin at S45.  This “primes” beta-catenin for subsequent phosphorylation by GSK-3 at S41, S37, and S33. These phosphorylation targets target beta-catenin for ubiquination and proteasomal degradation.  The following diagram illustrates this.

Reference: May 2014  GSK-3 as potential target for therapeutic intervention in cancer

Image may be NSFW.
Clik here to view.
GSK4

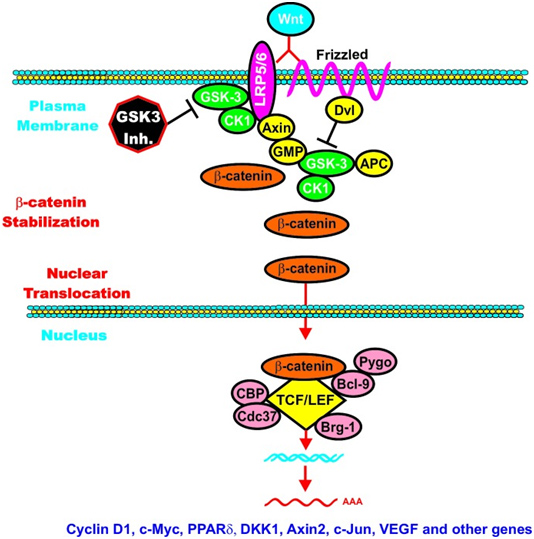
 Wnt/beta-catenin induced gene expression is modulated by GSK-3.

However, once the cell is stimulated by Wnt, then the GSK-3 pathway can activate the Wnt-catenin signaling pathway, increasing its activity like an “amplifier”. The molecular mechanism here is the phosphorylation of LRP5/6, which stabilizes Axin. Here is an illustration of this:

Again from Reference: May 2014  GSK-3 as potential target for therapeutic intervention in cancer

Image may be NSFW.
Clik here to view.
GSK5

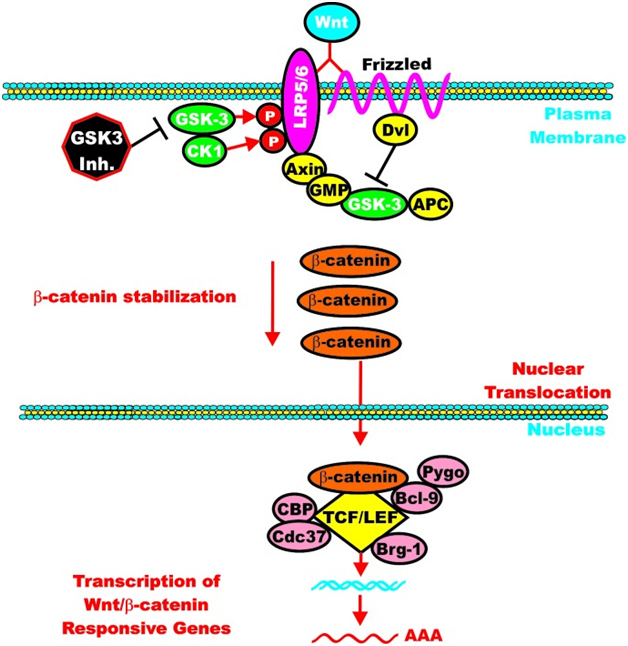
GSK-3 can enhance Wnt/beta-catenin signaling

D. GSK-3β and c-Myc

GSK-3 can regulate c-Myc activity. c-Myc controls cell division and the cell cycle via the CDC25 gene. c-Myc also influences the gene expression of GADD45, the DNA damage pathway that functions as a tumor suppressor by arresting the cell cycle.

Reference:Phosphorylation-dependent degradation of c-Myc is mediated by the F-box protein Fbw7

E. GSK-3β and p53There is direct interaction between p53 and GSK- after DNA damage to induce apoptosis

After DNA is damaged, the tumor suppressor p53 is the key intermediate that induces either cell cycle arrest or apoptosis of the cell. Apoptosis by p53 after DNA damage is triggered by cysteine/aspartate proteases, such as Caspace-3. However, until recently, there was no explanation for how p53 activated Caspace-3. Then in 2002, Jope and colleagues from UAB showed that with chemotherapy induced DNA damage, the nuclear localized GSK-3β was activated. However, this GSK-3β activation was not due to the normal method of activation, which is the phosphorylation of Tyr-216 on GSK-3β. Instead, there was a direct protein-to-protein interaction between p53 and GSK-3β and this association actuated GSK-3β, making it an active protein that then would phosphorylate other proteins (such as tau).

Reference: 2003Direct, activating interaction between glycogen synthase kinase-3β and p53 after DNA damage

  5.  Differential GSK Inactivation and Differential Timing of GSK-3 induced activation/inactivation of Transcription Factors

The diagrams above did not include the STAT family of transcription factors.  These STAT factors are important because of their roles in oncogenic transformation [“Stats (for signal transducers and activators of transcription) are a family of transcription factors that regulate cell growth and differentiation. Their activity is latent until phosphorylation by receptor-associated kinases. A sizable body of data from cell lines, mouse models, and human tissues now implicates these transcription factors in the oncogenesis of breast cancer(ref). Because Stat activity is modulated by several posttranslational modifications and protein-protein interactions(ref), these transcription factors are capable of integrating inputs from multiple signaling networks. Given this, the future utilization of Stats as prognostic markers and therapeutic targets in human breast cancer appears likely(ref).”]  STAT3 and STAT5 are preferentially activated by GSK-3s, whereas STAT1 and STAT6 are not activated very much by the GSK-3s.  Although STAT1 is not activated early by certain signaling stimuli (Ex: IFGAR1/2), the same transcription factor can be activated late by GSK-3s. The diagram below illustrates how GSK-3s regulate the STAT family of transcription factors.

Reference for illustration: 2012 Glycogen Synthase Kinase 3: A Point of Convergence for the Host Inflammatory Response

Image may be NSFW.
Clik here to view.
GSK6

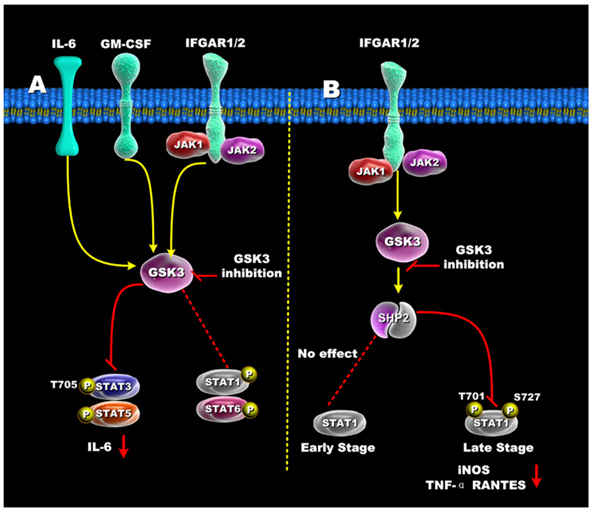
“Regulation of STATs by GSK3 — (A) In IFN-γ, GM-CSF, and IL-6 stimulated cells, GSK3 inhibition suppressed both STAT3 and STAT5 activity, but only minimally affected STAT1 and STAT6 activity. (B) GSK3-β inhibition differentially affects early and late STAT1 activation in IFN-γ-treated cells. Inhibition of GSK3 had no effect on early STAT1 activity (<1hr) but diminished late STAT1 phosphorylation by increasing SHP-2 activity. The ability of GSK3 inhibition to reduce STAT1 activity resulted in reduced levels of iNOS, TNF, and RANTES by IFN-γ-stimulated macrophages.”

  6.  The Four Ways that GSK-3 activity is regulated

The activity of GSK-3s is highly regulated. Four key mechanisms have been identified that regulate GSKs. They are

1)The phosphorylation of GSK3 itself, 2) the sub cellular localization of GSK3s, 3)The formation of protein complexes containing GSK3s, and 4)the phosphorylation state of the GSK3 substrates. The diagram below illustrates these 4 regulatory mechanisms:

Reference  2007 Glycogen Synthase Kinase-3 (GSK-3): Inflammation, Diseases, and Therapeutics

Image may be NSFW.
Clik here to view.
GSK7

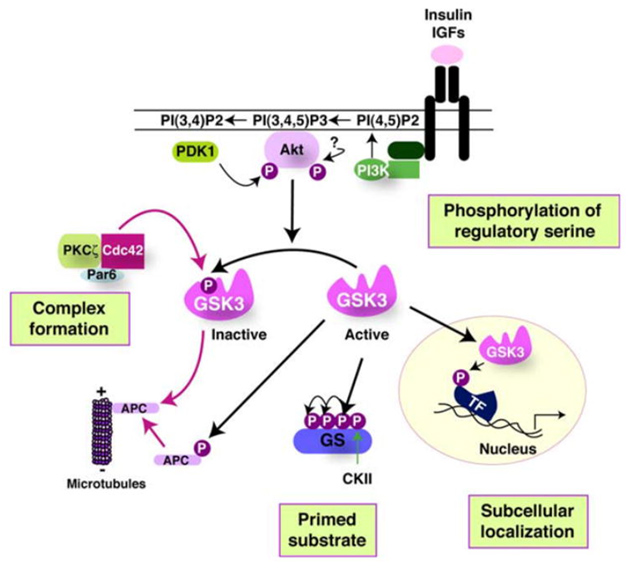
7.  Primed vs Non-primed sustrates

Active GSK-3s exhibit a 100 to 1,000-fold increase in substate specificity for pre-primed substrates, compared to non-primed substrates.  N-terminal phosphorylation of GSK-3β (Ser9) acts as a “pseudosubstrate” for the phosphate binding site and thus competes for the binding of arginine 96 with pre-primed, vs non-primed substrates.  The diagram below shows what this effect does with pre-primed substrates.

Reference:  Glycogen Synthase Kinase 3: A Point of Convergence for the Host Inflammatory Response

Image may be NSFW.
Clik here to view.
GSK8

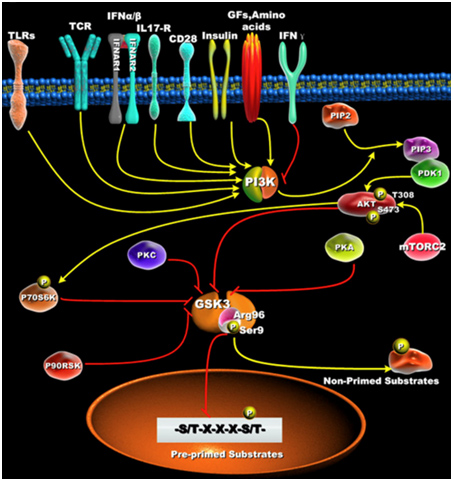
“ — it is first important to define GSK3’s preference to phosphorylate substrates that are pre-primed (pre-phosphorylated) on a serine or threonine located around a five amino acid consensus sequence corresponding to serine/threonine-X-X-X-serine/threonine-P, where the first serine or threonine is the residue to be phosphorylated by GSK3, X can be any amino acid, and the last serine- or threonine-P is the pre-primed (pre-phosphorylated) residue [42](Figure 1B). The preferential phosphorylation of pre-primed (pre-phosphorylated) substrates by GSK-3 has been shown to result in increasing substrate phosphorylation efficiency by more than 100 to 1000-fold, as compared to non-primed substrates [43].”

8.  GSK-3S and Aging – Is it Due to Alpha or Beta?

There is a lot of confusion as to whether GSK-3s are “pro-aging” or “anti-aging” factors.  The answer is “both”.  It is becoming clear that GSK-3s are both the activators of aging (GSK-3 beta) and the inhibitors of aging (GSK-3α).  GSK-3α and GSK-3β are 98% identical in their kinase domains, but due to their N-terminal and C-terminal ends, their effects on aging are the opposite.  The effect of GSK-3s on downstream target proteins is their ability to phosphorylate the “downstream target” protein. Phosphorylation of the GSK 3 target usually inactivates it and may in some cases, result in the proteasomal degradation of the down stream target protein (i.e. by the UPS system). Unlike most protein kinases, GSKs are typically active in unstimulated cells and when the cell is activated, the GSKs are inhibited.

 9.  Inhibition of GSK-3 β signaling by lithium

Most importantly, there is something that we can do about GSK 3β signaling (the pro-aging form).   Lithium has been known to increase activator protein 1 (AP-1) binding to DNA, but the exact mechanism of action eluded researchers for a long time.  Once GSK-3β was discovered, the mystery was solved.  GSK-3β phosphorylates c-Jun (JNK). This JNK phosphorylation prevents activator protein 1 (AP-1) from binding to DNA.  As a result, since Lithium inhibits GSK-3β, this inhibition resulted in an increase in AP-1 binding to DNA, thus activating many genes.  Lithium increases activator protein 1 (AP-1) binding to DNA by inhibiting GSK-3β, which then cannot phosphorylate JNK, which then cannot inhibit AP-1 binding to DNA.  In Item 10 below, we describe how lithium inhibition of GSK-3β also extends concentrations of Nrf2 by preventing phosphorylation of Nrf2 by GSK-3β.

References:

Lithium carbonate or Lithium chloride, compounds that have been used since 1871 by psychiatrists for treating mania, bipolar illness, and depression.  The FDA approved Lithium in 1970 and although most patients have now been treated with other medications for depression and bipolar illness, it is still available and is inexpensive.  Lithium has already been proven to prolong lifespan in all lower animals.  Lithium is a safe, clinically effective inhibitor of GSK 3β.  At high levels used for treating psychiatric conditions, there are a lot of side effects.  However, at lower concentrations needed to inhibit GSK-3s, there are very few side effects.  The following facts support this emerging view that Lithium is a longevity agent that works via GSK-3 inhibition and promotes longevity and decreased neurodegeneration.

A. Low dose lithium uptake promotes longevity in humans and metazoans - A large Japanese cohort study was done and reported in 2011 which showed that tap water-derived lithium and a longevity effect. There was an inverse correlation between drinking water lithium concentrations and all cause mortality in 18 different Japanese municipalities with a total of 1,206,174 people (p = 0.003). These same authors also showed that low dose lithium exposure of lithium chloride extended life span in C elegans (p = 0.047).

Reference:  2011 Low-dose lithium uptake promotes longevity in humans and metazoans

B. Lithium administration increases brain gray matter - Several studies of patients with bipolar illness who were treated with Lithium showed dramatic, measurable, statistically significant increases in brain gray matter. (p = 0.0043)

References:

C. Lithium in tap water reduces suicide mortality - A large study of 40 different municipalities in Japan showed that there was an inverse relationship between suicide and tap water lithium levels in the Aomori prefecture. The Aomori prefecture has the highest rates of suicide mortality in Japan. This study suggests that the low dose lithium in tap water may protect those who drink tap water from depression, which is the leading reason why Japanese commit suicide.

Reference: 2011 Low-dose lithium uptake promotes longevity in humans and metazoans

10.  Inhibibiting GSK- enhances expression of Nrf2 since GSK- phosphorylates Nrf2.

Many of the health effects of GSK-3β inhibition and the use of lithium may be due to this effect.  See the 2012 publication Structural and functional characterization of Nrf2 degradation by the glycogen synthase kinase 3/β-TrCP axisHere, two-dimensional (2D) gel electrophoresis and site-directed mutagenesis allowed us to identify two serines of Nrf2 that are phosphorylated by glycogen synthase kinase 3β (GSK-3β) in the sequence DSGISL.”  And see the 2013 publication Nrf2 is controlled by two distinct β-TrCP recognition motifs in its Neh6 domain, one of which can be modulated by GSK-3 activity, Supression of GSK-3β signaling could also explain why lithium works in part by activating Nrf2 signaling  See the just published report Antiarrhythmic effect of lithium in rats after myocardial infarction by activation of Nrf2/HO-1 signaling.  “In conclusions, lithium protects ventricular arrhythmias by attenuating NGF-induced sympathetic innervation via antioxidant activation of Nrf2/HO-1 axis.” We have written extensively in this blog about the important health benefits of the Nrf2 pathway(ref)(ref)(ref).

An important corollary of this could be that phytochemical activation of Nrf2 could be frequently or even generally mediated by inhibition of GSK-3β.  At least this appears to be the case for the phytochemical nordihydroguaiaretic acid.  See the 2012 publication  Signaling pathways activated by the phytochemical nordihydroguaiaretic acid contribute to a Keap1-independent regulation of Nrf2 stability: Role of glycogen synthase kinase-3.  “Our study demonstrates that NDGA activates Nrf2 through multiple signaling cascades and identifies GSK-3β as an integrator of these signaling pathways and a gatekeeper of Nrf2 stability at the level of the Neh6 phosphodegron.”  We want to do further research and check out whether this corollary is also true for the many other phyto substances which activate Nrf2.  In Vince’s treatise he identified 36 of these. If the corollary is generally correct, it might explain the puzzling issue of how phytochemicals upgrade the expression of Nrf2.

11.  GSK 3s and Inflammation – Diabetes, Cancer, Multiple Sclerosis, Alzheimers, and Colitis

It is now clear that Glycogen Synthase Kinase 3 plays an important role in several diseases via their ability to up regulate inflammation.  GSK-3s are powerful regulators of inflammation because of their ability to act as a “kinase cascade amplifier”.  As a result, GSK-3s have been found to play an important role in the CNS neuroinflammatory diseases such as multiple sclerosis, Alzheimer’s disease, and  mood disorders.  Here the cells that are involved include microglia and astrocytes.  GSK-3s also play a key role in peripheral inflammatory disease such as colitis and arthritis via macrophages/monocytes.  GSK-3s also appear to play a role in Diabetes via their local inflammation effect and in Cancer via their general inflammation effect.  The diagram below illustrates this:

Reference for diagram:2007 Glycogen Synthase Kinase-3 (GSK3): Inflammation, Diseases, and Therapeutics

Image may be NSFW.
Clik here to view.
GSK9

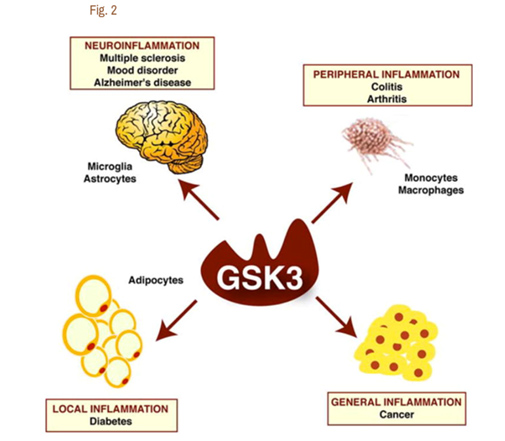
A. GSK-3s and TLR-induced inflammation – Since GSK-3s have such a vital role in inflammation, GSK-3 inhibitors have been shown to have a very strong anti-inflammatory effect on a cellular level.  The brain normally is protected from the classical immune inflammatory response, however. This is probably one of the most important roles of the blood brain barrier (BBB) and is why the brain has been referred to as “immune privileged”.  Unfortunately, when the BBB is disrupted or inflamed, macrophages or monocytes invade the brain and activate resident glia cells, including astrocytes and microglia.  This is why with many neurodegenerative disorders, gliosis is a sine qua non of the disease on histology. The primary way that GSK-3s amplify inflammation is in the toll-like receptor (TLR) induced inflammation.  Here are the classic TLR receptor and what activates them:

TLR receptor subtype        What activates them

  • TLR2                    lipoteichoic acid from Streptococcus pneumonia
  • TLR4                    synthetic lipid A
  • TLR5                    flagellin protein from Salm typhimurium
  • TLR9                    human CpG

When any of the above TLR agonists are used to stimulate human peripheral mononuclear cells (PBMCs) in the presence of a GSK-3 inhibitor, there was a selective reduction of 50-90% in the pro-inflammatory cytokines IL-1β, IFN-γ, IL-12, and IL-6.  The following paragraph goes into more detail on this.

Reference:2012 Glycogen Synthase Kinase 3: A Point of Convergence for the Host Inflammatory Response

B. GSK-3s and cytokine-induced inflammation – Recent work has shown that GSK-3 activity is required for the full stimulation of the production of several pro-inflammatory cytokines.  This includes IL-6, IL-1beta, and TNFalpha, following stimulation by toll-like receptors in monocytes and peripheral blood mononuclear cells.  GSK-3s also modulate the production of the anti-inflammatory cytokine, IL-10.  When a GSK-3 inhibitor was used in vitro, the production of IL-10 increased by 3-5 fold in human monocytes activated with LPS.  On the contrary, GSK-3s increase the production of the pro-inflamatory cytokine, IL12.  When a GSK-3 inhibitor was used in vitro, it reduced the production of IL-12 by LPS-stimulated human monocytes by 70%.  With GSK-3 inhibitors, IL-6 and TNF-α production by LPS-stimulated monocytes was reduced by 60-80%.

C. GSK-3 isoforms are differentially activated with inflammation – Despite these harmful effects of GSK-3s, they are vital to life.  Deletion of the GSK-3β gene results in death of the embryo.  Adding GSK-3α is unable to “rescue” the GSK-3β “knock out” mice.  When probes were used to determine which GSK-3 was involved with inflammation, it was clear that GSK-3β was activated via the phosphorylation of Ser-9 by LPS-induced inflammation, whereas GSK-3α was not activated with LPS-induced inflammation.

References:

2007 Glycogen Synthase Kinase-3 (GSK3): Inflammation, Diseases, and Therapeutics

2005 Toll-like receptor-mediated cytokine production is differentially regulated by glycogen synthase kinase 3

 12. GSKs and Alzheimer’s disease

As we mentioned above, the GS-3s induce the phenomena thought to be the cause of Alzheimer’s disease according to both of the leading theories: the beta amyloid theory(ref) and the tau tangles theory(ref), since they promotes the expression of both beta-amyloid and tau tangles.  In fact,  GSK-3B is that it is the only protein that directly cause all of the following features of AD

  1. GSK-3 is increased in white cells early in Alzheimer’s disease. 

Reference: Glycogen synthase kinase-3 is increased in white cells early in Alzheimer’s disease

  1. GSK-3beta induces memory deficits in vivo, long before the appearance of Amyloid-beta aggregates and before the appearance of tau tangles.  Reference:  GSK-3 is essential in the pathogenesis of Alzheimer’s disease
  2. GSK-3alpha induces Amyloid beta productionand GSK-3alpha inhibition reduces GSK-3alpha reduces Amyloid beta production.  Reference:  GSK-3 is essential in the pathogenesis of Alzheimer’s disease
  3. Amyloid beta fragments (Abeta 25-35) activate tau protein kinase I(TPKI).   Reference: Activation of tau protein kinase I/glycogen synthase kinase-3beta by amyloid beta peptide (25-35) enhances phosphorylation of tau in hippocampal neurons
  4. Tau protein kinase 1 (TPKI) is the same thing as Glycogen Synthase Kinase 3beta (GSK-3B). Thus, GSK-3b IS THE ENZYME THAT ACTUALLY DOES THE HYPERPHOSPHORYLATION!  References: Physiology and pathology of tau protein kinases in relation to Alzheimer’s diseaseAlzheimer’s disease-like phosphorylation of the microtubule-associated protein tau by glycogen synthase kinase-3 in transfected mammalian cells

Synaptic dysfunction – Synaptic dysfunction is an “early feature” of AD.  It precedes and may even cause the neurodegeneration.  Both GSK isoforms are expressed in synapses, especially the hippocampal synaptosomes.

A very interesting angle is the role of GSK-3 in the relationship of H. pylori to Alzheimer’s disease.  A July 2014 publication Helicobact er pylori Filtrate Induces Alzheimer-Like Tau Hyperphosphorylation by Activating Glycogen Synthase Kinase-3β draws a connection:  “Abnormal hyperphosphorylation of microtubule-associated protein tau is involved in the pathogenesis of several neurodegenerative disorders including Alzheimer’s disease (AD). Helicobacter pylori (H. pylori) infection has been reported to be related with a high risk of AD, but the direct laboratory evidence is lacking. Here we explored the effect of H. pylori infection on tau phosphorylation. The results showed that H. pylori filtrate induced significant tau hyperphosphorylation at several AD-related tau phosphorylation sites, such as Thr205, Thr231, and Ser404, both in mouse neuroblastoma N2a cells and rat brains with activation of glycogen synthase kinase-3β (GSK-3β). Application of GSK-3 inhibitors efficiently attenuated the H. pylori-induced tau hyperphosphorylation. Our data provide evidence supporting the role of H. pylori infection in AD-like tau pathology, suggesting that H. pylori eradication may be beneficial in the prevention of tauopathy.”

13.  GSK-3s and cancer

Aberrant activity of GSK-3 has been implicated in many types of cancers, especially those that are resistant to chemotherapy, radiation therapy, and targeted therapy. Targeting GSK-3 may be a means to overcome the resistance of these cancers to certain chemotherapeutic drugs, radiation, and small molecule inhibitors.  Here are some example cancers where GSK-3 is known to be involved with carcinogenesis:

A. GSK-3 and beta-catenin in liver cancer - decreased GSK-3 levels due to HBx and ERK, HCV core protein GSK-3β is known to be involved with the formation of liver cancer.  The dysregulation of GSK-3β phosphorylation and inhibition of GSK-3β activity and beta-catenin signaling is the molecular mechanism involved with this type of cancer. In a recent study of 80 patients with hepatocellular cancer, the expression of GSK-3β protein was noted to be decreased.  However, exceptions to this trend were also found.  In some cancers, GSK-3β was noted to have high basal levels of S9-phosphorylated GSK-3β.

B.  HBx and ERK – The molecular mechanism by which GSK-3β levels are decreased in hepatocellular carcinoma appears to be related to one of the hepatitis virus proteins which is expressed in liver cells in the precancerous phase of liver cancer. This virally produced protein is called HBx.  HBx activates ERK.  This “primes” ERK for GSK-3β phosphorylation.  ERK phosphorylates GSK-3β at T43.  Then p90Rsk phosphorylates GSK-3β at S9, which then results in the inactivation of GSK-3β.  This inactivation of GSK-3β results in beta-catenin stabilization and signaling.  Similar molecular mechanisms occur which stabilizes paxillin, a cytoskeleton regulator.

C, HCV protein – Another way that GSK-3s are involved with hepatocellular carcinomas involves the HCV core protein.  HCV core protein increases in hepatic cancers and stabilizes beta-catenin levels. This occurs via the inactivation of GSK-3β by the phosphorylation of GSK-3β at Ser-9.  Once beta-catenin is stabilized, then it can enhance canonical Wnt/beta-catenin targets, such as c-Myc, cyclin D1, Wnt 1-inducible signaling pathway protein 2 (WISP2), and connective tissue growth factor (CTGF). All of these genes are up regulated when beta-catenin stabilized by the GSK-3 mediated HCV core protein.

D.  SIRT2  upregulation  – GSK-3β and beta-catenin signaling plays a role in the Sirtuin 2 mediated transformation of liver cells into hepatocellular cancer.  SIRT2 is up regulated in about 50% of hepatocellular cancers.  In these cancers, there is a shorter over all survival.  SIRT2 regulates the activation of Akt by deacetylating Akt.  Once Akt is deacetylated, it can then phosphorylate GSK-3β and inactivate the protein.  This activates the beta-catenin pathway and promotes cell migration of hepato-cellular carcinoma cells.  For this reason, many have suggested that GSK-3β is a “tumor suppressor” and that the loss of GSK-3β expression or activity may contribute to hepatocellular cancer development.  Thus, there appears to be a very good side to GSK-3β in addition to all the evil sides we have been describing.

E.  Cancer treatment with GSK-3β inhibitorsincreased survival in a Wnt/beta-catenin independent mechanism. Studies of GSK-3 inhibitor treatment of cancer cells have shown that cancers are inhibited with these compounds.  This is a paradoxical finding, since an “inhibitor of a tumor suppressor” should make the cancer cells grow. Instead, the cancer cells show a reduced survival and proliferation via a Wnt/beta-catenin independent mechanism.  Specifically, treatment of cancer cells with a GSK-3β inhibitor decreases telomerase expression (hTERT) and also reduces telomerase activity.  This occurs with both non-selective inhibitors such as Lithium and with selective inhibitors such as SB-415286.  Here their anti-cancer effects are mediated by apoptotic signaling (Caspace-8, caspace-3, and p53 gene activation).

Conclusion:  Hepatocellular cancer development can be explained in part by the down-regulation of GSK-3β activity by HBx/ERK mechanisms, by HCV protein mechanisms, and by SIRT2 dependent mechanisms.  These studies suggest that GSK-3β functions as a tumor suppressor and that an inhibitor would have an adverse effect on cancer, causing the cancer to proliferate.  However, the opposite effect occurs when GSK-3 inhibitors are used on cancer cells.  Instead, the cancers show reduced survival and proliferation via Wnt/β-catenin independent mechanisms involving hTERT and apoptotic proteins.  Again, an example of how interacting pathways sometimes work to produce unexpected results.

Thus, GSK-3 inhibitors show promise in the treatment of cancer.

Reference: May 2014  GSK-3 as potential target for therapeutic intervention in cancer.

14. GSK-3s and signaling in selected pathways

The GSK-3s impact on a number of pathways that are involved both in embryogenesis and cancer processes, We comment on some of these.

A. GSK-3 and mTORC1 signaling – AMPK can down-regulate mTORC1 via GSK-3 induced TSC2 degradation. However, Wnt signaling can up-regulate the mTORC1 pathway via GSK-3 via beta-catenin mediated inhibition of TSC2 degradation. GSK-3 always prefers “primed substrates.” This is true for the tuberous sclerosis complex 2 (TSC2) in the mTOR pathway. Specifically, AMPK can act as the “primer” and first phosphorylates TSC2. Then GSK-3 will phosphorylate TSC2 and thus activate the proteasomal degradation of TSC2. This results in the down-regulation of the mTOR pathway. In contrast, Wnt signaling suppresses the GSK-3 mediated phosphorylation of TSC2. This results in the activation of the mTOR pathway. Rapamycin inhibits mTORC1 and this then suppresses the Wnt/beta-catenin induced cellular proliferation of cancer. This is how GSK-3 plays a role in cancer via the mTORC1 pathway. In addition to GSK-3, three other proteins are involved in the modulation of the effects of Wnt signaling on cancer (DKK1, Dvl, and Axin).

B. GSK-3 and SMAD1 - MAPKs can “prime” SMAD1 and then GSK-3 can activate the “primed” SMAD1 transcription factor. The SMAD1 transcription factor is the downstream transcription factor that mediates the effects of TGF-beta superfamily ligands such as BMPs. SMAD1 signaling is often increased in cancer. As mentioned before, GSK-3 prefers “primed substrates”. In this case MAPKs such as ERK, JNK, and p38 can each phosphorylate SMAD1. Then GSK-3 will phosphorylate SMAD1 and thus induce its ubiquitinylation and proteasomal degradation. As seen with the other examples above (TSC2), Wnt signaling suppresses the GSK-3 mediated phosphorylation of SMAD1 and therefore prevents the proteasomal degradation of SMAD1. This system of regulation plays an important role in embryonic pattern formation during embryogenesis.

C. GSK-3 and Hedgehog Pathway - GSK-3 plays a role in segmental pattern formation in the embryo. The Hedgehog pathway is very important in development (embryogenesis), but is normally silenced in most adult tissues. However in cancer, the Hedgehog pathway can be re-activated. The classic cancers where the Hedgehog pathway is re-activated are basal cell carcinoma of the skin and medulloblastoma. Here constitutive Hedgehog pathway activation occurs due to mutations in various genes of the Hedgehog pathway such as the receptor, patched 1 (PTCH1) or smoothened (SMO). Other types of Hedgehog signaling occurs in cancer too. One of the most common is paracrine Hedgehog signaling. This occurs in a subset of epithelial cancers found in the colon, panaceas, and ovaries. Here the cancer cells secrete Hedgehog ligands which then activate Hedgehog signaling in the surrounding non-cancerous stroma cells, creating a “cancer favorable environment” for the cancer cells to grow and then for the cancer cells to invade the stroma (i.e. local recurrence of cancer).

Most of what we understand about the Hedgehog pathway comes from studying embryology.  During embryogenesis, the Hedgehog pathway regulates segmental pattern formation via three genes: desert hedgehog (DHH), Indian hedgehog (IHH), and sonic hedgehog (SHH).  Hedgehog ligands bind to their receptor, PTCH1.  This causes the internalization and degradation of smoothened (SMO), which then promotes the dissociation of SUFU-glioma associated oncogene homolog (GLI).  GLI3 can be phosphorylated by PKA, GSK-3 and CK1.  Once GLI3 is phosphorylated, it becomes a transriptional repressor.  Activatee GLI1 proteins stimulate the transcription of Hedgehog target genes, which includes IGF2.  IGF2 has been shown in some cancers to induce PI3K/PTEN/Akt/mTOR pathway and thereby increase cancer cell proliferation and survival.  In addition, IGF2 can also inhibit GSK-3β.  GSK-3 can positively regulate hedgehog signaling.  When GSK-3 is activated, the hedgehog signaling pathway is activated.  When GSK-3 is inactivated, then the hedgehog signaling pathway is promoted.  GSK-3 affects hedgehog signaling pathway via the phosphorylation of SUFU, a binding partner for GSK-3β.

D. GSK-3 and Notch Signaling PathwayGSK-3 regulates notch signaling, EBV viral protein EBNA2 is a “biological equivalent” of a Notch receptor. Notch signaling plays an important role in a wide variety of cancers. The prototypical cancer where Notch signaling is unregulated is T cell acute lymphoblastic leukemia (T-ALL). In T-ALLs, 50% of cancers have Notch signaling up regulated. However, it is also up regulated in some breast cancers, cervical cancers, pancreatic cancers, endometrial cancers, renal cancers, lung cancer, colon cancer, head and neck cancer, Hodgkin’s lymphoma, and large cell anapestic lymphoma. The most common way that Notch Signaling is up regulated in cancer is the over-expression of the receptor gene.

The classic form of Notch 1 receptor over expression is seen in cervical cancer. 99% of cervical cancers are associated with high risk HPV virus. The viral oncogenes E6 and E7 disrupt the cell cycle regulation by targeting p53 and Rb. However, the E6 and E7 disruption of the cell cycle control by p53 and Rb is not enough to transform the cervical epithelial cells into cancer cells. To do this, the Notch 1 receptor must be over-expressed. As the pre-malignant cells progress farther and farther towards becoming cancer cells, the expression of Notch 1 receptor gradually increases. It is not surprising when researchers found out that the up regulation of the Notch 1 receptor was induced by E6 and E7 viral oncogenes.

There is another small class of tumors that appear to be caused by the Epstein Barr virus where Notch signaling has a very pivotal role. These cancers include Burkitt’s lymphoma, Hodgkin’s lymphoma, nasopharyngeal carcinoma, and lymphomas in immune compromised patients. The EBV can “immortalize” B lymphocytes and the process of B cell immortalization is a EBV protein called the “transactivator EBNA2″. EBNA2 controls the expression of several viral genes and cellular genes. EBNA2 is tethered to promoter regions of these genes by a cellular repressor called CSL. CSL resembles the physiological activation of CSL-repressed promoters by intracellular Notch receptors. Thus, the EBNA2 protein is the “biological equivalent” of an intracellular Notch receptor (N-ICD). EBNA2 and N-ICD have been shown to be partially interchangeable.

The primary way that the Notch Signaling Pathway is activated is by direct cell-to-cell contact.  One cell has what is called a “ligand” and the other cell has a “receptor” that matches the ligand.  The ligand-receptor interaction is what triggers the Notch signaling pathway.  There are six ligands that have been identified in human cells (DII1, DII3, DII4, Dik, Jagged1, and Jagged 2).  There are four transmembrane receptors found in the Notch signaling pathway (Notch 1, Notch 2, Notch 3, and Notch 4.  The cell-to-cell contact and binding of a Notch ligand to a Notch receptor (DII2, etc.) then can trigger a number of intracellular pathways, such as the Ras/MAPK pathway, the PKC/NF-kB pathway, the Wnt signaling pathway, the TGF-beta pathway, and the Sonic Hedgehog pathway (Shh).  All of these pathways promote tumor growth.  In the Shh pathway, GSK-3β phosphorylates NICD, This phosphorylation event results in the prevention of the proteasomal degradation of NICD.  This results in the prolonged survival of the NICD protein by preventing its proteasomal degradation.

Reference: May 2014  GSK-3 as potential target for therapeutic intervention in cancer

E. GSK-3β and Tumor cell Exosome Signaling -Tumor cells secrete exosomes rich in lipid-raft containing membranes that interact with other tumor cells by using Notch signaling to increase PTEN and GSK-3β expression in the target cell that the exosomes fuse with. Another very interesting study of pancreatic cancer cells has recently been done, focusing on the role of secreted exosomes from the cancer cells. Exosomes are “nano particles” made by the endosomal compartment of the cell.  These secreted nano particles contain both cell surface ligands that allow for docking onto the surface of other cells and surface ligands that trigger endocytosis by the cell that does the “receiving”.  This exosome/cell interaction led to the decreased expression of a nuclear Notch receptor target called Hes-1.  Unexpectedly, blocking presenilin resulted in the activation of PTEN and GSK-3β.  Conversely, inhibiting either PTEN or GSK-3β resulted in the increase in He’s-1 expression.  This inhibition increased the apoptotic response and decreased the survival of the cancer cells.

Reference: 2009, Essential role of Notch signaling in apoptosis of human pancreatic tumor cells mediated by exosomal nano particles

Cancer and GSK-3β – Conclusions:  GSK-1s play a major role in cancer by their interaction with the Wnt/beta-catenin pathway, the mTOR pathway, SMAD1, the Hedgehog pathway, and the Notch pathway.  In most all of these pathways, another kinase first primes the protein by phosphorylating the GSK-1 target first, then GSK-1beta phosphorylates the target protein.  This results in the proteasomal degradation of the protein that has been phosphorylated.  However with cancer, there is a dysregulation in GSK-3β.

 15. GSK- inhibitors - compounds and drugs that may help prevent or treat Alzheimer’s disease

There are a large number of compounds that have been shown to inhibit GSK-3s. The way they have been found is by In vitro testing of compounds to see if they can activate  GSK-3 inhibitor, the effects of these other GSK-3 inhibitors is additive. This means that the two together have a greater effect than either one could achieve alone (i.e. insulin + a GSK inhibitor). The GSK-3 inhibitors that have been found so far include metal cations, aminopyrimidines, arylindolemaleimide, thiadiazolidindiones, halomethylketones, peptides, and natural products derived from marine organisms. Here is a partial list of these compounds:

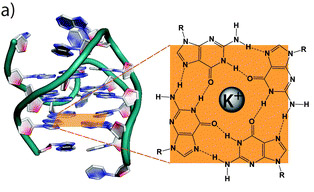
A. Metal Cations - non-selective, ATP noncompetitive inhibitors

We have already discussed lithium, the most important of these.  Several other divalent metal cations also inhibit GSK-3 by their divalent positive charge.  These include Beryllium, Copper, Mercury, and Tungsten.  Lithium appears to be the most selective GSK-3β inhibitor of this group of metal cations, however.  Unfortunately, these metal cations are NOT selective inhibitors of GSK-3.  For instance, Lithium chloride or Lithium carbonate will also inhibit casein kinase-2, p38 regulated/activated kinase, and MAPK activated protein kinase-2.  Lithium is also an inhibitor of polyphosphate 1-phosphatase and inositol monophosphate, two enzymes that are required for the synthesis of inositol.   Paradoxically, Lithium chloride has also been reported to acutely elevate phosphatidylinositol 3-phosphate levels in rat cerebellar granule cells, thereby activating PKB. It is this “non-selectivity” problem that has prevented the widespread use of Lithium chloride for other diseases other than depression and bipolar illness.

Many of the other metal cations mentioned above also have serious toxicity, such as Copper and Mercury. For this reason, these other metal cations are not likely to become “drugs” anytime soon.

References:

B. Valproic acid

Sodium valproate is also a weak inhibitor of GSK-3β.  Valproic acid increases activator protein 1 (AP-1) binding to DNA, but     only at much higher concentrations than lithium. The direct mechanism of how valproic acid works is similar to how lithium works.  At high concentrations, valproate can inhibit GSK-3β, and therefore activate SP-1 induced gene expression.  However, there is some debate as to whether clinical levels of valproate directly inhibits GSK-3β.  Clinically, It may be that Valproic acid inhibits GSK-3β by some indirect mechanism.

References:

C. Aminopyrimidines

These are synthetic compounds:

  • CT98014
  •  CT98023
  •  CT99021
  •  TWS119

C. Thiadiazolidindiones

One of the FDA approved GSK-3β inhibitors is Rosiglitazone, a drug with a somewhat rocky history.

D. Maleimide derivatives – SB-213763, SB-415286

 Maleimide derivatives were identified as leads from a high throughput screen of SmithKline Beecham compound bank against  rabbit GSK-3α.  SB-213763 is an arylindolemaleimide with an IC50 of 34 nM. SB-415286 is a anilinomaleimide with an IC50 of 78 nM.  Both of these are compounds that inhibit GSK-3α in a ATP competitive manner.  The two compounds were equally effective at inhibiting human GSK-3α and human GSK-3β.  The additional good feature of these molecules is that they are very selective kinase inhibitors and showed little or no inhibition of 24 other kinases when tested against these other kinase compounds in vitro. The maleimide derivatives have an “additive effect” with insulin to stimulate glycogen synthesis.  Unfortunately, the maleimide derivatives do not have any synergistic effects with other GSK-3 inhibitors, such as Lithium chloride.

E. ATP-competitive compounds

F. Natural products from Marine organisms

Several compounds have been found from marine organisms that inhibit GSK-3. They include the following:

  • 6-BIO
  • Dibromocantharelline
  •  Hymenialdesine
  •  Indirubins
  •  Meridianins

G. Halomethylketones

  • HNK-32
  • H. peptides

16. Inhibition of GSK-3β may remove the “ceiling” of the cardioprotective effects of certain phytochemicals in postconditioning after ischemia

At least, this appears to be the case for genistein, a soy derivative.  The 2009 publication The Ceiling Effect of Pharmacological Postconditioning with the Phytoestrogen Genistein Is Reversed by the GSK3β Inhibitor SB 216763 [3-(2,4-Dichlorophenyl)-4(1-methyl-1H-indol-3-yl)-1H-pyrrole-2,5-dione] through Mitochondrial ATP-Dependent Potassium Channel Openingreports:  “In conclusion, the cardioprotective effect of pharmacological postconditioning with genistein and 17β-estradiol involves mitochondrial KATP channels and is limited by a ceiling effect of protection.   This loss of cardioprotection is associated with a loss of Akt phosphorylation capacity with increased durations of ischemia.  However, this ceiling effect can be reversed by administration of the GSK3β inhibitor SB 216763 through the opening of mitochondrial KATP channels.”  This publication raises several interesting issues such as: 1. The roll of the mitochondrial KATP channels in post and possibly pre-conditioning, 2. Whether other phytochemicals might exercise similar effects possibly employing  other GSK-3β inhibitors such as lithium, and 3. Whether an enhanced pre-conditioning and post-conditioning effect can thus be realized for other forms of trauma such as surgery, head injuries, etc.

17. On scarcity of beta-catenin, impact of this on GSK3s, and missed opportunities for healh enhancement

The 2013 publication “Gone with the Wnts: Beta-catenin, T-Cell Factor, Forkhead Box O, and Oxidative Stress in Age-dependent Diseases of Bone, Lipid, and Glucose Metabolismintroduces an additional complication regarding health and longevity interventions based on GSK-3.Here is the diagram from that article:

Image may be NSFW.
Clik here to view.
GSK10

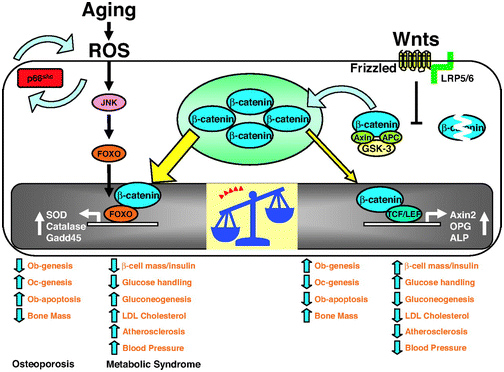
We mentioned above that GSK-3α inhibits Wnt signaling by phophosphorylating beta-catenin, which targets it for ubiquitin  proteasomal degradation.  Further that  WNT signaling can be a “pro-aging pathway,” and we discussed its role in cancer processes.

Normally, Wnt signaling induces positive effects on bone, the pancreas, and lipids.  Specifically, Wnt activation of the LRP5/6 Frizzled receptor induces inactivation of GSK-3β.  In addition, with plenty of beta-catenin in the nucleus, beta-catenin can act as a cofactor to activate the “downstream target genes of Wnt signaling”, which are mediated by the transcription factor,TCF/LEF.  This results in the activation of Axin2, OPG, ALP, and other genes that produce  the following phenotype:

Osteoblast stimulation and prevention of apoptosis => bone mass maintenance

  1. Osteoclast inhibition => no osteoporosis
  2. Beta-cell mass maintenance in the pancreas => normal insulin signaling
  3. Decreased gluconeogenesis by the liver => less non-dietary, hepatic-induced hyperglycemia
  4. Decreased LDL synthesis by the liver => lower LDL cholesterol levels => less oxidized LDL signaling via the Lectin-like LDL receptor of the cells => less p66shc activation
  5. Less atherosclerosis
  6. Lowered blood pressure

Unfortunately, there are other transcription factors that requires beta-catenin as a cofactor. These are the Forkhead Box transcription factors (FoxOs). FoxOs need beta-catenin as a cofactor for activation of the genes involving oxidative stress signaling. Thus FoxOs ”steal” beta-catenin away from TCF/LEF. This “shift to the left” of beta-catenin supply results in a change from the “beneficial effects” of Wnt signaling to the “adverse effects” of Wnt signaling.

The nuclear translocation of FoxO transcription factors (FoxO1, FoxO3a, FoxO4, and FoxO6) normally occurs by the inhibition of the Insulin/IGF-1 pathway, since Akt phosphorylation prevents the nuclear localization of FoxOs. However, nuclear translocation of FoxOs can all be triggered by ROS, by one of the MAPK kinases called c-Jun (JNK). In both scenarios, beta-catenin is required as a cofactor for the activation of genes required for cellular resistance to oxidative stress and DNA damage. (SOD, Catalase, Gadd45, etc.)

Conclusion: in the presence of oxidative stress, there can not be enough nuclear beta-catenin to “go around”. As a result, there is inadequate stimulation of the downstream targets of Wnt signaling and you develop the following phenotype:

  1. Decreased osteoblast activity and increased osteoblast apoptosis
  2. Increased osteoclast activity
  3. Decreased bone mass due to #1 and #2
  4. Decreased beta-islet cell mass in the pancreas and reduced insulin
  5. Increased gluconeogenesis by the liver
  6. Increased LDL cholesterol
  7. Increased atherosclerosis
  8. Increased blood pressure

All of the above phenotypes are classically seen with human aging. This is why GSK-3β inhibition alone will probably not “solve” aging.  Instead, we must do something about oxidative stress as well, probably something about P66shc expression.

We expect that the next blog in this Strange But Powerful Molecules Series will be about P66shc.


The Prospects that Emerging Science Offers Us for Long Healthy Lifespans – PowerPoint presentation for non-scientists

By Vince Giuliano

I rarely hesitate to talk about exciting research developments reported in this blog with my friends.  However, only a few people  in our local community of Wayland Massachusetts have known about the blog or our work on the aging sciences.    A few of my friends have suggested that I do a presentation on our work for the benefit of the local community. I gave such a talk on October 7, 2014 on The Prospects that Emerging Science Offers Us for Long Healthy Lifespans. The talk was the first in a 2014 seasonal series of lectures, “The Great Presenter Series” sponsored by the Wayland Public Library.

The PowerPoint presentation for that talk can be downloaded by clicking on the links that follow.  I had to divide the presentation into two parts so it could be handled by the blog software. You can download both parts and view them with your own versions of Microsoft PowerPoint or Open Office

Longhealhylife10-2-14PT1  Overview on the sciences of aging

Longhealhylife10-2-14PT2 Actions and interventions for extending healthspan and lifespans  – Focus on the personal and practical

Because most members of the Wayland library audience could not be presumed to have a biology science background, I strove to keep the presentation relatively non-technical and general.  The talk was well-attended and well-received, and followed by a long and lively discussion period.  Regular readers of this blog might find the presentation useful for kicking off discussions with their own non-scientist friends about some of the key facts relating to the longevity sciences and easy-to-apply interventions that offer the possibility of longer than average lifespans for those that pursue them.

Vince


NAD+ an emerging framework for life extension — Part 1: The NAD World

By Vince Giuliano with inputs from by James P. Watson

Accelerated by the publication in December 2013 of a seminal paper by David Sinclair and his US and Australian colleagues(ref), there has been increasing interest and excitement about the prospects of discovering means for offsetting age–related declines in NAD+ as a strategy for disease prevention and life extension.  Actually, similar proposals have appeared in the literature for several years.  However, for lay people and even many scientists, the scientific discussions of NAD+ are so complicated that they seem to be virtually unfathomable.  In fact, understanding NAD+ and its roles requires fathoming a large number of related actors and their roles – complex metabolic pathways, an alphabet soup collection of enzymes and gene activation cofactors, the family of Sirtuins, biological processes in different cell compartments and organs, and multiple pathological and health-producing concomitants.  The complex of related actors has come to be called the NAD World.   It is not surprising that many intelligent  people are left confused about it.

We have already referred to NAD+ and its health concomitants several times in this blog.  In fact, Jim Watson characterized it as the most important scientific topic he encountered in 2013 and you might want to start out by reviewing  what he said about it in this blog entry.   The purpose of this current Part 1 blog entry is to provide an overview treatment of the NAD World and its nuances: to identify the major molecular entities involved, their roles, health and longevity ramifications, the reasons for the current excitement, and to begin to clarify what is actually known and what the remaining uncertainties are.  We also discuss a few important facets of the general topic which are ignored in many of the current publications, such as the high degree of circadian regulation of NAD+ .and about  proteins that regulate NAD+ and its cousins such as CD38 and CCR2.  There will be at least one more additional Parts in this series.  They will go into additional detail about how common disease processes relate to disfunctionalities in the NAD World, and will examine a number of strategies currently being researched or proposed for maintaining high constituent levels of NAD+.  They will also discuss the importance of developing a set of easily-detectible biomarkers to enable comparative evaluation of these strategies.  My perception is that a big new area of longevity science is opening up, one that will offer new practical interventions that could well lead to longer healthier lives.

INTRODUCTIONS TO THE MAIN ACTORS AND THEIR RELATIONSHIPS — INTRODUCTION THE NAD WORLD

It was suggested back in 2009 that NAD and the molecules and pathways it dances with constitute a world for explaining metabolism and aging.

The 2009 publication The NAD world: A new systemic regulatory network for metabolism and aaging-Sirt1, systemic NAD biosynthesis, and their importance related: “For the past several years, it has been demonstrated that the NAD-dependent protein deacetylase Sirt1 and nicotinamide phosphoribosyltransferase (Nampt)-mediated systemic NAD biosynthesis together play a critical role in the regulation of metabolism and possibly aging in mammals. Based on our recent studies on these two critical components, we have developed a hypothesis of a novel systemic regulatory network, named “NAD World”, for mammalian aging. Conceptually, in the NAD World, systemic NAD biosynthesis mediated by intra- and extracellular NAMPT functions as a driver that keeps up the pace of metabolism in multiple tissues/organs, and the NAD-dependent deacetylase Sirt1 serves as a universal mediator that executes metabolic effects in a tissue-dependent manner in response to changes in systemic NAD biosynthesis. This new concept of the NAD World provides important insights into a systemic regulatory mechanism that fundamentally connects metabolism and aging and also conveys the ideas of functional hierarchy and frailty for the regulation of metabolic robustness and aging in mammals.”

Here is a handy reference guide to some of the main molecular actors that will be showing up in the following discussions and their significance – a cast of main characters in the NAD World but by no means all of them.

NAD - Nicotinamide adenine dinucleotide (NAD) is a coenzyme found in all living cells. The compound is a dinucleotide, since it consists of two nucleotides joined through their phosphate groups. One nucleotide contains an adenine base and the other nicotinamide. Nicotinamide adenine dinucleotide exists in two forms, an oxidized and reduced form abbreviated as NAD+ and NADH respectively.(ref)  As we will see, it is a molecule of central importance to metabolic and other key biological processes in humans.

Image may be NSFW.
Clik here to view.
blogp1

NAD+ - oxidized form of NAD, very important as a cofactor for health and longevity-related processes including DNA repair and mitochondrial operability as will be discussed.  The central actor in our current drama, it acts as a biological oxidizing agent.  Declines sharply with age negatively impacting on DNA repair and mitochondrial health and benefits conveyed by sirtuins.


NADHreduced form of NAD. Acts as a biological reducing agent.  Cycled back in the body to NAD+ by what are known as the NAD salvage pathways described below.

NA  – Nicotinic acid (aka Niacin aka Vitamin B3) – Niacin –” is an organic compound with the formula C6H5NO2 and, depending on the definition used, one of the 20 to 80essential human nutrients.(ref)”  Important in the current drama as a precursor to Nicotinamide which is a precursor to NAD. Unfortunately, consuming niacin is generally not a good way to enhance body levels of NAD since its metabolite niacinamide inhibits the sirtuins.

 NAM – Nicotinamide (also known as niacinamide and nicotinic amide), “is the amide of nicotinic acid (vitamin B3 / niacin). Nicotinamide is a water-soluble vitamin and is part of the vitamin B group. Nicotinic acid, also known as niacin, is converted to nicotinamide in vivo.”(ref).  It is a precursor of NAD but there is a catch to simply supplementing with it.  It inhibits the sirtuins and their health-producing properties.

NR – Nicotinamide riboside – a precursor of NAD, and is a source of Vitamin B3.   Available as a commercial dietary supplement thought to promote NAD+.  One of the possible approaches to enhancing body levels of NAD+(ref)

 NAD Salvage Pathways -  “Besides assembling NAD+ de novo from simple amino acid precursors, cells also salvage preformed compounds containing nicotinamide. Although other precursors are known, the three natural compounds containing the nicotinamide ring and used in these salvage metabolic pathways are nicotinic acid (Na), nicotinamide (Nam) and nicotinamide riboside (NR).[2] These compounds can be taken up from the diet, where the mixture of nicotinic acid and nicotinamide are called vitamin B3 or niacin. However, these compounds are also produced within cells, when the nicotinamide moiety is released from NAD+ in ADP-ribose transfer reactions. Indeed, the enzymes involved in these salvage pathways appear to be concentrated in the cell nucleus, which may compensate for the high level of reactions that consume NAD+ in this organelle.[26]  Cells can also take up extracellular NAD+ from their surroundings[27](ref).”


Image may be NSFW.
Clik here to view.
blogp2

Image and legend source is the 2002 publication Manipulation of a Nuclear NAD+ Salvage Pathway Delays Aging without Altering Steady-state NAD+ Levels:   ” Model for life span extension via increased flux through the NAD+ salvage pathway. – Type III histone deacetylases such as Sir2 and Hst1–4 catalyze a key step in the salvage pathway by converting NAD+ to nicotinamide. Additional copies of PNC1, NPT1, NMA1, and NMA2 increase flux through the NAD+salvage pathway, which stimulates Sir2 activity and increases life span. Additional copies of QNS1 fail to increase silencing. Unlike other steps in the pathway, its substrate cannot be supplied from a source outside the salvage pathway and is therefore limiting for the reaction. Abbreviations: NAD +, nicotinamide adenine dinucleotide; NaMN, nicotinic acid mononucleotide; NaAD, desamido-NAD+(ref).”  A number of important matters are not shown in this simplified diagram, such as ATP (required as an energy source in the lower loop to make NAD), the key roles of SIRT1, and CD38 which eats up NAD+.

NADPH – is the reduced form of NADP+. “NADPH provides the reducing equivalents for biosynthetic reactions and the oxidation-reduction involved in protecting against the toxicity of ROS (reactive oxygen species), allowing the regeneration of GSH (reduced glutathione).[3] NADPH is also used for anabolic pathways, such as lipid synthesis, cholesterol synthesis, and fatty acid chain elongation. — The NADPH system is also responsible for generating free radicals in immune cells. These radicals are used to destroy pathogens in a process termed the respiratory burst.[4] It is the source of reducing equivalents for cytochrome P450 hydroxylation of aromatic compoundssteroidsalcohols, and drugs(ref).”

NAADP – Nicotinic acid adenine dinucleotide phosphate “(NAADP) is one of the most potent stimulators of intracellular Ca2+ release known to date. The role of the NAADP system in physiological processes is being extensively investigated at the present time. Exciting new discoveries in the last 5 years suggest that the NAADP-regulated system may have a significant role in intracellular Ca2+ signaling. The NAADP receptor and its associated Ca2+ pool have been hypothesized to be important in several physiological processes including fertilization, T cell activation, and pancreatic secretion(ref).”

 NADPH oxidase – “Nicotinamide adenine dinucleotide phosphate-oxidase is a membrane-bound enzyme complex. It can be found in the plasma membrane as well as in the membranes of phagosomes used by neutrophil white blood cells to engulf microorganisms. — NADPH oxidase generates superoxide by transferring electrons from NADPH inside the cell across the membrane and coupling these to molecular oxygen to produce superoxide anion, a reactive free-radical. Superoxide can be produced in phagosomes, which contain ingested bacteria and fungi, or it can be produced outside of the cell. In a phagosome, superoxide can spontaneously form hydrogen peroxide that will undergo further reactions to generate reactive oxygen species (ROS)(ref).”  Plays important roles in generating ROS to deal with pathogens.

 NAMPT – “Nicotinamide phosphoribosyltransferase (NAmPRTase or NAMPT) also known as pre-B-cell colony-enhancing factor 1 (PBEF1) or visfatin is an enzyme that in humans is encoded by the PBEF1 gene.[1] This protein has also been reported to be a cytokine (PBEF) that promotes B cell maturation and inhibits neutrophil apoptosis. — This enzyme participates in nicotinate and nicotinamide metabolism.(ref)”  NAMPT is the rate-limiting enzyme of the NAD(+) salvage pathway and enhances SIRT1 activity by increasing the amount of NAD+.

NMNAT – Nicotinamide/nicotinic acid mononucleotide adenylyltransferase  An enzyme that plays a role in NAD synthesis. “–  a rate-limiting enzyme present in all organisms, reversibly catalyzes the important step in the biosynthesis of NAD from ATP and NMN. NAD and NADP are used reversibly in anabolic and catabolic reactions(ref).”

SIRTUINS (Silent Information Regulators  SIRT1 – SIRT7)  Sirtuins extend the lifespans of lower ife forms including yeast, nematodes and drosphila, and appear to have pluripotent health effects in humans.  “Sirtuin or Sir2 proteins are a class of proteins that possess either mono-ADP-ribosyltransferase, or deacylase activity, including deacetylase, desuccinylase, demalonylase, demyristoylase and depalmitoylase activity.[2][3][4][5] Sirtuins regulate important biological pathways in bacteriaarchaea and eukaryotes. The name Sir2 comes from the yeast gene ‘silent mating-type information regulation 2′,[6] the gene responsible for cellular regulation in yeast. Sirtuins have been implicated in influencing a wide range of cellular processes like agingtranscriptionapoptosis, inflammation[7] and stress resistance, as well as energy efficiency and alertness during low-calorie situations.[8] Sirtuins can also control circadian clocks and mitochondrial biogenesis(ref).”  Sirtuins convert NAD(+) into nicotinamide (NAM).  The sirtuins vary in their functions and in general serve as deacetylases. We have written about them a number of times in this blog(ref), and we will comment further here on some of their specific functions.  SIRT1, in particular, the mammalian counterpart of SIR2, both depends on the presence of NAD+ for its activation and has important regulatory functions in the NAD salvage pathway.  “SIRT1 is required to regulate adaptive responses to acute and chronic energy limitations, such as fasting and dietary restriction.  In general, the evolutionary role of SIR2 ones is thought to be that they provide mechanisms through which an organism can adopt to changes in environment and diet. An example of the possible role of SIRT6 could be to allow animals to switch between vegetarian and meat diets. Sirtuins are completely dependent on the availability of NAD+ for their formation and thus are central actor’s in the NAD World. An important negative consequence of insufficient levels of NAD+ is insufficient levels of sirtuins and compromise of their important biological activities.”  A table showing the deacetylase and deacelase activities of the seven sirtuin sisters can be found on this site.

CCAR2 (Cell Cycle And Apoptosis Regulator 2, also known as DBC1) An important negative regulator of SIRT1 (ref) and a consumer of NAD+.

CD38  – CD38 (cluster of differentiation 38), also known as cyclic ADP ribose hydrolase is a glycoprotein[1] found on the surface of many immune cells (white blood cells), including CD4+CD8+B lymphocytes and natural killer cells. — CD38 is a multifunctional ectoenzyme that catalyzes the synthesis and hydrolysis of cyclic ADP-ribose (cADPR) from NAD+ to ADP-ribose. These reaction products are essential for the regulation of intracellular Ca2+[5] (ref).”  CD38 can be a major consumer of NAD as a substrate.

MNA – Methylnicotinamide -  ” Methylnicotinamide is a metabolite of nicotinamide and is produced primarily in the liver. It has anti-inflammatory properties (PMID 16197374 ). It is a product of nicotinamide N-methyltransferase [EC 2.1.1.1] in the pathway of nicotinate and nicotinamide metabolism (KEGG). 1-Methylnicotinamide may be an endogenous activator of prostacyclin production and thus may regulate thrombotic as well as inflammatory processes in the cardiovascular system(ref).”

PARP – “Poly (ADP-ribose) polymerase (PARP) is a family of proteins involved in a number of cellular processes involving mainly DNA repair and programmed cell death. — The PARP family comprises 17 members (10 putative). They have all very different structures and functions in the cell.– PARP is found in the cell’s nucleus. The main role is to detect and signal single-strand DNA breaks (SSB) to the enzymatic machinery involved in the SSB repair. PARP activation is an immediate cellular response to metabolic, chemical, or radiation-induced DNA SSB damage. Once PARP detects a SSB, it binds to the DNA, and, after a structural change, begins the synthesis of a poly (ADP-ribose) chain (PAR) as a signal for the other DNA-repairing enzymes such as DNA ligase III (LigIII), DNA polymerase beta (polβ), and scaffolding proteins such as X-ray cross-complementing gene 1 (XRCC1). After repairing, the PAR chains are degraded via Poly(ADP-ribose) glycohydrolase(PARG).[1]  — It is interesting to note that NAD+ is required as substrate for generating ADP-ribose monomers. The overactivation of PARP may deplete the stores of cellular NAD+ and induce a progressive ATP depletion and necrotic cell death, since glucose oxidation is inhibited. In this regard, PARP is inactivated by caspase-3 cleavage (in a specific domain of the enzyme) during programmed cell death. — PARP enzymes are essential in a number of cellular functions,[2] including expression of inflammatory genes:[3] PARP1 is required for the induction of ICAM-1 gene expression by smooth muscle cells, in response to TNF[4] (ref).”

ATP – ” Adenosine triphosphate (ATP) is a nucleoside triphosphate used in cells as a coenzyme, often called the “molecular unit of currency” of intracellular energy transfer.[1]  — ATP transports chemical energy within cells for metabolism(ref).”

ADPAdenosine diphosphate, abbreviated ADP, is an important organic compound in metabolism and is essential to the flow of energy in living cells. — The cleavage of a phosphate group from ATP results in the coupling of energy to metabolic reactions and a by-product, a molecule of ADP.[1] Being the “molecular unit of currency”, ATP is continually being formed from lower-energy molecules of ADP and AMP(ref).”.

AMPAdenosine monophosphate,  NAD can be synthesized from it(ref),

“AMP, ADP, ATP – ATP consists of three phosphate groups attached in series to the 5’ carbon location, whereas ADP contains two phosphate groups attached to the 5’ position, and AMP contains only one phosphate group attached at the 5’ position. Energy transfer used by all living things is a result of dephosphorylation of ATP by enzymes known as ATPases. The cleavage of a phosphate group from ATP results in the coupling of energy to metabolic reactions and a by-product, a molecule of ADP.[1] Being the “molecular unit of currency”, ATP is continually being formed from lower-energy molecules of ADP and AMP. The biosynthesis of ATP is achieved throughout processes such as substrate-level phosphorylationoxidative phosphorylation, and photophosphorylation, all of which facilitating the addition of a phosphate group to an ADP molecule.”(ref)

AMPK - ” AMP-activated protein kinase (AMPK) plays a key role as a master regulator of cellular energy homeostasis. The kinase is activated in response to stresses tha`t deplete cellular ATP supplies such as low glucose, hypoxia, ischemia, and heat shock(ref).”

cAMP - “AMP can also exist as a cyclic structure known as cyclic AMP (or cAMP). Within certain cells the enzyme adenylate cyclase makes cAMP from ATP, and typically this reaction is regulated by hormones such as adrenaline or glucagon. cAMP plays an important role in intracellular signaling. (ref)

CREB – cAMP response element-binding protein[1] – is a cellular transcription factor. It binds to certain DNA sequences calledcAMP response elements (CRE), thereby increasing or decreasing the transcription of the downstream genes.[2] CREB was first described in 1987 as a cAMP-responsive transcription factor regulating the somatostatin gene[3] (ref)”

 PGC1 alpha  – “PGC-1-alpha (Peroxisome proliferator-activated receptor gamma coactivator 1-alpha)  “is a protein that in humans is encoded by thePPARGC1A gene.[1] The protein encoded by this gene is a transcriptional coactivator that regulates the genes involved in energy metabolism. This protein interacts with the nuclear receptor PPAR-gamma, which permits the interaction of this protein with multiple transcription factors. This protein can interact with, and regulate the activities of, cAMP response element binding protein (CREB) and nuclear respiratory factors (NRFs). It provides a direct link between external physiological stimuli and the regulation of mitochondrial biogenesis, and is a major factor that regulates muscle fiber type determination. This protein may be also involved in controlling blood pressure, regulating cellular cholesterol homoeostasis, and the development of obesity[2] (ref).  ”We have discussed PGC-1-alpha several times in this blog (ref).

TOP LEVEL POINTS

 My approach in this blog entry will be top-down, starting with general points that establish the importance of the topic to health and longevity – and finishing with some of the more-technical detail that conveys so much richness to the topic. Here is a list of top-level points that will be detailed in the following citations:

  1.  NAD levels decline precipitously with aging in mammals and humans, and are strongly negatively affected by multiple disease and stress processes including obesity. At advanced ages these levels are a tiny fraction of what they are in young people.
  2.  Maintaining a high level of constitutive NAD+ in the body is critical for maintaining health and functionality, for averting or reversing a number of deleterious disease phenomena, for energy and vitality, and possibly for extending life spans in humans.
  3.  NAD+ is a key substrate for the production on SIRT1 and other sirtuins needed for proper histone deacetylation and gene regulation in response to changing conditions. Its availability is also critical for preventing a state of pseudohypoxia in cell nuclii and proper generation of mitochondrial proteins required for efficient electron transfer chain operation.
  4.  Inadequate levels of NAD can negatively impact on DNA repair, runaway inflammation, normal metabolism, responses to oxidative stress, mitochondrial health and electron transfer chain efficiency in mitichondria, and lead to the Warburg Effect of pathological metabolism.
  5.  NAD+ is needed for responsiveness to oxidative stresses and for control of inflammatory processes
  6.  NAD+ deficiency thus impairs a. Proper DNA damage repair, b. Production of sirtuins and processes that depend on sirtuins for homeostasis and health, c. Control of gene activation, d. Mitochondrial functionality and viability, e. Capacity to deal with injuries and pathological situations, and f. ability to control excess inflammation.
  7.  The rate of DNA damage increases significantly with aging, increasing demand for NAD+ for DNA repair. However in general, the reasons for age-related decline in NAD are not well understood.
  8.  As a consequence of the above, inadequate levels of NAD can lead to a laundry list of disease processes, including type 2 diabetes, Alzheimer’s disease, and cancer. And to acceleration of aging.  Indeed, I venture an opinion that there is an unvirtuous cyclic process of interaction of the NAD-related feedback loops that manifests itself in the progressive acceleration of the processes of aging with aging itself – why we generally age faster and faster as we get older.
  9.  There is a great deal of research knowledge about what generates NAD, what runs it down, its relationship to metabolism and other metabolic factors, the biological processes affecting it or affected by it, and how it’s expression relates to multiple disease processes.
  10. It has long been known that many deleterious disease phenomena can be prevented or reversed by promoting higher levels of NAD in animal models. There appears to be ample evidence that this approach is generally safe. 
  11.  For a number of years it has been proposed in research publications that promoting NAD levels in humans could be an effective preventative and/or therapeutic strategy.for multiple disease processes  Also, it is a provem strategy for extending the ifespans of c-elegans worms. However, this strategy has never entered our mainline medical or health maintenance system.
  12.  Multiple strategies have been investigated for enhancing human levels of NAD, including enhancing its original synthesis in the body, downregulating biological processes that consume it, ingesting precursor molecules such as NMN or NR, and direct introduction of NAD into the bloodstream via IV.  At present, we do not know which of these approaches will be most efficacious and cost-effective. 

I will amplify on these points by citing selections from a great many relevant publications that describe aspects of the NAD World.  After this, I go on to second-level of selected key points that relate to the biological mechanisms involved – for example, the key systematic roles that NAD plays in regulating metabolism and aging,  and how NAD is consumed as an important substrate for DNA repair processes. Topics 11 and 12 above will mainly be discussed in further blog entries in this series.

RESEARCH RESULTS

 The 2013 publication The NAD+/sirtuin pathway modulates longevity through activation of mitochondrial UPR and FOXO signaling reports: “NAD+ is an important co-factor regulating metabolic homeostasis and a rate-limiting substrate for sirtuin deacylase. We show that NAD+ levels are reduced in aged mice and C. elegans and that decreasing NAD+ levels results in a further reduction in worm lifespan. Conversely, genetic or pharmacological restoration of NAD+ prevents age-associated metabolic decline and promotes longevity in worms. These effects are dependent upon the protein deacetylase sir-2.1 and involve the induction of mitonuclear protein imbalance as well as activation of stress signaling via the mitochondrial unfolded protein response (UPRmt) and the nuclear translocation and activation of FOXO transcription factor DAF-16. Our data suggest that augmenting mitochondrial stress signaling through the modulation of NAD+ levels may be a target to improve mitochondrial function and prevent or treat age-associated decline. — Alterations in NAD+ levels have a powerful metabolic impact, since it serves as an obligatory substrate for the deacetylase activity of the sirtuin proteins (Guarente, 2008; Haigis and Sinclair, 2010; Houtkooper et al., 2010a). The best-characterized mammalian sirtuin is SIRT1, which controls mitochondrial function through the deacetylation of targets that include PGC-1α and FOXO (Chalkiadaki and Guarente, 2012; Houtkooper et al., 2012). The administration of NAD+ precursors, such as nicotinamide mononucleotide (Yoshino et al., 2011) or nicotinamide riboside (NR) (Canto et al., 2012), has proven to be an efficient way to increase NAD+ levels and SIRT1 activity, improving metabolic homeostasis in mice. Furthermore, the NAD+-consuming poly(ADP-ribose) polymerase proteins—with PARP1 and PARP2 representing the main PARP activities in mammals—were classically described as DNA repair proteins (Gibson and Kraus, 2012; Schreiber et al., 2006), but recent studies have linked these proteins to metabolism (Asher et al., 2010; Bai et al., 2011a; Bai et al., 2011b; Erener et al., 2012). Indeed, genetic or pharmacological inactivation of PARP1 increased tissue NAD+ levels and activated mitochondrial metabolism (Bai et al., 2011b). An association between PARPs and lifespan has been postulated (Grube and Burkle, 1992; Mangerich et al., 2010), but a causal role remained unclear. A final line of evidence in support of a role for NAD+ in metabolic control came from the deletion of an alternative NAD+-consuming protein, CD38, which also led to NAD+ accumulation and subsequent SIRT1 activation in mice, and proved protective against high-fat diet-induced obesity (Barbosa et al., 2007). — Considering the intimate link between metabolism and longevity (Guarente, 2008; Houtkooper et al., 2010b), we hypothesized that increasing NAD+ levels may be sufficient to increase mitochondrial activity and extend lifespan (Houtkooper and Auwerx, 2012). Here we show how supplementation of PARP inhibitors or NAD+ precursors led to improved mitochondrial homeostasis through the activation of the worm sirtuin homolog, sir-2.1. ” 

 Because the NAD World pathways are evolutionarily conserved in mammals and humans, there is reason to believe these results apply to us humans as well.

The 2013 publication The importance of NAMPT/NAD/SIRT1 in the systemic regulation of metabolism and ageing reports: “Ageing is associated with a variety of pathophysiological changes, including development of insulin resistance, progressive decline in β-cell function and chronic inflammation, all of which affect metabolic homeostasis in response to nutritional and environmental stimuli. SIRT1, the mammalian nicotinamide adenine dinucleotide (NAD)-dependent protein deacetylase, and nicotinamide phosphoribosyltransferase (NAMPT), the rate-limiting NAD biosynthetic enzyme, together comprise a novel systemic regulatory network, named the ‘NAD World’, that orchestrates physiological responses to internal and external perturbations and maintains the robustness of the physiological system in mammals. In the past decade, an accumulating body of evidence has demonstrated that SIRT1 and NAMPT, two essential components in the NAD World, play a critical role in regulating insulin sensitivity and insulin secretion throughout the body. In this article, we will summarize the physiological significance of SIRT1 and NAMPT-mediated NAD biosynthesis in metabolic regulation and discuss the ideas of functional hierarchy and frailty in determining the robustness of the system. We will also discuss the potential of key NAD intermediates as effective nutriceuticals for the prevention and the treatment of age-associated metabolic complications, such as type 2 diabetes.”

As mentioned above, sirtuins depend on the availability of NAD+ as a substrate and some of the negative consequences of insufficient NAD+ are associated with surtuin insufficiency.  Likewise, there is evidence that high expression of sirtuins associated with high levels of NAD+, SIRT1 and the others as well, convey a variety of longevity benefits.

One way this shows up is slowing or averting stem cell senescence.  The 2014 publication SIRT1 ameliorates age-related senescence of mesenchymal stem cells via modulating telomere shelterin reports: “Mesenchymal stem cells (MSCs) senescence is an age-related process that impairs the capacity for tissue repair and compromises the clinical use of autologous MSCs for tissue regeneration. Here, we describe the effects of SIRT1, a NAD(+)-dependent deacetylase, on age-related MSCs senescence. Knockdown of SIRT1 in young MSCs induced cellular senescence and inhibited cell proliferation whereas overexpression of SIRT1 in aged MSCs reversed the senescence phenotype and stimulated cell proliferation. These results suggest that SIRT1 plays a key role in modulating age-induced MSCs senescence. Aging-related proteins, P16 and P21 may be downstream effectors of the SIRT1-mediated anti-aging effects. SIRT1 protected MSCs from age-related DNA damage, induced telomerase reverse transcriptase (TERT) expression and enhanced telomerase activity but did not affect telomere length. SIRT1 positively regulated the expression of tripeptidyl peptidase 1 (TPP1), a component of the shelterin pathway that protects chromosome ends from DNA damage. Together, the results demonstrate that SIRT1 quenches age-related MSCs senescence by mechanisms that include enhanced TPP1 expression, increased telomerase activity and reduced DNA damage.”

The 2011 publication Dissecting systemic control of metabolism and aging in the NAD World relates “Accumulating bodies of evidence have suggested that SIRT1 plays an important role in retarding age-associated pathophysiological changes and preventing from diseases of aging, such as type 2 diabetes, Alzheimer’s disease, and cancer. Whole-body SIRT1-overexpressing transgenic mice show significant protection from the adverse effects of high-fat diet or aging on glucose metabolism [9] and [10]. SIRT1-activating compounds are also able to improve glucose homeostasis and insulin sensitivity in diet-induced and genetic type 2 diabetes animal models [9] and [10]. ”

From the same publication:  “It has recently been demonstrated that SIRT1 prevents two critical pathological aspects of Alzheimer’s disease: Aβ amyloid deposition and tauopathy. SIRT1 decreases the production of Aβ amyloid by deacetylating the retinoic acid receptor β and thereby up-regulating ADAM10, a major component of α-secretase [19]. SIRT1 also promotes degradation of phosphorylated tau by deacetylating it and prevents tau-mediated neurodegeneration [20]. Furthermore, SIRT1 regulates memory and synaptic plasticity, providing insight into potential intervention against age-associated cognitive disorders [21] and [22]. It has also been reported that SIRT1 transgenic mice show a lower incidence of spontaneous carcinomas and sarcomas and a reduced susceptibility to high-fat diet/carcinogen-induced liver tumors, compared to wild-type control mice [23]. These findings provide strong support for the importance of SIRT1 in the prevention of major age-associated diseases.”

The 2011 publication  NAD+ treatment decreases tumor cell survival by inducing oxidative stress reports: “NAD+ plays important roles in various biological processes. It has been shown that NAD+ treatment can decrease genotoxic agent-induced death of primary neuronal and astrocyte cultures, and NAD+ administration can reduce ischemic brain damage. However, the effects of NAD+ treatment on tumor cell survival are unknown. In this study we found that treatment of NAD+ at concentrations from 10 micromolar to 1 mM can significantly decrease the survival of various types of tumor cells such as C6 glioma cells. In contrast, NAD+ treatment did not impair the survival of primary astrocyte cultures. Our study has also indicated that oxidative stress mediates the effects of NAD+ on the survival of tumor cells, and P2X7 receptors and altered calcium homeostasis are involved in the effects of NAD+ on the cell survival. Collectively, our study has provided the first evidence that NAD+ treatment can decrease the survival of tumor cells by such mechanisms as inducing oxidative stress. Because NAD+ treatment can selectively decrease the survival of tumor cells, NAD+ may become a novel agent for treating cancer.”

The 2012 publication Age-associated changes in oxidative stress and NAD+ metabolism in human tissue reports: “Nicotinamide adenine dinucleotide (NAD(+)) is an essential electron transporter in mitochondrial respiration and oxidative phosphorylation. In genomic DNA, NAD(+) also represents the sole substrate for the nuclear repair enzyme, poly(ADP-ribose) polymerase (PARP) and the sirtuin family of NAD-dependent histone deacetylases. Age associated increases in oxidative nuclear damage have been associated with PARP-mediated NAD(+) depletion and loss of SIRT1 activity in rodents. In this study, we further investigated whether these same associations were present in aging human tissue. Human pelvic skin samples were obtained from consenting patients aged between 15-77 and newborn babies (0-1 year old) (n = 49) previously scheduled for an unrelated surgical procedure. DNA damage correlated strongly with age in both males (p = 0.029; r = 0.490) and females (p = 0.003; r = 0.600) whereas lipid oxidation (MDA) levels increased with age in males (p = 0.004; r = 0.623) but not females (p = 0.3734; r = 0.200). PARP activity significantly increased with age in males (p<0.0001; r = 0.768) and inversely correlated with tissue NAD(+) levels (p = 0.0003; r = -0.639). These associations were less evident in females. A strong negative correlation was observed between NAD(+) levels and age in both males (p = 0.001; r = -0.706) and females (p = 0.01; r = -0.537). SIRT1 activity also negatively correlated with age in males (p = 0.007; r = -0.612) but not in females. Strong positive correlations were also observed between lipid peroxidation and DNA damage (p<0.0001; r = 0.4962), and PARP activity and NAD(+) levels (p = 0.0213; r = 0.5241) in post pubescent males. This study provides quantitative evidence in support of the hypothesis that hyperactivation of PARP due to an accumulation of oxidative damage to DNA during aging may be responsible for increased NAD(+) catabolism in human tissue. The resulting NAD(+) depletion may play a major role in the aging process, by limiting energy production, DNA repair and genomic signalling.”

What eats up and depletes NAD?

 In the normal operation of the NAD salvage cycle, NAD is conserved, shuttled back and forth between its two forms NAD+ and NADH.  In this process, NAD acts as a cofactor in a major metabolic cycle.  In other vital processes, however, NAD acts as a substrate and is consumed. It is quite possibly the case that age-related decline in levels of NAD are mainly associated with increased demand by those substrate processes with aging. Here I discuss consumption of NAD by 1. PARPS, 2. Production of sirtuins, and 3. CD38  I also mention 4. CCAR2, a negative regulator of SIRT1 which can nullify health benefits of the availability of NAD+.

1.  PARPS are major consumers of NAD+, using it for DNA repair.

 Probably they are the largest consumer of NAD+, especially in older people where the need for DNA repair accelerates with age.  As a matter of fact, one strategy for increasing levels of NAD in mice is to inhibit PARPs,  Although this strategy seems to increase lifespans of mice by making more NAD available to mitochondria, I suspect it is a shortsighted approach when it comes to human health and longevity,  ” Nuclear poly(ADP ribose) polymerase 1 (1) generates polyADP ribose and probably accounts for the majority of nuclear NAD+ degradation. Direct interaction with NMNAT1 facilitates NAD+ supply to activated PARP1.(ref)”

The 2011 publication PARP-1 inhibition increases mitochondrial metabolism through SIRT1 activation reports: “SIRT1 regulates energy homeostasis by controlling the acetylation status and activity of a number of enzymes and transcriptional regulators. The fact that NAD(+) levels control SIRT1 activity confers a hypothetical basis for the design of new strategies to activate SIRT1 by increasing NAD(+) availability. Here we show that the deletion of the poly(ADP-ribose) polymerase-1 (PARP-1) gene, encoding a major NAD(+)-consuming enzyme, increases NAD(+) content and SIRT1 activity in brown adipose tissue and muscle. PARP-1(-/-) mice phenocopied many aspects of SIRT1 activation, such as a higher mitochondrial content, increased energy expenditure, and protection against metabolic disease. Also, the pharmacologic inhibition of PARP in vitro and in vivo increased NAD(+) content and SIRT1 activity and enhanced oxidative metabolism. These data show how PARP-1 inhibition has strong metabolic implications through the modulation of SIRT1 activity, a property that could be useful in the management not only of metabolic diseases, but also of cancer.”

2.  Sirtuins also draw down on NAD+ as a substrate, although the exact mechanisms of sirtuin activation are not clear to me.

 From the 2011 publication Mammalian Sirtuins and Energy Metabolism “Despite diverse subcellular localizations and a broad range of substrate specificities, the activity of all sirtuins is directly controlled by cellular NAD+ levels, which is an indicator of cellular metabolic status. The activity of these enzymes is also inhibited by their common enzymatic product, nicotinamide (19), and possibly by NADH (20). It is therefore not surprising that the activity of sirtuins changes in response to environmental cues that impact cellular metabolic state.”

The 2011 publication Age related changes in NAD+ metabolism oxidative stress and Sirt1 activity in wistar rats reports: “The cofactor nicotinamide adenine dinucleotide (NAD+) has emerged as a key regulator of metabolism, stress resistance and longevity. Apart from its role as an important redox carrier, NAD+ also serves as the sole substrate for NAD-dependent enzymes, including poly(ADP-ribose) polymerase (PARP), an important DNA nick sensor, and NAD-dependent histone deacetylases, Sirtuins which play an important role in a wide variety of processes, including senescence, apoptosis, differentiation, and aging. We examined the effect of aging on intracellular NAD+ metabolism in the whole heart, lung, liver and kidney of female wistar rats.  Our results are the first to show a significant decline in intracellular NAD+ levels and NAD:NADH ratio in all organs by middle age (i.e.12 months) compared to young (i.e. 3 month old) rats. These changes in [NAD(H)] occurred in parallel with an increase in lipid peroxidation and protein carbonyls (o- and m- tyrosine) formation and decline in total antioxidant capacity in these organs.  An age dependent increase in DNA damage (phosphorylated H2AX) was also observed in these same organs. Decreased Sirt1 activity and increased acetylated p53 were observed in organ tissues in parallel with the drop in NAD+ and moderate over-expression of Sirt1 protein.  Reduced mitochondrial activity of complex I-IV was also observed in aging animals, impacting both redox status and ATP production.  The strong positive correlation observed between DNA damage associated NAD+ depletion and Sirt1 activity suggests that adequate NAD+ concentrations may be an important longevity assurance factor.

 The 2012 publication The NAD+-dependent protein deacetylase activity of SIRT1 is regulated by its oligomeric status reports “SIRT1, a NAD+-dependent protein deacetylase, is an important regulator in cellular stress response and energy metabolism. While the list of SIRT1 substrates is growing, how the activity of SIRT1 is regulated remains unclear. We have previously reported that SIRT1 is activated by phosphorylation at a conserved Thr522 residue in response to environmental stress. Here we demonstrate that phosphorylation of Thr522 activates SIRT1 through modulation of its oligomeric status. We provide evidence that nonphosphorylated SIRT1 protein is aggregation-prone in vitro and in cultured cells. Conversely, phosphorylated SIRT1 protein is largely in the monomeric state and more active. Our findings reveal a novel mechanism for environmental regulation of SIRT1 activity, which may have important implications in understanding the molecular mechanism of stress response, cell survival, and aging.”

3.  CD38 is a key enzyme sitting on the outside of the cell surface that is a major consumer of NAD that plays an important role in cell calcium homeostasis

 From Mouse embryonic fibroblasts from CD38 knockout mice are resistant to oxidative stresses through inhibition of reactive oxygen species production and Ca(2+) overload: “CD38 is a multifunctional enzyme that has both ADP-ribosyl cyclase and cADPR hydrolase activities, being capable of cleaving NAD(+) to cyclic ADP ribose (cADPR) and hydrolyzing cADPR to ADPR. It has been reported that there is markedly a reduction of cADPR and elevation of NAD in many tissues from CD38 knockout (CD38(-/-)) mice. Cyclic ADPR is a potent second messenger for intracellular Ca(2+) mobilization, and NAD is a key cellular metabolite for cellular energetic and a crucial regulator for multiple signaling pathways in cells. We hypothesize that CD38 knockout may have a protective effect in oxidative stresses through elevating NAD and decreasing cADPR. In the present study, we observed that the mouse embryonic fibroblasts (MEFs) from CD38(-/-) mice were significantly resistant to oxidative stress such as H(2)O(2) injury and hypoxia/reoxygenation compared with wild type MEFs (WT MEFs). We further found that production of reactive oxygen species (ROS) and concentrations of intracellular Ca(2+) ([Ca(2+)](i)) in CD38(-/-) MEFs were markedly reduced compared with WT MEFs during hypoxia/reoxygenation. Coincidence with these results, a remarkably lower mRNA level of Nox1, one of the enzymes responsible for ROS generation, was observed in CD38(-/-) MEFs. Furthermore, we found that transcription of Nox1 mRNA in WT MEFs could be elevated by calcium ionophore ionomycin in a dose-dependent manner, indicating that the expression of Nox1 mRNA can be regulated by elevation of intracellular [Ca(2+)]. Therefore we concluded that CD38(-/-) MEFs are resistant to oxidative stresses through inhibiting intracellular Ca(2+) overload and ROS production which may be regulated by Ca(2+)-mediated inhibition of Nox1 expression. Our data should provide an insight for elucidating the roles of CD38 in oxidative stresses and a novel perspective of dealing with the ischemia/reperfusion-related diseases.”

Image may be NSFW.
Clik here to view.
blogp3


Image and legend source    “CD38, a transmembrane glycoprotein with ADP-ribosyl cyclase activity, catalyses the formation of Ca2+ signalling molecules and triggers proliferation and immune responses in lymphocytes —  These results indicate that CD38 has a key role in neuropeptide release, thereby critically regulating maternal and social behaviours, and may be an element in neurodevelopmental disorders.”

NAD+ can be pumped out of cells to make CD38

The 2011 publication Connexin-43 hemichannels mediate cyclic ADP-ribose generation and its Ca2+-mobilizing activity by NAD+/cyclic ADP-ribose transport reports:  “The ADP-ribosyl cyclase CD38 whose catalytic domain resides in outside of the cell surface produces the second messenger cyclic ADP-ribose (cADPR) from NAD(+). cADPR increases intracellular Ca(2+) through the intracellular ryanodine receptor/Ca(2+) release channel (RyR). It has been known that intracellular NAD(+) approaches ecto-CD38 via its export by connexin (Cx43) hemichannels, a component of gap junctions. —  Our data suggest that Cx43 has a dual function exporting NAD(+) and importing cADPR into the cell to activate intracellular calcium mobilization.”

CD38 and its NAD+ and SIRT1 reducing effects can be inhibited by the phytosubstances quercetin and apigenin

The 2013 pubication Flavonoid apigenin is an inhibitor of the NAD+ ase CD38: implications for cellular NAD+ metabolism, protein acetylation, and treatment of metabolic syndrome reports: “Metabolic syndrome is a growing health problem worldwide. It is therefore imperative to develop  new strategies to treat this pathology. In the past years, the manipulation of NAD(+) metabolism has emerged as a plausible strategy to ameliorate metabolic syndrome. In particular, an increase in cellular NAD(+) levels has beneficial effects, likely because of the activation of sirtuins. Previously, we reported that CD38 is the primary NAD(+)ase in mammals. Moreover, CD38 knockout mice have higher NAD(+) levels and are protected against obesity and metabolic syndrome. Here, we show that CD38 regulates global protein acetylation through changes in NAD(+) levels and sirtuin activity.  In addition, we characterize two CD38 inhibitors: quercetin and apigenin. We show that pharmacological inhibition of CD38 results in higher intracellular NAD(+) levels and that treatment of cell cultures with apigenin decreases global acetylation as well as the acetylation of p53 and RelA-p65. Finally, apigenin administration to obese mice increases NAD(+) levels, decreases global protein acetylation, and improves several aspects of glucose and lipid homeostasis. Our results show that CD38 is a novel pharmacological target to treat metabolic diseases via NAD(+)-dependent pathways.”

 4.  CCAR2  can be an important negative regulator of SIRT1

CCAR2 was until very recently called DBC1 after what was originally thought to be its main property (deleted in breast cabcer), so most of the research literature relating to it talks only about DBC1.

The 2012 publication Role of deleted in breast cancer 1 (DBC1) protein in SIRT1 deacetylase activation induced by protein kinase A and AMP-activated protein kinase  reports: “The NAD(+)-dependent deacetylase SIRT1 is a key regulator of several aspects of metabolism and aging. SIRT1 activation is beneficial for several human diseases, including metabolic syndrome, diabetes, obesity, liver steatosis, and Alzheimer disease. We have recently shown that the protein deleted in breast cancer 1 (DBC1) is a key regulator of SIRT1 activity in vivo. Furthermore, SIRT1 and DBC1 form a dynamic complex that is regulated by the energetic state of the organism. Understanding how the interaction between SIRT1 and DBC1 is regulated is therefore essential to design strategies aimed to activate SIRT1. Here, we investigated which pathways can lead to the dissociation of SIRT1 and DBC1 and consequently to SIRT1 activation. We observed that PKA activation leads to a fast and transient activation of SIRT1 that isDBC1-dependent. In fact, an increase in cAMP/PKA activity resulted in the dissociation of SIRT1 and DBC1 in an AMP-activated protein kinase (AMPK)-dependent manner. Pharmacological AMPK activation led to SIRT1 activation by a DBC1-dependent mechanism. Indeed, we found that AMPK activators promote SIRT1-DBC1 dissociation in cells, resulting in an increase in SIRT1 activity. In addition, we observed that the SIRT1 activation promoted by PKA and AMPK occurs without changes in the intracellular levels of NAD(+). We propose that PKA and AMPK can acutely activate SIRT1 by inducing dissociation of SIRT1 from its endogenous inhibitor DBC1. Our experiments provide new insight on the in vivo mechanism of SIRT1 regulation and a new avenue for the development of pharmacological SIRT1 activators targeted at the dissociation of the SIRT1-DBC1 complex.”

The 2008 publication DBC1 is a negative regulator of SIRT1  reports: “The NAD-dependent protein deacetylase Sir2 (silent information regulator 2) regulates lifespan in several organisms1, 2, 3. SIRT1, the mammalian orthologue of yeast Sir2, participates in various cellular functions4, 5, 6, 7 and possibly tumorigenesis8. Whereas the cellular functions of SIRT1 have been extensively investigated, less is known about the regulation of SIRT1 activity. Here we show that Deleted in Breast Cancer-1 (DBC1), initially cloned from a region (8p21) homozygously deleted in breast cancers9, forms a stable complex with SIRT1. DBC1 directly interacts with SIRT1 and inhibits SIRT1 activity in vitro andin vivo. Downregulation of DBC1 expression potentiates SIRT1-dependent inhibition of apoptosis induced by genotoxic stress. Our results shed new light on the regulation of SIRT1 and have important implications in understanding the molecular mechanism of ageing and cancer.”

The DBC1–SIRT1 interaction increases following DNA damage and oxidative stress

The 2012 publication Regulation of SIRT1 activity by genotoxic stress reports: “SIRT1 regulates a variety of cellular functions, including cellular stress responses and energy metabolism. SIRT1 activity is negatively regulated by DBC1 (Deleted in Breast Cancer 1) through direct binding. However, how the DBC1–SIRT1 interaction is regulated remains unclear. We found that the DBC1–SIRT1 interaction increases following DNA damage and oxidative stress. The stress-induced DBC1–SIRT1 interaction requires the ATM-dependent phosphorylation of DBC1 at Thr 454, which creates a second binding site for SIRT1. Finally, we showed that the stress-induced DBC1–SIRT1 interaction is important for cell fate determination following genotoxic stress. These results revealed a novel mechanism of SIRT1 regulation during genotoxic stress.”  So, there is another unvirtuous loop:  if there is insufficient NAD+, the PARP DNA repair machinery will not work well creating greater oxidative stress which down-regulates SIRT1 further impairing the NAD salvage cycle.

 Interestingly, it apears that resveratrol can block the SIRT1 down-regulating effect of DBC1/CCAR2.

The 2014 publication Resveratrol delays Wallerian degeneration in a NAD(+) and DBC1 dependent manner  reports: “Axonal degeneration is a central process in the pathogenesis of several neurodegenerative diseases. Understanding the molecular mechanisms that are involved in axonal degeneration is crucial to developing new therapies against diseases involving neuronal damage. Resveratrol is a putative SIRT1 activator that has been shown to delay neurodegenerative diseases, including Amyotrophic Lateral Sclerosis, Alzheimer, and Huntington’s disease. However, the effect of resveratrol on axonal degeneration is still controversial. Using an in vitro model of Wallerian degeneration based on cultures of explants of the dorsal root ganglia (DRG), we showed that resveratrol produces a delay in axonal degeneration. Furthermore, the effect of resveratrol on Wallerian degeneration was lost when SIRT1 was pharmacologically inhibited. Interestingly, we found that knocking out Deleted in Breast Cancer-1 (DBC1), an endogenous SIRT1 inhibitor, restores the neuroprotective effect of resveratrol. However, resveratrol did not have an additive protective effect in DBC1 knockout-derived DRGs, suggesting that resveratrol and DBC1 are working through the same signaling pathway. We found biochemical evidence suggesting that resveratrol protects against Wallerian degeneration by promoting the dissociation of SIRT1 and DBC1 in cultured ganglia. Finally, we demonstrated that resveratrol can delay degeneration of crushed nerves in vivo. We propose that resveratrol protects against Wallerian degeneration by activating SIRT1 through dissociation from its inhibitor DBC1.”

Other relevant publications on DBC1/CCAR2 include:

Age-related decline in NAD+

Image may be NSFW.
Clik here to view.
blogp4

Image and legend source  Correlation between NAD+ levels and Age in (A) Males (B) Females.. From: Age-Associated Changes In Oxidative Stress and NAD+ Metabolism In Human Tissue .
(A) NAD+ concentrations decline with age in males. NAD+ levels decreased significantly in males aged between 0–77 years (line a; p = 0.0007; n = 27). Pearson’s correlation coefficient for a normally distributed population, r = −0.769. The post-pubescent data for male subjects also showed a decline in NAD+ levels with age (line b; r = −0.706; p = 0.0001; n = 19). An exponential (first-order) least squares fit was used to generate the nonlinear trend lines (line a and b). (B)NAD+ concentrations decreased significantly with age (36–76) in post-pubescent females (p = 0.01; n = 22).Pearson’s correlation coefficient for a normally distributed population,r = −0.537. An exponential (first-order) least squares fit was used to generate the nonlinear trend line.”

NAD SYNTHESIS

in general, there are two major pathways via which NAD can be synthesized in the body: the de-novo pathway for synthesizing NAD from raw materials, and the salvage pathway which involves recycling NAD between its two states NAD+ and NADH.

The de-novo pathway.

Again from Dissecting Systemic Control of Metabolism and Aging in the NAD World: The Importance of SIRT1 and NAMPT-mediated NAD Biosynthesis:   “NAD is synthesized from three major precursors—tryptophan, nicotinic acid, and nicotinamide [38] and [39]. Lower eukaryotes and invertebrates, such as yeast, worms, and flies, use nicotinic acid, a form of vitamin B3, as a major NAD precursor, whereas mammals predominantly use nicotinamide, another form of vitamin B3, for NAD biosynthesis. In mammals, NAMPT initiates the major NAD biosynthesis pathway by converting nicotinamide and 5′-phosphoribosyl-1-pyrophosphate (5′-PRPP) to nicotinamide mononucleotide (NMN), which is the rate-limiting step in this NAD biosynthesis [11] and [12]. The second enzyme, nicotinamide/nicotinic acid mononucleotide adenylyltransferase (NMNAT), completes NAD biosynthesis by transferring adenine from ATP to NMN. There are three distinct isoforms for NMNAT, NMNAT1-3, which are localized in nucleus, cytoplasm, and mitochondria, respectively, suggesting that NAD biosynthesis mediated by NAMPT and NMNAT might be compartmentalized in each subcellular compartment [40] and [41].”  Later. we discuss how one possible strategy for enhancing body level of NAD is supplementation with NMN.  This has worked remarkably well to produce health benefits in small animals, but the substance is now extremely expensive.

PROPERTIES OF THE NAD SALVAGE CYCLE

A diagram for the salvage pathway has already been offered above.  the following diagram shows both the de-novo and the salvage pathway.

Image may be NSFW.
Clik here to view.
blogp5

Image source

Important aspects of the salvage cycle are 1.  The cycle is under circadian clock and SIRT1 control, 2.  salvage cycle activities regulate expression of several genes via SIRT1 promoter activities, 3.  ROS stress activating p53 is a regulator of the cycle, and 4.  The NAD World includes extra-cellular actions as well as ones in different cell compartments. We expand on each of these points.

1.  Circadian clock regulation of the NAD salvage cycle

The 2009 publication Circadian control of the NAD+ salvage pathway by CLOCK-SIRT1  reports: “Many metabolic and physiological processes display circadian oscillations. We have shown that the core circadian regulator, CLOCK, is a histone acetyltransferase whose activity is counterbalanced by the nicotinamide adenine dinucleotide (NAD+)-dependent histone deacetylase SIRT1. Here we show that intracellular NAD+ levels cycle with a 24-hour rhythm, an oscillation driven by the circadian clock. CLOCK:BMAL1 regulates the circadian expression of NAMPT (nicotinamide phosphoribosyltransferase), an enzyme that provides a rate-limiting step in the NAD+ salvage pathway. SIRT1 is recruited to the Nampt promoter and contributes to the circadian synthesis of its own coenzyme. Using the specific inhibitor FK866, we demonstrated that NAMPT is required to modulate circadian gene expression. Our findings in mouse embryo fibroblasts reveal an interlocked transcriptional-enzymatic feedback loop that governs the molecular interplay between cellular metabolism and circadian rhythms.”

The 2010 publication Clocks  in the NAD World: NAD as a metabolic oscillator for the regulation of metabolism and aging relates: ” Most recently, it has been demonstrated that SIRT1 regulates the amplitude and the duration of circadian gene expression through the interaction and the deacetylation of key circadian clock regulators, such as BMAL1 and PER2. More strikingly, we and others have discovered a novel circadian clock feedback loop in which both the rate-limiting enzyme in mammalian NAD biosynthesis, nicotinamide phosphoribosyltransferase (NAMPT), and NAD levels display circadian oscillations and modulate CLOCK:BMAL1-mediated circadian transcriptional regulation through SIRT1, demonstrating a new function of NAD as a “metabolic oscillator.” These findings reveal a novel system dynamics of a recently proposed systemic regulatory network regulated by NAMPT-mediated NAD biosynthesis and SIRT1, namely, the NAD World. In the light of this concept, a new connection between physiological rhythmicity, metabolism, and aging will be discussed.”

Here is a diagram of the situation:

Image may be NSFW.
Clik here to view.
blogp6

Image source ” The circadian clock controls the expression of nicotinamide phosphoribosyltransferase (NAMPT), which encodes the rate-limiting enzyme in mammalian NAD+ biosynthesis from nicotinamide. NAMPT catalyses the transfer of a phosphoribosyl residue from 5-phosphoribosyl-1-pyrophosphate (PRPP) to nicotinamide to produce nicotinamide mononucleotide (NMN), which is then converted to NAD+ by nicotinamide mononucleotide adenylyltransferases (NMNATs; there are three NMNAT genes). Oscillations in NAMPT levels result in circadian variations in NAD+ levels, which determines the activity of sirtuin 1 (SIRT1) and poly(ADP-ribose) polymerases (PARPs). Therefore, SIRT1 determines the oscillatory levels of its own coenzyme, NAD+ (Ref. 23). SIRT1 can also deacetylate and regulate proteins involved in metabolism and cell proliferation. Orange indicates circadian oscillation. FOXO1, forkhead box O1; LXR, liver X receptor; PPARGC1α, PPARγ co-activator 1α; PPi, pyrophosphate.”

Note that SIRT1 is intrinsic to the operation of the cycle, both regulating the cycle and being regulated by it.

Here is another Depiction of clock regulation of the salvage cycle via BMAL1 and CLOCK:

Image may be NSFW.
Clik here to view.
blogp7

Image and legend source  source   ” A circadian oscillatory feedback loop regulated by NAMPT, SIRT1, and CLOCK/BMAL1 and a possible functional interplay between adipose tissue and two frailty tissues in the NAD World, pancreatic β cells and neurons. NAMPT and NAD levels display circadian oscillations that are regulated by CLOCK/BMAL1 in peripheral tissues, such as the liver and WAT. This NAD oscillation periodically activates SIRT1, which represses CLOCK/BMAL1-mediated transcription of clock target genes, including Nampt itself, completing an interlocked transcriptional-enzymatic feedback loop involving NAMPT-NAD and SIRT1-CLOCK/BMAL1. In pancreatic β cells and central neurons, intracellular NAMPT (iNAMPT) levels are so low [45] that they may not be able to drive the NAMPT–NAD–SIRT1-dependent circadian feedback loop. However, their NAD oscillation might be generated by incorporating NMN that is likely synthesized from nicotinamide (Nic) by extracellular NAMPT (eNAMPT) that could be periodically secreted from adipose tissue.”

2.  The salvage pathway and SIRT1 regulation of gene expression. 

NAD+ regulates gene expression via histone deacetylase activity of SIRT1 at gene promoter sites.

The 2009 publication Enzymes in the NAD+ salvage pathway regulate SIRT1 activity at target gene promoters reports: “In mammals, nicotinamide phosphoribosyltransferase (NAMPT) and nicotinamide mononucleotide adenylyltransferase 1 (NMNAT-1) constitute a nuclear NAD(+) salvage pathway which regulates the functions of NAD(+)-dependent enzymes such as the protein deacetylase SIRT1. One of the major functions of SIRT1 is to regulate target gene transcription through modification of chromatin-associated proteins. However, little is known about the molecular mechanisms by which NAD(+) biosynthetic enzymes regulate SIRT1 activity to control gene transcription in the nucleus. In this study we show that stable short hairpin RNA-mediated knockdown of NAMPT or NMNAT-1 in MCF-7 breast cancer cells reduces total cellular NAD(+) levels and alters global patterns of gene expression. Furthermore, we show that SIRT1 plays a key role in mediating the gene regulatory effects of NAMPT and NMNAT-1. Specifically, we found that SIRT1 binds to the promoters of genes commonly regulated by NAMPT, NMNAT-1, and SIRT1 and that SIRT1 histone deacetylase activity is regulated by NAMPT and NMNAT-1 at these promoters. Most significantly, NMNAT-1 interacts with, and is recruited to target gene promoters by SIRT1. Collectively, our results reveal a mechanism for the direct control of SIRT1 deacetylase activity at a set of target gene promoters by NMNAT-1. This mechanism, in collaboration with NAMPT-dependent regulation of nuclear NAD(+) production, establishes an important pathway for transcription regulation by NAD(+).”

3.  NAD+ synthesis in the salvage cycle is in part mediated by ROS stress and p53 activation.

The 2014 publication The NAD+ synthesizing enzyme nicotinamide mononucleotide adenylyltransferase 2 (NMNAT-2) is a p53 downstream target  reports: “NAD(+) metabolism plays key roles not only in energy production but also in diverse cellular physiology. Aberrant NAD(+) metabolism is considered a hallmark of cancer. Recently, the tumor suppressor p53, a major player in cancer signaling pathways, has been implicated as an important regulator of cellular metabolism. This notion led us to examine whether p53 can regulate NAD(+) biosynthesis in the cell. Our search resulted in the identification of nicotinamide mononucleotide adenylyltransferase 2 (NMNAT-2), a NAD(+) synthetase, as a novel downstream target gene of p53. We show that NMNAT-2 expression is induced upon DNA damage in a p53-dependent manner. Two putative p53 binding sites were identified within the human NMNAT-2 gene, and both were found to be functional in a p53-dependent manner. Furthermore, knockdown of NMNAT-2 significantly reduces cellular NAD(+) levels and protects cells from p53-dependent cell death upon DNA damage, suggesting an important functional role of NMNAT-2 in p53-mediated signaling. Our demonstration that p53 modulates cellular NAD(+) synthesis is congruent with p53’s emerging role as a key regulator of metabolism and related cell fate.

4.  Action in the NAD World takes place in multiple cell compartments: the cytoplasm, the mitochondria and in the nucleus – and also in the plasma.

This point is illustrated in this diagram:

Image may be NSFW.
Clik here to view.
blogp8

Image and legend source   “The subcellular distribution of NAD+ biosynthetic enzymes in mammalian cells is shown on the left-hand side of the figure. All known biosynthetic reactions can take place in the cytosol, although conversion of nicotinamide (Nam) to NAD+ also takes place in the nucleus. However, NAD+ and its biosynthetic intermediates are likely to be freely exchangeable between the cytosol and the nucleus. Mitochondria contain nicotinamide mononucleotide (NMN) adenylyltransferase (NMNAT) activity and can therefore generate NAD+ from NMN. An extracellular form of Nam phosphoribosyltransferase (NamPRT), known as eNamPRT (also known as visfatin), is secreted from adipose tissue. Pyridine bases (Nam and nicotinic acid (NA)) and nucleosides (such as Nam riboside (NR)) enter cells by different transport mechanisms. The compartments of predominant NAD+ generation, the nucleus and mitochondria, also harbour the majority of intracellular NAD+-dependent signalling processes (right-hand side of the figure). Nuclear poly(ADP ribose) polymerase 1 (PARP1) generates polyADP ribose and probably accounts for the majority of nuclear NAD+ degradation. Direct interaction with NMNAT1 facilitates NAD+ supply to activated PARP1. Members of the sirtuin family are found in the nucleus, the cytosol and the mitochondria. SIRT1 is a key regulator of gene expression by deacetylating histone and non-histone targets such as p53. SIRT6 is also a nuclear protein. Among others, it activates PARP1, thereby facilitating DNA repair. SIRT7 is mostly localized to the nucleolus. SIRT2 localizes to the cytosol. SIRT3, SIRT4 and SIRT5 are located in mitochondria. SIRT3 is the major deacetylase in these organelles and a key regulator of metabolic pathways, including β-oxidation of fatty acids and the tricarboxylic acid cycle (TCA). Moreover, it deacetylates and activates superoxide dismutase 2 (SOD2), thereby suppressing reactive oxygen species (ROS) production. CD38, the main mammalian NAD+ glycohydrolase, and the majority of monoADP ribosyltransferases (mARTs) are found on the cell surface. All signalling reactions generate Nam as a common product, which can be recycled into the NAD+biosynthesis pathway by NamPRT.”

THE AVAILABILITY OF NAD+ IS CRITICAL FOR MITOCHONDRIAL FUNCTIONALITY

This has been known for a decade now.   The 2004 publication Poly(ADP-ribose) polymerase-1-mediated cell death in astrocytes requires NAD+ depletion and mitochondrial permeability transition  relates “—. In astrocytes, extracellular NAD(+) can raise intracellular NAD(+) concentrations. To determine whether NAD(+) depletion is necessary for PARP-1-induced MPT, NAD(+) was restored to near-normal levels after PARP-1 activation. Restoration of NAD(+) enabled the recovery of mitochondrial membrane potential and blocked both MPT and cell death. Furthermore, both cyclosporin A and NAD(+) blocked translocation of the apoptosis-inducing factor from mitochondria to nuclei, a step previously shown necessary for PARP-1-induced cell death. These results suggest that NAD(+) depletion and MPT are necessary intermediary steps linking PARP-1 activation to AIF translocation and cell death.”

The 2011 publication Pharmacological effects of exogenous NAD on mitochondrial bioenergetics, DNA repair, and apoptosis  reported: “During the last several years, evidence that various enzymes hydrolyze NAD into bioactive products prompted scientists to revisit or design strategies able to increase intracellular availability of the dinucleotide. However, plasma membrane permeability to NAD and the mitochondrial origin of the dinucleotide still wait to be clearly defined. Here, we report that intracellular NAD contents increased upon exposure of cell lines or primary cultures to exogenous NAD (eNAD). NAD precursors could not reproduce the effects of eNAD, and they were not found in the incubating medium containing eNAD, thereby suggesting direct cellular eNAD uptake. We found that in mitochondria of cells exposed to eNAD, NAD and NADH as well as oxygen consumption and ATP production were increased. Conversely, DNA repair, a well known NAD-dependent process, was unaltered upon eNAD exposure. We also report that eNAD conferred significant cytoprotection from apoptosis triggered by staurosporine, C2-ceramide, or N-methyl-N’-nitro-N-nitrosoguanidine. In particular, eNAD reduced staurosporine-induced loss of mitochondrial membrane potential and ensuing caspase activation. Of importance, pharmacological inhibition or silencing of the NAD-dependent enzyme SIRT1 abrogated the ability of eNAD to provide protection from staurosporine, having no effect on eNAD-dependent protection from C2-ceramide or N-methyl-N’-nitro-N-nitrosoguanidine. Taken together, our findings, on the one hand, strengthen the hypothesis that eNAD crosses the plasma membrane intact and, on the other hand, provide evidence that increased NAD contents significantly affects mitochondrial bioenergetics and sensitivity to apoptosis.”

Declining NAD+ can lead to the collapse of mitochondrially-mediated energy metabolism,  The process appears to be reversible.

The December 2013 publication that catalyzed the current interest in NAD+ and mentioned at the begenning of this blog entry is Declining NAD+ Induces a Pseudohypoxic State Disrupting Nuclear-Mitochondrial Communication during Aging.

“Highlights
• A specific decline in mitochondrially encoded genes occurs during aging in muscle
• Nuclear NAD+ levels regulate mitochondrial homeostasis independently of PGC-1α/β
• Declining NAD+ during aging causes pseudohypoxia, which disrupts OXPHOS function
• Raising nuclear NAD+ in old mice reverses pseudohypoxia and metabolic dysfunction

“Ever since eukaryotes subsumed the bacterial ancestor of mitochondria, the nuclear and mitochondrial genomes have had to closely coordinate their activities, as each encode different subunits of the oxidative phosphorylation (OXPHOS) system. Mitochondrial dysfunction is a hallmark of aging, but its causes are debated. We show that, during aging, there is a specific loss of mitochondrial, but not nuclear, encoded OXPHOS subunits. We trace the cause to an alternate PGC-1α/β-independent pathway of nuclear-mitochondrial communication that is induced by a decline in nuclear NAD+ and the accumulation of HIF-1α under normoxic conditions, with parallels to Warburg reprogramming. Deleting SIRT1 accelerates this process, whereas raising NAD+ levels in old mice restores mitochondrial function to that of a young mouse in a SIRT1-dependent manner. Thus, a pseudohypoxic state that disrupts PGC-1α/β-independent nuclear-mitochondrial communication contributes to the decline in mitochondrial function with age, a process that is apparently reversible.”

” In oncology, the Warburg effect is the observation that most cancer cells predominantly produce energy by a high rate of glycolysis followed by lactic acid fermentation in the cytosol, rather than by a comparatively low rate of glycolysis followed by oxidation of pyruvate in mitochondria as in most normal cells.[4][5][6] The latter process is aerobic (uses oxygen). Malignant, rapidly growing tumor cells typically have glycolytic rates up to 200 times higher than those of their normal tissues of origin; this occurs even if oxygen is plentiful(ref).”

The following diagrams illustrate aspects of the NAD+ – mitochondrial connection:

Image may be NSFW.
Clik here to view.
blogp9
Image may be NSFW.
Clik here to view.
blogp10


Image source


Image and legend source ” We show that, during aging, there is a specific loss of mitochondrial, but not nuclear, encoded oxphos subunits. We trace the cause to an alternate pgc-1a/b-independent pathway of nuclear-mitochondrial communication that is induced by a decline in nuclear NAD+ and the accumulation of hif-1a under normoxic conditions, with parallels to warburg reprogramming. Deleting sirt1 accelerates this process, whereas raising NAD+ levels in old mice restores mitochondrial function to that of a young mouse in a sirt1-dependent manner. Thus, a pseudohypoxic state that disrupts PGC-1a/b-independent nuclear-mitochondrial communication contributes to the decline in mitochondrial function with age, a process that is apparently reversible.”

The following two diagrams illustrates matters discussed above that go on in key cell compartments and outside the cell:

Image may be NSFW.
Clik here to view.
blogp11
Image may be NSFW.
Clik here to view.
blogp12


Images and legend source ” Maintenance of the mitochondrial NAD pool. Although separate, the mitochondrial and nuclear/cytoplasmic NAD pools are intricately connected through the NAD/NADH-redox shuttles (most commonly the malate/aspartate and the glycerol-3-phosphate shuttles) and NAD biosynthetic pathways in each subcellular compartment. Multiple cellular processes play an important role in maintaining an optimal NAD/NADH ratio between mitochondria and the cytoplasm, including glycolysis, the tricarboxylic acid (TCA) cycle, and oxidative phosphorylation by the electron transport chain (ETC). Mitochondrial and nuclear/cytoplasmic NAD biosynthetic pathways are balanced in response to nutritional and environmental stimuli.”

Why this is all important for longevity is illustrated by these diagrams for mice:

Image may be NSFW.
Clik here to view.
blogp14
Image and legend source 

“Activity of brain mitochondrial enzymes that are markers of aging in relation to mice survival. Complex I, complex IV, and mitochondrial nitric oxide (NO) synthase (mtNOS) activities in male (A) and female (B) mice.”


More to come

This blog entry has covered some important basics related to the NAD world, but there is a great deal more to say about the topic. There will be at least one more blog entry in this series where we will go into further detail about the relationship of NAD+ to certain disease processes, discuss possible practical interventions for increasing pools of NAD+ especially in diseased or aging individuals, and discuss the key issue of how the efficacy of such interventions can be measured and dynamically tracked.

NAD+ an emerging framework for life health and life extension — Part 2: Deeper into the NAD World, hopeful interventions

By James P Watson with contributions and assistance by Vince Giuliano

This is Part 2 of what will likely be a three or four-part series of blog entries related to the metabolic cofactor NAD+. The  Part 1 blog entry provided an overview treatment of the NAD World and its nuances: identified the major molecular entities involved, their roles, health and longevity ramifications, the reasons for the current excitement, and begin to clarify what is actually known and what the remaining uncertainties are.  We also discussed a few important facets of the general topic which are ignored in many of the current publications, such as the high degree of circadian regulation of NAD+ .and certain proteins that regulate NAD+ and its cousins such as CD38 and CCAR2,

Introduction to part two by Vince Giuliano.

Personally, I am finding that developing a thorough understanding of the World of NAD+, including what is relevant about all of the Sirtuin’s, cofactors and pathways, is one of the more-difficult intellectual challenges I have ever faced.  I am reminded of the process of  understanding quantum physics I went through as a university student.  And the difficulty of getting my mind around a complex of strange and completely non-intuitive concepts, dreaming strange dreams at night  until I was finally willing to live with what I could not completely fathom. I am reminded of the wisdom of the often-quoted Winston Churchill graduation speech to his high school where he virtually flunked out years earlier “never give up. Never give up. Never give up!  Never.  Never.  Never, (ref)” For personally I think the NAD World is extremely important pathway and I want to understand it to the limit of my capability and what is actually known. In that light, I acknowledge that this present blog entry covers much of the same territory as that already covered in the Part 1 blog entry.  However, the coverage is from a different set of perspectives and includes much new material.  While there is significant redundancy between what is discussed here and in the Part 1 blog entry, and additional redundancy within this blog entry itself, I believe this can contribute to understanding.

This blog entry concentrates on the reasons for focusing on NAD+, particularly with respect to interventions that are seriously likely to lead to longer healthier lives.  It discusses molecular processes in the NAD salvage cycle that are responsible for the health-inducing and life-extending properties of calorie restriction and further discuss the key roles of Sirtuins, SIRT1, SIRT6 and SIRT7 in particular. It goes into more detail in several areas covered less- deeply in the Part 1 blog entry. It points to some difficult-to-integrate contrarian research and basic uncertainties. Also, Jim amfd I are centrally concerned with developing a set of biomarkers that can tell us what the various approaches to enhancing body levels of NAD+ actually accomplish or fail to accomplish.  So many of our comments are addressed to this point.

We expect Part 3 will go into additional detail more explicitly describing a number of strategies currently being researched or proposed for maintaining high constituent levels of NAD+.  We expect to further explain reasons why simply enhancing NAD+ levels might not work to increase health or longevity and speculates on what else might have to be done in addition.  Finally, we expect further to discusses a variety of practical biomarkers to enable comparative evaluation of the NAD+ enhancement strategies, including information that might be provided by a new generation of health and fitness smart watches, smart bands, and other consumer measuring devices just now coming on the market.

Like many of our blog entries, this one is crammed full of detail. So, I would like to telegraph a few of the central take-home messages as I see them:

Our perception is that a big new area of longevity science may be opening up connected wih NAD, metabolisn and Sirtuins, one that may well offer new practical interventions that could lead to longer healthier lives. There are strong theoretical as well as experimental reasons for believing that enhancing body levels of NAD+ may have a chance of enhancing health and longevity while more conventional approaches do a limited job or fail.  We identify those reasons here.

  1. There are several alternative approaches now being investigated to achieve such enhancement, including supplementation with NMN, or with nicotinamide riboside (NR) and direct IV infusion of NAD. We don’t know which one will be best. or even the extent to which any one really works in humans to enhance health and longevity.   Nonetheless, we probably are seeing a commercial rush to bring NMN supplements to the market, and NR is already being sold as a supplement.
  2. There are additional theoretical reasons for suspecting that such benefits may not emerge or that they may require additional interventions for their realization. One approach for enhancing NAD+ levels may be far superior to the others.  For example many of the benefits of NAD plus supplementation can be attributed to higher activity of the Surtuin SIRT1.  However, what actually happens with Sirtuin expression is the result of a complex network of feedback-inhibition loops and many known factors can work to limit or eliminate Sirtuin levels or activity.  We have very poor understanding of how these feedback inhibition loops ultimately net out in live mice under various real-life conditions, let alone in us.
  3. We offer many predictions below about probable health benefits of NAD+ supplementation. We need to acknowledge that some or all of these could be wrong.
  4. For this last reasons, it is very important to develop a panel of practically measurable bottom-line biomarkers that tell us what a form of NAD+ enhancement is actually doing in our body to enhance health and possible longevity. And, to tell us other things we don’t understand well, such as how best to synchronize NAD+ enhancement with our circadian rhythms and additional interventions such as fasting and exercise. Otherwise, we will be flying blind with respect to the efficacy of NAD+ enhancement, much as we have been traditionally flying blind with respect to the efficacy of consuming dietary health supplements. We identify a number of such possible biomarkers in the course of this blog entry, although we leave discussion of practical means to measure these biomarkers to a subsequent blog entry in this series.

The Discovery of NAD+ and NAD+ Metabolism

 How NAD+ was discoveredYeast fermentation of sugar

Four Nobel prize winners contributed to the discovery of NAD+, starting with Sir Arthur Harden who studied yeast fermentation of sugar back in 1904 and isolated a low molecular weight fraction and a high molecular weight fraction, both of which were necessary for the fermentation to occur.  He did not know that the low molecular weight fraction was NAD+, but called this low molecular weight fraction “cozymaze”.  Later on Hans von Euhler-Chelpin  showed that cozymaze was made two mononucleotides, AMP and NMN. Then in 1936 Otto Warburg, showed that cozymaze was involved in hydrogen transfer (now called redox reactions).  In 1948, Arthur Kornberg showed that NAD+ was synthesized enzymatically within cells by an enzyme that consumed ATP and linked NMN with AMP to form NAD+. All of these scientists won Nobel prizes during their career. However, it would be another 55 years before the primary structure of the NAD biosynthetic enzyme (NMNAT) was determined. Thus the entire discovery process of NAD+ and NAD+ biosynthesis took over 100 years to get to where we are today.

Image may be NSFW.
Clik here to view.
NAD+1

Images source

Popular but questionably effective downstream attempts to increase longevity and calorie restriction that actually does this

Next, again as background we review a) why antioxidants, vitamins, and hormones fail to reverse aging, b) the molecular pathways of calorie restriction (CR) which is the best known intervention for life extension, and c) how Sirtuins are the key molecular actors for health and longevity resulting from both calorie restriction and NAD+ enhancement.

Why Antioxidants, Vitamins, and Hormones failed to reverse agingThey treat the symptoms and not the causes

Although many drivers of human aging can be slowed or delayed, many of these factors are thought to be non-reversible reversible. (Ex: DNA gene mutations are not reversible). Most “anti-aging” supplements like anti-oxidants cannot reverse such aspects of aging.  Instead, they merely “control damage,” and many have a mixed track record of efficacy in clinical trials.  Likewise, hormone replacement therapy (HRT) does not reverse aging, despite the claims of some “anti-aging” clinics. In fact, emerging scientific studies have shown that exogenous anti-oxidant supplements and HRTs have a paradoxical effect. For instance, exercise has been shown to increase the expression of anti-oxidant genes and increase the expression of endogenous hormones (hGH, etc.). However, when exogenous anti-oxidants are used, this reduces the expression of anti-oxidant genes induced by the exercise producing a negative effect. Likewise, exogenous HRT use suppresses endogenous hormone production and thereby accelerates the decline in hormone gene expression that occurs with aging (via an epigenetic feedback-this is so good inhibition mechanism). This is why many testosterone users have testicular atrophy. Thus antioxidants and HRTs treat the symptoms (i.e. “downstream effects) of aging, rather than the cause (“upstream events”) of aging.

Current initiatives to restore NAD+ levels in individuals are attempts to affect what we believe are “upstream events” in aging to produce positive downstream events, such as already has been shown to be possible in various studies – like reversal of muscle aging in rodents.

Because nuclear NAD+ deficiency has so many impacts that mimic those of caloric restriction (CR), we look next at how it affects upstream events in molecular aging.  We are also looking at CR for ideas for the best biomarkers for objectively evaluating the “upstream effects” of restoring NAD+ levels in the nucleus.

Why Calorie Restriction (CR) increases life span  – CR affects the “upstream events” in molecular aging

Caloric restriction (CR) is the most scientifically-validated method of increasing life span and health span.  This involves reducing caloric intake by 10-40% (below RDA) without inducing protein-calorie malnutrition. The molecular mechanisms of CR are complex, but simply put, they impede and slow “pro-aging pathways” and amplify “longevity pathways”.  The two major “pro-aging pathways” are the Insulin/IGF-1 pathway and the mTOR pathway. CR inhibits both of these.  The “longevity pathways” involve AMPK,  Sirtuins, Glucagon, and Adiponectin. CR activates all of these. The diagram below shows the molecular mechanism of each of these factors in CR.

Image may be NSFW.
Clik here to view.
NAD+00

The Role of Sirtuins in Caloric Restriction (CR)Sirtuins are integrally involved with all of the CR pathways and are the main actors for both calorie restriction and NAD+ health and longevity interventions.

In the diagram above, there are three red ovals that comprise a major molecular pathway of CR involving the family of enzymes called Sirtuins. One red ovals contain the symbols for the one of the 7 Sirtuin enzymes called Sirtuin 1 (SIRT1).  Another red oval contains symbol for Nicotinamide adenine dinucleotide (NAD+), which is the substrate that activates all of the Sirtuin enzymes. Sirtuin enzymes consume NAD+, producing a by product called Nicotinamide (Nam), which inhibits SIRT enzymes.  The last red oval represents the enzyme called Nampt, which is the rate-limiting enzyme in the pathway that converts Nam back into NAD+, thereby renewing the supply of NAD+ to activate SIRT enzymes.  If you have read the Part 1 blog entry, you will recognize this pathway of regenerating NAD+ from Nam which is called the “NAD+ salvage pathway.” Activating these “red ovals” and restoring normal Sirtuin function is the goal of interventions intended to elevate or restore nulcear levels of NAD+.

The diagram above only shows one Sirtuin enzyme, SIRT1.  In reality, there are 7 NAD+-dependent Sirtuins (SIRT1-7) which all play a role in CR molecular mechanisms. Sirtuins affect almost every oval in the diagram below because they activate or inhibit other CR proteins by removing acetyl groups from these CR proteins.  In the diagram above, the small “Ac” stands for an “acetyl” group. SIRT1 directly affects all of the CR proteins that have an “Ac” on the diagram. It deacetylates and therefore tends to activate them.

For discussion of many of the benefits of Sirtuins, you can review the blogs on the series Slaying Two Dragons With One Stone (the Sound of Silence), Part 1, Part 2 and Part 3.

In addition to the major molecular pathway of CR on aging shown above, there are more important but lesser- known factors that change with CR, such as Klotho, p66shc, and DNA repair pathways. Although none of these pathways alone can account for the beneficial effects of CR, all of them probably work together to increase healthspan in all organisms studied to date.  It is the involvement of NAD+ as a required substrate for the Sirtuin enzymes that is the focus of initiatives to restore the nuclear levels of NAD+. 

Although the diagram does not illustrate this, NAD+ drives the Sirtuin-dependent deacetylation of many of the enzymes shown above, including eNOS, NF-kB, PGC-1a, Foxos, LKB1, and IRS1/IRS2. By NAD+-dependent deacetylation of these enzymes, Sirtuins thereby affect every major molecular pathway that involves aging. This is why many researchers believe restoring NAD+ levels in the cell is so important for affecting the “cause” of aging, rather than the “effects” of aging.

A 2012 review article, Cantó et. al.  Targeting SIRT1 to improve metabolism: all you need is NAD+? anallyzes ” the pros and cons of the current strategies used to activate SIRT1 and explore the emerging evidence indicating that modulation of NAD+ levels could provide an effective way to achieve such goals.”

The Two Roles of NAD+Contrasting the Cofactor vs Signaling role of NAD+

(Note that the Part 1 blog entry introduces the main actors in the cast of NAD World, molecular entities mentioned below, like NAD+, NADH, NADPH. ATP. etc.)

NAD+ does two things: a) it serves as a cofactor in redox and important metabolic reactions in which case it is shuttled back and forth between the NAD+ and NADH forms but is not consumed, and b) it serves as a signaling molecule in which case it is consumed as a substrate.

When NAD+ and NADP were discovered, they were thought to function only as a cofactor in redox reactions. Here they functioned as an “energy currency”, transferring high energy electrons from fuel oxidation (carbohydrates, fats, protein or alcohol) to the mitochondria (NADH) or the plasma membrane (NADPH) to generate ATP.  In these reactions, NAD(P)  “accepted” hydride groups (2 electrons and one proton) and NAD(P)H “donated” hydride groups, transferring the high energy electrons to another substrate.  Thus NAD/NADH was the recycled cofactor pair in the catabolic oxidation of carbohydrates, fatty acids, proteins, and alcohol.  On the other hand, NADP/NADPH was the recycled cofactor pair in the anabolic synthesis of fatty acids and cholesterol.  In these redox reactions, no NAD or NADP molecules are consumed.  Over 200 cellular enzymes utilize either NAD+/NADH or NADP/NADPH as a cofactor this way.

It was not until recently, however, that a second role for NAD+ as a signaling molecule was discovered. In these reactions, NAD+ does not accept hydride groups and the molecule is not recycled.  Instead, the NAD+ molecule is consumed as a substrate and the glycosidic bond between the ADP-ribose moiety and the nicotinamide moiety (NAM) of the molecule is broken, releasing NADM and ADP-ribose as byproducts of the reaction. Sirtuins are just one of many enzymes that “consume” NAD+ as a substrate.  The two contrasting roles for NAD+ as a cofactor vs a substrate are illustrated below:

The Redox/Co-Factor Role of NAD+ and NADPH  and The Signaling Compound/Substrate Role of NAD+

Image may be NSFW.
Clik here to view.
NAD+3
Image may be NSFW.
Clik here to view.
NAD+2

Image source

What makes and what eats-up NAD+?  Causes of NAD+ deficiency with aging.

Although NAD+ can be made from the amino acid tryptophan by an 8-step pathway called the de novo pathway,  this pathway does not work very well in most cells.  For this reason, most of the consumed NAD+ is converted to nicotinamide and then “salvaged” by a two step process that converts it back into NAD+.  This pathway is called the salvage pathway and is rate-limited by the first enzyme in the two-step pathway called NAMPT.  NAMPT gene expression can be activated by caloric restriction (CR) or exercise and this may be a major reason why both CR and exercise have long term health benefits.  However even with exercise and caloric restriction, nuclear NAD+ levels decline with aging.

It is unclear now if the cause of age-related nuclear NAD+ deficiency is due to Sirtuins, PARPs, CD38, or a decline in the expression of NAMPT.  Most studies suggest that it is a combination of all four factors and that “genotoxic stress” is a major driving force for nuclear NAD+ deficiency.  The synergistic effects of genotoxic stress inducing single stranded DNA breaks and double-stranded DNA breaks and the combined effect of Sirtuins and PARPs is illustrated below:

Image may be NSFW.
Clik here to view.
NAD+4

Image source

Also, NAD+ can be provided by an exogenous source such as an IV, and its level can possibly enhanced such as by NMN or NR supplementation as discussed below. And also as outlined below numerous factors can affect SIRT activation levels.

NAD+ and aging

Nuclear NAD+ decline and AgingOne cause of aging is thought to be the effect of NAD+-consuming enzymes in the cell nucleus

One of the “upstream events” in aging appears to be the decline in NAD+ within the nucleus of the cell. This appears to occur within all 37 trillion cells within the human body.  The decline is due to several classes of NAD+-consuming enzymes called Sirtuins, PARPs, and ADP-ribose glycohydrolases.  These enzymes perform absolutely essential functions required for cell health and each consumes NAD+ as a substrate.  Aging appears to be associated with increasing insufficiency of enough NAD+ to support the growing demands of these.  Sirtuins are a class of NAD+-consuming enzymes needed for double stranded DNA repair, for epigenetic gene silencing, and for chromatin remodeling.  Poly-ADP-ribose Polymerases (PARPs) is another class of NAD+-consuming enzymes involved with repair of single stranded break DNA damage.  PARPs also initiate cell death (apoptosis) in cancer cells and cells whose DNA is beyond repair.  More recently, a third type of NAD+-consuming enzyme has been found in the nucleus called CD38, once thought to only exist outside the cell.  CD38 is a part of the family of enzymes called ADP-ribose glycohydrolases.  Thus there are at least three families of enzymes all competing for the same pool of NAD+ within the nucleus of the cell.

Aging and NAD+ Aging in the NAD world-view is due  to a “nuclear NAD+ deficiency” incurred from NAD+-consuming enzymes

For quite some time, caloric restriction (CR) has been regarded as the most scientifically-validated method to retard aging. CR research has lead to the discovery of several major molecular pathways that accelerate or retard aging, including the Insulin/IGF-1 pathway (age accelerator), the mTOR pathway (age accelerator), the AMPK pathway (aging brake), and Sirtuins (aging brake).  It is the role of NAD+ as a required substrate for Sirtuins that lead to the recent discovery that there is a nuclear NAD+ deficiency that affects not only Sirtuins, but another set of important NAD+ consuming enzymes called Poly-ADP-ribose Polymerases (PARPs).  Both the Sirtuins and the PARPs are involved with the DNA damage response to genotoxic stress.  Sirtuins play a major role in double-stranded DNA breaks whereas PARPs play a major role in single-stranded DNA breaks.  Here is a simplified diagram showing how both SIRTs and PARPs use up NAD+ in the nucleus of the cell:

Image may be NSFW.
Clik here to view.
NAD+5

Image source

Restoring nuclear NAD+ levels may reverse aging

Recent work has shown that restoring nuclear NAD+ levels in aging mice actually reversed a common phenotypes of aging – that of mitochondrial dysfunction.  Mitochondrial dysfunction manifests itself as a decline in ATP production, a decline in heat production, excessive cellular free radical production, and increased DNA damage.

Although there are many proposed strategies for restoring nuclear NAD+ levels to normal, the only one that has been successfully accomplished this experimentally so far (with mice) is nicotinamide mononucleotide (NMN).  However, many experts believe that supplementation with nicotinamide riboside (NR) or directly with NAD will also restore nuclear NAD+ levels.  See the 2012 publication Canto et. al.  The NAD+ precursor nicotinamide riboside enhances oxidative metabolism and protects against high-fat diet induced obesity.  “As NAD+ is a rate-limiting cosubstrate for the sirtuin enzymes, its modulation is emerging as a valuable tool to regulate sirtuin function and, consequently, oxidative metabolism. In line with this premise, decreased activity of PARP-1 or CD38—both NAD+ consumers—increases NAD+ bioavailability, resulting in SIRT1 activation and protection against metabolic disease. Here we evaluated whether similar effects could be achieved by increasing the supply of nicotinamide riboside (NR), a recently described natural NAD+ precursor with the ability to increase NAD+ levels, Sir2-dependent gene silencing, and replicative life span in yeast. We show that NR supplementation in mammalian cells and mouse tissues increases NAD+ levels and activates SIRT1 and SIRT3, culminating in enhanced oxidative metabolism and protection against high-fat diet-induced metabolic abnormalities. Consequently, our results indicate that the natural vitamin NR could be used as a nutritional supplement to ameliorate metabolic and age-related disorders characterized by defective mitochondrial function.”

Others have suggested alternative strategies such as PARP inhibition, CD38 inhibition,  or increasing NAMPT activity.  We are interested in all of the above.  We are not interested in limiting our approach to one particular strategy.  Likewise, we do not believe that any particular NAD precursor, NAD metabolite, or enzyme inhibitor is a replacement for sleep, exercise, and caloric restriction, which have already been scientifically proven to help ameliorate the nuclear NAD+ problem.  Rather, we are interested in doing whatever it takes to restore nuclear NAD+ levels, using sleep, exercise, and CR as fundamental strategies and various NAD precursors, PARP inhibitors, and CD38 inhibitors as adjuncts to a healthy lifestyle.  Further, we strongly suspect that determination of what works best and under what conditions cannot be based on theory and will require monitoring a panel of biomarkers.  My personal  goal is not to increase lifespan but to increase healthspan, although increasing healthspan could increase lifespan.

This diagram projects an increase of lifespan possibly associated with NMN

Image may be NSFW.
Clik here to view.
NAD+6

Image source

How NAD+ activates SIRTs and the competing “NAD+ consumers”

Based on the evidence from CR studies, there is strong scientific evidence that activating Sirtuins has major positive health effects and longevity benefits in most all animal models.  Although there are 7 different Sirtuin enzymes (SIRT1-7), SIRT1 is the most well understood member of this family of enzymes. All 7 Sirtuins require NAD+ as a substrate for the enzymes to work. Sirtuin enzymes consume NAD+, converting it into nicotinamide (NAM). NAM itself inhibits SIRT1 activity, but NAM can be “salvaged” and converted back into NAD+ (see diagram below). This conversion of NAM back into NAD+ is a two-step enzymatic process called the “NAD+ salvage pathway” described in our Part 1 blog entry and  covered more in additional detail here.

Image may be NSFW.
Clik here to view.
NAD+8
         Image may be NSFW.
Clik here to view.
NAD+7

Image source  NAD+ is consumed by enzymatic activity of all 7 of the Sirtuin isoforms (SIRT1-7). The consumption of NAD+ produces the byproduct, Nicotinamide (NAM) which can be “recycled” to NAD+  in the 2-step process shown above that is called the salvage cycle, which requires PRPP & ATP to run the cycle.

As discussed in the Part 1 blog entry, there are other enzymes that also require NAD+ as a substrate, such as the PARP family of enzymes as well as CD38 (see diagram below).  These other NAD+-consuming enzymes “compete” with SIRT enzymes in the nucleus and this competition may be the primary reason why nuclear NAD+ levels decline with aging.  Again, this is why restoring nuclear NAD+ levels is thought to be a good idea.

The above two diagrams illustrate the key “suspects” in the etiology of SIRT deficiency-induced aging.  As you can see, this “SIRT1 deficiency” is not a deficiency in the protein, but a deficiency in the activity of the protein.  It has been clearly shown that in most scenarios, there is no decline in SIRT1 protein availability with aging.  This may be because the SIRT1 protein can regulate its own gene expression.  This auto-regulation may be why the expression of SIRT1 protein does not decline with aging.

What is also a mystery is that aging also is associated with a decline in the expression of SIRT3.  It appears that the reason for this decline in SIRT3 expression may be due to the fact that SIRT1 regulates the gene expression of SIRT3. This is why many experts believe that the decline in SIRT1 activity is an “upstream event”, whereas the decline in SIRT3 is a “down stream events”.  The following possible causes for the decline in SIRT1 activity are illustrated in the diagrams above and listed in the table below:

Possible Causes of the Decline in SIRT1 activity with Aging1.

Decline in iNAMPT activity – The NAD+ salvage pathway has a rate-limiting enzyme called Nicotinamide phosphoribosyltransferase (NAMPT). Because there is both an intracellular and an extracellular localization of NAMPT, it is sometimes abbreviated as iNAMPT (intracellular NAMPT) and eNAMPT (extracellular form, which has also been called eNAMPT, PBEF, or Visfatin). eNAMP circulates in the blood and will be discussed elsewhere.  With iNAMPT, several independent studies have shown that iNAMPT gene expression and iNAMPT protein activity declines with aging and that this decline in iNAMPT activity precedes replicative senescence of cells, such as human vascular smooth muscle cells (VSMCs) (Eric van der Veer, Extension of Human Cell Lifespan by Nicotinamide Phosphoribosyltransferase 2007).  Even more interestingly, before the VSMCs became senescent, the decrease in NAMPT enzymatic activity was even greater than the decline in NAMPT gene expression with NAMPT enzyme activity dropping to 14% of baseline prior to VSMC senescence.   This is a very powerful argument that NAMPT is a “longevity protein” that extends the lifespan of VSMCs by activating SIRT1 and restraining the accumulation of p53 (SIRT1 mediates p53 degradation).

The “good news” is that there are 4 ways to increase NAMPT activity: caloric restriction (CR), fasting, exercise, and ATR1 blockade. The mechanism by which CR and fasting increase NAMPT is probably due to the fact that the SIRT1 protein regulates the NAMPT gene (Zhang, Enzymes in the NAD+ Salvage Pathway Regulate SIRT1 Activity at Target Gene Promoters  2009). The mechanism by which exercise induces an increase in NAMPT expression is via AMPK-mediated PGC-1α activity.  Athletes have a 2-fold higher levels of NAMPT in their skeletal muscle compared with sedentary adults (obese, non-obese, and T2DM). Three weeks of exercise training increases NAMPT protein in skeletal muscles by 127%.

AICAR, a potent “exercise mimetic”, increases skeletal muscle NAMPT mRNA by 3.4-fold. (Costford et.al., Skeletal muscle NAMPT is induced by exercise in humans, 2010). Recently, a fourth method to increase iNAMPT gene expression was found: angiotensin receptor 1 (ATR1) blockade. ATR1 blockers such as candesartan and     telmisartan increase expression of NAMPT and SIRT3 genes, increased NAD+ levels, increased mitochondrial biogenesis, and reduced atherosclersosis in in vivo studies.  Even more surprising was that in ATR1 gene knock-out mice, there was a 26% longer lifespan. (Benigni et.al., Disruption of the Ang II type 1 receptor promotes longevity in mice 2009).  This effect was not mediated by the usual CR  pathways, but appeared to be a CR independent mechanism, mediated by an increase in iNAMPT and SIRT3.

Conclusion:  CR, fasting, and regular exercise decelerates the deleterious effects of aging via SIRT1-dependent pathways by stimulating of NAD+ biosynthesis via increase in NAMPT gene expression.  ATR1 blockade increases NAMPT gene expression via an unknown, CR-independent mechanism.

  1. Increase in PARP activity – There is recent evidence that a decline in NAD+ levels occurs in the nucleus of the cell with aging. As we have already indicted, the exact cause of this “nuclear NAD+ decline” is unknown and is the focus of research initiatives for restoration of nuclear NAD+. We have already discusssed the role of the PARPs as NAD+ consumers above and in the Part 1 blog entry.

SIRT1 – The Most Important Sirtuin in Aging and Age-related Diseases

Here, we review some of the most compelling reasons why SIRT1, the queen of the Sirtuins, is so important for health and longevity.

Depletion of SIRT1 by siRNA knockdown significantly alters the expression of about 200 genes (Zhang, Enzymes in the NAD+ Salvage Pathway Regulate SIRT1 Activity at Target Gene Promoters  2009). Here are some of the effects of SIRT1 on various organs in the body that have been scientifically proven in animal models. We believe that restoring nuclear NAD+ levels to normal will probably have all of these effects on the body, as well as many other positive effects, since NAD+ activates all 7 of the Sirtuins, not just the SIRT1 isoform.

                        Image may be NSFW.
Clik here to view.
NAD+9

Image source: Sirtuins — novel therapeutic targets to treat age-associated diseases

As you can see from the diagram above, there are beneficial effects of SIRT1 activation on almost every organ system in the body. Many of these have to do with ameliorating the signs or symptoms of metabolic syndrome and type II diabetes mellitus. For those that are not familiar with Sirtuin proteins, it is important to understand that SIRT1 does not circulate as a hormone, but instead, is a protein largely confined to the nucleus of the individual cell.  In the cell nucleus, SIRT1 deacetylates many proteins that activate or inhibit gene expression.  These effects are thought to be largely but not exclusively  due to epigenetic mechanisms involving the deacetylation of histone proteins.  SIRT1 deacetylates many other proteins found in the nucleus other than histone proteins. The following sections will cover both the histone and the “non-histone” effects of SRIT1 in the nucleus of the cell. All of these benefits of SIRT1 are easier to understand if one familiarizes themselves with the fundamental aspects of epigenetics. This article does not go into detail about epigenetics, but it would be wise for the unfamiliar reader to delve into this topic first before proceeding to read the following sections.  Past blog entries related to epigenetics are listed here.  And the many prevous blog entries related to Sirtuins are listed here.  For now, we will focus on the specific effects of SIRT1 within the nucleus of a cell, as described below.  Then we’ll cover the other nuclear-localized members of the Sirtuin family, SIRT6 and SIRT7.

Major SIRT1 Functions #1: Preventing cellular senescence  –SIRT1 prevents cell cycle arrest via six mechanisms.  We first list these mechanisms and then review what cellular senescence is and further discuss why it is important, and what these SIRT1 impacts are.

1) SIRT1 helps repair double stranded DNA breaks, which is a major “upstream cause” of cellular senescence

2) SIRT1 epigenetically prevents expression of the p16INK4a/ARF promoter by maintaining promoter hypermethylation

3) SIRT1 epigenetically prevents gene expression of p16INK4a/ARF decetylation of H3K9 histone proteins

4) SIRT1 genetically activates Akt/p70S6K1 signaling, thereby inducing p16INK4a/ARF repression

5) SIRT1 prevents p53-induced cell cycle arrest by deacetylating p53

6) SIRT1 prevents the formation of heterochromatin by deacetylating histone linker proteins (H1K24)

About cellular senescence

Cellular senescence is defined as “cell cycle arrest” and is a major hallmark of aging in all species. In old age, approximately 15-20% of cells in non-human primates show markers for cellular senescence (Herbig, Cellular Senescence in Aging Primates 2006). In human bone marrow stromal cells cultured in vitro, the percentage of senescent cells increases 4% per population doubling in old bone marrow cells vs only 0.4% per population doubling in young bone marrow cells (Stenderup, Aging is associated with decreased maximal life span and accelerated senescence of bone marrow stromal cells  2003).

Some past blog entries discussing cell senescence and the roles of p16INK4a/ARF are listed here.

Image may be NSFW.
Clik here to view.
NAD+10

Image and legend source: Cellular Repair and Reversal of Aging: the Role of NAD  “Schematic illustration of NAD+-mediated sirtuins actions on NF-κB. During inflammation reduced levels of NAD+ do not impaired the hyperacetylation of NF-κB which in turn through promoter region of target genes activate pro-inflammatory pathway and senescence. Conversely, increased cellular levels of NAD+ activate SIRT1, 2 and 6 which deacetylate NF-κB inhibiting its transcriptional role and then inflammation.”

Although cell senescence has many beneficial, vital roles in normal life (embryogenesis, wound healing, cancer prevention, red blood cell aging, etc.) senescent cells are rare in young organisms.  In old age, all species start to accumulate old cells that will not divide (i.e. are senescent). Normally old cells undergo apoptosis, but these senescent cells are resistant to apoptosis, which means they hang around for longer than cells should. Moreover, they secrete a toxic mixture of secretions that are pro-inflammatory and actually help cancers grow (called the senescence associated secretory phenotype, aka SASP).  Other than genetic modifications of cells, no “cure” for the accumulation of senescent cells has been found to date.  For this reason, many researchers have believed the best way to prevent aging would be to prevent cellular senescence without increasing the risk of cancer.  Caloric restriction (CR) is the most effective method to date that has been discovered for preventing cellular senescence.  SIRT1 appears to be an important reason why CR prevents cellular senescence.

To understand cellular senescence on a molecular level, it is important to understand the major causes of cellular senescence, which includes DNA damage and telomere shortening. When either of these events occur, three key proteins trigger cell cycle arrest. They are p16INK4a protein, the ARF protein, and the p53 protein.  Since p16INK4a and ARF are both transcribed from the same gene, I will discuss them together here. However, I will briefly discuss DNA damage and telomere shortening first.

The initial discovery of the phenomena of cellular senescence was by Leonard Hayflick when he noted that diploid fibroblasts in culture would only keep dividing for a finite number of “population doublings”, and then would stop dividing. The number of cell divisions that would trigger this phenomena was referred to as the “Hayflick limit”, but the cause was unknown until researchers discovered that telomeres shortened with each cell division due to the DNA “end replication problem”. Later on, an enzyme called telomerease was discovered that could counteract the telomere shortening that occurred with cell divisions.  The researchers who discovered telomerase won the Nobel prize in 2009, but since then, many other factors have been discovered that regulate telomere length (Ex: oxidative stress, the lncRNA called TERRA, Shelterin protein caps on the telomeres that protect the ends, Rap1, Tankyrases, SIRT6, histone protein silencing of telomeric DNA, etc.).

Ten years ago, many of us concerned with aging thought that since telomeres usually get shorter with age and shorter telomeres can lead to cell senescence, health and longevity could be enhanced by interventions that make telomeres longer.  That was a very exciting idea, but it turned out to be wrong.  We now know that telomere lengths are mostly downstream responses to upstream events, just like grey hair and wrinkles are downstream consequences of aging.   See the blog entries Nuclear Aging: The View from the Telomere end of the Chromosome –  Part 1 – context, history, and about telomere lengths and Part 2 – Telomere Molecular Biology and many other blog entries we have writtem about telomeres and telomerase for details.  There is just a possibility that we could be equally wrong about our new exciting idea – that of enhancing NAD+ as a health and longevity intervention.  Time will tell.

When telomeres shorten to a critical point, they trigger the DNA damage response (DDR), which activates p53 and can induce cellular senescence.  Later on, it was discovered that even non-dividing cells and cells with longer telomeres could undergo cellular senescence.  For instance, X-ray or gamma ray radiation can induce cellular senescence in cells with longer telomeres.  Likewise, oxidative stress from intrinsically-produced ROS or exposure to oxidative stress by external ROS (Ex: exogenous H2O2) can also trigger cellular senescence.   In these cases, the cause for the cellular senescence appears to be DNA damage.  Double stranded DNA breaks (DSBs) appear to be the most closely associated with cellular senescence, regardless of whether the DSBs were induced by ionizing radiation (X-rays, UV light, etc.), DNA damaging drugs (chemotherapy), or oxidative stress (endogenously generated or exogenously applied).

A key factor in cellular senescence is the increased expression of two proteins that trigger cellular senescence, p16INK4a and ARF. These two proteins are actually part of the same gene (i.e. they share exons) but because they are encoded in different reading frames, they have different amino acid sequences and different functions. As a result of this “shared gene”,  they are often referred to as the “INK4a/ARF locus”. p16INK4a is an inhibitor of the cyclin-dependent kinases CDK4 and CDK6.  ARF regulates p53 stability through inactivation of the p53-degrading ubiquitin ligase, MDM2.  In young cells and young organisms, the INK4a/ARF locus is epigenetically repressed by Polycomb proteins, but in old age, the INK4a/ARF locus is “derepressed”, the gene is transcribed, and production of these two proteins increases by as much as 42-fold in different organs in older mice (Krishnamurthy, Ink4a/Arf expression is a biomarker of aging 2004). In this context, the activities of SIRT1 listed above  (Numbers 2, 3, and 4) mitigate against cell senescence by repressing p16INK4a/ARF or its effects. 

Interestingly, calorie restriction retards the increase in INK4a/ARF protein accumulation in all organs, reducing the age-associated increase in INK4a/ARF proteins by 2 and 16-fold. (Also Krishnamurthy, Ink4a/Arf expression is a biomarker of aging 2004).   Although the loss of Polycomb protein repression is a major reason for the increase in INK4a/ARF proteins, decline of SIRT1 expression plays a major role here as well.   For instance, glucose restriction (GR) has been found to increase SIRT1 mRNA levels and SIRT1 protein levels within cells and to inhibit p16INK4a/ARF expression. As a result, cellular lifespan was found to be dramatically increased (by 4 weeks) in normal cells with GR, whereas the same glucose restriction increased apoptosis (18%) in immortalized cells causing them to die (Li, Tollefsbol, Glucose restriction can extend normal cell lifespan and impair precancerous cell growth through epigenetic control ofhTERT and p16 expression 2010)(Li, Tollefsbol, p16INK4a Suppression by Glucose Restriction Contributes to Human Cellular Lifespan Extension through SIRT1-Mediated Epigenetic and Genetic Mechanisms 2011).  When the molecular mechanisms were studied on the role of GR in repressing p16INK4a/ARF expression, several mechanisms were found to play a role as follows:

1. Promoter site DNA (CpG) methylation

Glucose restriction induced hypermethylation of the p16INK4a/ARF promoter, which then prevents binding of the E2F-1 transcription factor.  This results in down-regulation of the p16INK4a/ARF locus, preventing cell apoptosis and cellular senescence, which leads to increased cell lifespan. (Li, et.al. as above, 2010).  Recently, other researchers have shown that SIRT1 can deacetylate DNA methyltransferase 1(DNMT1) and that compared to other HDACs, SIRT1 is the most robust deacetylator of DNMT1 (Peng, SIRT1 Deacetylates the DNA Methyltransferase 1 (DNMT1) Protein and Alters Its Activities  2011). “In summary, we show that DNMT1 is acetylated at multiple lysines and that SIRT1 deacetylates DNMT1 in vitro and in vivo. Deacetylation of DNMT1 at specific lysines enhanced its methyltransferase activity, changed its transcription repression activity and cell cycle regulatory function, and impaired its capacity to silence TSGs. In contrast to class I HDACs, which boost the silencing effect of DNMT1 by chromatin modification or stabilization of DNMT1 (5981), SIRT1 directly modifies DNMT1 activity.”

The same authors showed that nicotinamide, an inhibitor of SIRT1, reduced DNA promotor methylation by DNMT1. Since the main role of DNMT1 is to maintain CpG methylation (as opposed to de novo methylation),  Thus it is likely that SIRT1 plays a role in maintaining DNA promoter site (CpG) methylation of the p16 promoter, although this mechanism not yet been specifically proven for the INK4a/ARF locus.  Again, the key point of interest here is that supporting methylation and therefore inactivation of ther p16 promoter site is a likely action of SIRT1 for countering age-related cell senescence.

  1. Promoter site Histone deacetylation

The best way to understand the role of SIRT1 in cellular senescence is to understand the molecular mechanisms of how  Sirtuin enzymes work. Although Sirtuins do have other molecular functions, their primary job is to remove acetyl groups from lysine amino acids on proteins. In the nucleus, SIRT1 removes acetyl groups (i.e. deacetylation) from many proteins, but the major target of SIRT1 are histone proteins (H1, H3, and H4). Histone proteins make up the “spools” (called nucleosomes) which DNA is wound around.  When the spools are tightly compacted together, genes cannot be transcribed from the DNA wound around the nucleosomes. This chromatin compacted state is called “heterochromatin”. When the nucleosomes are spread out and not compacted, genes can be transcribed from the DNA and this chromatin state is called “euchromatin”. SIRT1 plays a major role in determining if chromatin is in the heterochromatin vs the euchromatin state. Specifically, SIRT1 rmoves an acetyl group from histone subunit 1 (abbreviated as H1K24). When this occurs, the chromatin remains in the euchromatin state and can be transcribed.  When there is a nuclear deficiency of NAD+, H1K24 becomes acetylated and chromatin compaction (heterochromatin) occurs.  The formation of heterochromatin is a hallmark of cellular senescence and aging. This is illustrated in the diagram below.  On a molecular level, there is no clearer “upstream explanation for aging” than this diagramt, illustrating what happens in young cells when NAD+ levels are high (SIRT1 activation) and what happens in old age when nicotinamide levels are high (SIRT1 inhibition). The 4 main SIRT1 anti-aging effects involve protein deacetylation in the nucleus:

1) deacetylation of the histone linker protein, H1;

2) deacetylation of the  tumor suppressor, p53;

3) deacetylation of histone H4 at lysine 16 and

4) deacetylation of histone H3 at lysine 9.

When H1 is deacetylated, chromatin is relaxed and gene expression occurs (euchromatin). If p53 is deacetylated, it cell survival occurs and cell cycle arrest does not occur (i.e. senescence).  When H4K16 is deacetylated, genes can be silenced.  With low levels of nuclear NAD+,

Image may be NSFW.
Clik here to view.
NAD+11

Image and legend source: Sirtuins: critical regulators at the crossroads between cancer and agingSIRT1 expression and activity decrease during aging. High levels of SIRT1 protein in young cells in combination with high levels of nicotinamide adenine dinucleotide lead to deacetylation of p53 and histone proteins to promote longevity (left panel). SIRT1 levels are lower in aged cells, and higher levels of nicotinamide inhibit SIRT1 activity (right panel). The resulting hyperacetylation of p53 can induce replicative senescence. Deacetylation of histone H1 leads to its degradation that promotes formation of senescence-associated heterochromatic foci (SAHFs). Failure to downregulate SIRT1 during aging may promote cell survival after oxidative damage, leading to the accumulation of mutations, and an increased risk of cancer development.”

When there is inadequate SIRT1, H1K24 gets acetylated and the chromatin becomes compacted, forming “senescence associated heterochromatin” (SAH). SAH is a major cellular marker of aging. Thus the loss of SIRT1 H1K24 deacetylation directly causes this aspect of aging. However, if SIRT1 H2K24 deacetylation activity is maintained in old age, then SIRT1 becomes a “longevity protein”.  Unfortunately, with aging, there is a nuclear deficiency of NAD+.  As a result, SIRT1 cannot deacetylate H1K24 and senescent cells accumulate.

Note a point of clarification here on the different contexts for and meanings of deacetylation. The specific histone H1 relates to links between spindles of DNA,  Keeping it deacetylated via SIRT1 results in uncompacted chromatin which facilitates ready gene expression.  When it comes to histones H3 and H4, acetylation has the opposite effect; it locally uncompacts the chromatin and allows ready gene expression.  And deacetylation inhibits gene expression in these cases,  So, H3 and H4 deacetylation is very useful for silencing pro-aging genes such as senescence-associated ones.

Major SIRT1 Functions #2: Gene silencing  – H3K9 and H4K16 deacetylation in the nucleus

Two histone proteins that are deacetylated by SIRT1 are histone subunit 3 (H3) and subunit 4 (H4) . SIRT1 removes an acetyl group from a specific lysine (K9) on H3 and a specific lysine (K16) on H4.  H3K9 is a “site-specific” deacetylase target of SIRT1 and SIRT6, whereas  H4K16 is a “site-specific” deacetylase target of only SIRT1.  Both H3K9 and H4K16 deacetylation of histones have the effect of silencing genes as mentioned above.  See the discussion and the diagrams in the blog entry  Slaying Two Dragons with the Sound of Silence: – How to Keep Your Repetitive DNA Turned Off with “3 Songs”: Sirtuins, Polycomb Proteins, and DNMT3.

The major (non-histone) “longevity mechanism” is the effect of SIRT1 on p53, also shown below.

Image may be NSFW.
Clik here to view.
NAD+12

In the diagram above, SIRT1 deacetyates the p53 protein thereby reducing its transcriptional activity.  p53 is the master “guardian of the genome”, and serves as a tumor suppressor to prevent cancer formation by shutting off the cell cycle in damaged cells. So, turning it off in cancer cells is not a good idea.  p53 also increases cell survival in non-cancerous cells and also activates apoptosis when the cells are old or too damaged to repair.

From the 2012 publication Current advances in the synthesis and antitumoral activity of SIRT1-2 inhibitors by modulation of p53 and pro-apoptotic proteins” — As sirtuins are involved in many physiological and pathological processes, their activity has been associated with different human diseases, including cancer. Especially two sirtuin members, SIRT1 and SIRT2, have been found to antagonize p53-dependent transcriptional activation and apoptosis in response to DNA damage by catalyzing p53 deacetylation. The findings that SIRT1 levels are increased in a number of tumors highlight the oncogenic role of sirtuins, in particular, in the down-modulation of p53 oncosuppressor activity. Along this lane, cancers carrying wild-type (wt) p53 protein are known to deregulate its activity by other mechanisms. Therefore, inhibition of SIRT1 and SIRT2, aimed at restoring wt-p53 transcriptional activity in tumors that retain the ability to express normal p53, might represent a valid therapeutic cancer approach specially when combined with standard therapies.”

In addition, SIRT1 deacetylates a specific site on the histone 4 subunit of the nucleosomes, which are the spools on which DNA is wound.  When SIRT1 deacetylates lysine at position 16 on the histone 4 protein (H4K16), this silences the gene on the DNA wound around this histone.  Thus SIRT1 has multiple effects all due to its ability to remove acetyl groups from proteins.  These are all dependent on the nuclear levels of NAD+ within the cell.

Image and legend source: Sirtuins: critical regulators at the crossroads between cancer and aging SIRT1 expression and activity decrease during aging. High levels of SIRT1 protein in young cells in combination with high levels of nicotinamide adenine dinucleotide lead to deacetylation of p53 and histone proteins to promote longevity (left panel). SIRT1 levels are lower in aged cells, and higher levels of nicotinamide inhibit SIRT1 activity (right panel). The resulting hyperacetylation of p53 can induce replicative senescence. Deacetylation of histone H1 leads to its degradation that promotes formation of senescence-associated heterochromatic foci (SAHFs). Failure to downregulate SIRT1 during aging may promote cell survival after oxidative damage, leading to the accumulation of mutations, and an increased risk of cancer development.”

Major SIRT1 Functions – #3: Circadian Clock Control – keeping the clocks in every cell regulated

We discussed the role of SIRT1 in controlling circadian clocks in the Part 1 blog entry,  Also, you can see the blog entries Circadian Regulation,NMN, Preventing Diabetes, and Longevity  and Shedding new light on circadian rhythms.   Pathways involved are illustrated in this diagram:

Image may be NSFW.
Clik here to view.
NAD+13

Image source: Circadian integration of metabolism and energetics

Major SIRT1 Functions – #4 : Reducing Inflammationinhibition of both glucose and fatty acid-induced inflammation.

Inflammation and aging seem to go hand-in-hand, a process that has been referred to as “inflammaging”.  Caloric restriction can reverse a significant amount of this inflammaging as a result of both the reduction in insulin/IGF-1 pathway signaling and also via a reduction in free fatty acid-induced inflammation.  Sirtuin activation associated with CR has been shown to have a major role in CR as a molecular mediator of this effect on inflammaging.  Here are some of the ways this occurs:

SIRT1 and Glucose-mediated inflammaging Insulin resistance is the hallmark of this pathway of inflammaging.

SIRT1 improves insulin sensitivity in insulin resistant states by inhibiting protein tyrosine phosphatase 1B (PTP1B), which is a direct intracellular inhibitor of insulin action (This effect is only seen in insulin resistant states, however, and not in insulin sensitive states).  In addition, SIRT1 increases the circulating plasma hormone that is made in fat, called adiponectin, which increases insulin sensitivity.  Adiponectin also directly inhibits TNF-α and the conversion  of macrophages to foam cells.  This reduces adhesion molecules and the number of macrophages attached to endothelial cells.  These SIRT1-induced effects reduce the atherosclerotic effects of insulin, high sugar diet, and high fat diets.

Probably the greatest positive effect of SIRT1 on inflammaging is by its inhibition of NF-kβ signaling. Normally, insulin signaling increases inflammation via Akt-mediated activation of the “master inflammatory switch”, NF-kβ, a transcription factor that turns on all of the major inflammatory genes. However, when SIRT1 activity is increased, SIRT1 deacetylates NF-kβ and this inactivates the transcription factor.  As a result, all of the NF-kβ controlled inflammatory genes show less expression, including TNF-α, IL-6, C-reactive protein, and the cJun N-terminal Kinase (JNK) transcription factor. The diagram below illustrates this well:

Image may be NSFW.
Clik here to view.
NAD+14

Image and legend source:  Sirtuins in neurodegenerative diseases: an update on potential mechanisms  ” Anti-inflammatory mechanisms of SIRT1. SIRT1 deacetylates p65 and blocks the transactivation of NF-κB-dependent gene expression. SIRT1 suppresses the activity of PARP-1, a coactivator of NF-κB-dependent transcription, by deacetylation and by inhibiting its expression. PARP-1 activation could deplete NAD+, resulting in inhibition of SIRT1 and NF-κB activation. On the epigenetic level, SIRT1 represses NF-κB-dependent inflammatory gene expression by deacetylating H4K16 and also by recruiting more components of repressor complexes. SIRT1 deacetylates and activates histone methyltransferase SUV39H1, which suppresses expression of inducible inflammatory genes. DNA methylation is associated with suppressed expression.”

In summary, SIRT1 has a net anti-inflammatory effect in glucose-mediated inflammaging and increases insulin sensitivity in insulin-resistant conditions, but not in baseline conditions of insulin-sensitive states.

SIRT1 and Fatty acid-mediated inflammagingHigh fat diets have also been shown to induce inflammaging. Here the pro-inflammatory effects are independent from insulin and are mediated by intracellular free fatty acid overload within cells.  These high free fatty acid levels inhibit the forkhead transcription factor, FOXO1. As a result of FOXO1 inhibition, there is an increase in ROS, IL-6, PAI-1, and MCP-1 gene expression.  SIRT1 increases adiponectin levels which in turn, activates FOXO1 activity and increases the interaction between FOXO1 and C/EBPβ transcription factors.  In summary, SIRT1 has a net anti-inflammatory effect in fatty-acid mediated inflammaging and this effect is mediated primarily by adiponectin and the FOXO1 transcription factor.

Conclusion: Restoring NAD+ levels to normal in the nucleus of cells should increase insulin sensitivity, increase adiponectin levels, and reduce inflammation induced by both a high glucose and high fat diet.  We predict that biomarkers for insulin sensitivity (fasting blood sugar, 2-hour glucose tolerance testing, fasting insulin, 2-hour insulin tolerance testing, HOMA2, HOMA-IR, and Glycomark tests will improve with increases of nuclear NAD+, but only in insulin resistant states.  We also predict that biomarkers for inflammation will decline with such nuclear NAD+ increases, especially adiponectin (increase), TNF-α (decrease), IL-1β (decrease), IL-6 (decrease), IL-8 (decrease), andC-reactive protein (decrease).  However, if these values are normal in baseline conditions in a person undertaking to increase their nuclear NAD+, no change in these numbers will be evident.

Major SIRT1 functions: #5 – DNA repairIt is a key enzyme in repairing double stranded DNA breaks (DSBs)

Homologous recombination is the highest-fidelity mechanism for repairing DSCs.  See UBI et al.  Role of SIRT1 in homologous recombination (2010) ” — Recent reports revealed that SIRT1 also deacetylates several DNA double-strand break (DSB) repair proteins. — Using nuclear foci analysis and fluorescence-based, chromosomal DSBrepair reporter, we find that SIRT1 activity promotes homologous recombination (HR) in human cells. Importantly, this effect is unrelated to functions of poly(ADP-ribose) polymerase 1 (PARP1), another NAD(+)-catabolic protein, and does not correlate with cell cycle changes or apoptosis.”   That is, the effect is independent of the PARP-related mechanism for repairing single-stranded breaks.

Major SIRT1 functions: #6 – deacetylation nonhistone proteins transcription factors, co-activators, co-repressors, methyl binding proteins, etc.

In addition to the effects of SIRT1 on histones, p53, and DNA repair, SIRT1 deacetylates many other proteins within the nucleus.  Most of these are transcription factors or co-activators which increase gene expression. They include the ones listed in this diagram:

Image may be NSFW.
Clik here to view.
NAD+15

Image and legend source: Mammalian Sirtuins and Energy Metabolism  “ The diverse functions of SIRT1 in central nutrient sensing and peripheral energy metabolism. The activity of SIRT1 is regulated by the cellular metabolic status, small molecule activators, interacting proteins, as well as post-translational modifications. After activation, SIRT1 modulates a variety of metabolic activities systemically and locally through either direct protein deacetylation or indirect chromatin remodeling.”

Following is a list of the non-histone protein targets of SIRT1 shown above, along with several other CR proteins not shown in the diagram.  SIRT1 deacetylates over a dozen non-histone proteins, including p53, HSF1, eNOS, STAT3, FOXOs, PGC-1a, PPARγ, LXR, NF-kB, PER2, CLOCK, UCP2, MyoD.   Other effects of SIRT1 are paradoxic are the effects of SIRT1 on FOXA2, LKB1, and Nrf2 (E2F1).

p53Ac – The most important non-histone target of SIRT1 is the protein called p53 already mentioned here. Both SIRT1 and SIRT2 deacetylate p53 and thereby increase cell survival.  SIRT1 deacetylates lysine 382 (K382) on the SIRT1 protein. On the other hand, inhibiting both SIRT1 and SIRT2 (but not one of these two SIRTs) induces cell death in both cancer cells and non-cancer cells. Thus p53 has often been referred to as the “master tumor suppressor” or the “guardian of the genome”.  Regardless of the terminology describing p53, it is clear that both SIRT1 and SIRT2 deacetylate p53 and promote cellular survival.  This is one of the most important functions of SIRT1/2 and is a fundamental reason why Sirtuins probably promote longevity (Peck, SIRT Inhibitors Induce Cell Death and p53 Acetylation through Targeting Both SIRT1 and SIRT2  2010).

HSF1Ac – Heat shock factor 1 is a thermally sensitive protein that trimerizes migrates into the nucleus in response to heat stress or oxidative stress.

LXRAcCaloric restriction has a positive effect on lowering cholesterol.  This is due to the fact that SIRT1 deacetylates the nuclear           receptor liver X receptor (LXR) protein

FXRAc - The farnesoid X receptor regulates the expression of a number of its target genes(ref).

eNOSAc – Reduced caloric intake decreases arterial blood pressures in healthy individuals and improves endothelium-dependent vasodilation in obese individuals.  Endothelial nitric oxide synthetase (eNOS) is an enzyme that makes nitric oxide from L-arginine, relaxes blood vessels and thereby lowers blood pressure with CR. L-arginine is a popular “anti-aging” supplement that is marketed as a “CR mimetic”, but has failed to lengthen life span or increase health span.  The likely reason for the “arginine failure” is that SIRT1 is needed to remove the “acetyl group” from lysines 496 (K496) and 506 (K506) from eNOS.   This can only be accomplished by activating SIRT1 with CR or fasting.  However, with old age, there is inadequate NAD+ to drive SIRT1 deacetylation.  It is for this reason that we predict that NAD+ or NAD+ precursors like NMN will lower blood pressure in healthy individuals and improve flow-mediated dilation (FMD) in both healthy and obese individuals.

FMD (flow-mediated dilation) can easily be measured with clinically validated testing devices such as the EndoPAT or the VENDYS systems, which use a brachial blood pressure cuff and finger sensors which measure reactive hyperemia index (EndoPAT) or finger temperature warming (VENDYS).  Both systems are clinically validated as non-invasive measurements of eNOS activity.

FOXAAc – The FOXA symbol in the diagram above is an upstream event that activates Glucagon signaling and inhibits Insulin signaling.  Reduced caloric intake reduces insulin levels yet increases insulin sensitivity, increases glucagon production, and improves pancreatic β-cell function via the forkhead transcription factor called FOXA2.  FOXA transcription factors play a key role in gene regulation of genes involved with glucose metabolism by binding to promoter regions on these genes with SIRT1. When nutrients are scare or when cells are starved, FOXOA2 can be acetylated in at least 7 different lysine residues. This increases FOXOA2 protein stability.  SIRT1deacetylates these lysine residues in times of CR or starvation.  NAD+ depletion disrupts this SIRT1-mediated stress response and results in excessive accumulation of FOXOA2 proteins. Restoring nuclear NAD+ levels should restore the normal interaction between FOXOA2 and SIRT1.  This could be measured with oral glucose tolerance testing (OGTT), insulin tolerance testing (ITT), fasting blood glucose and fasting insulin, as well as HbA1c and Glycomark testing.

FOXOAc – Caloric restriction, fasting, and reducing Insulin/IGF-1 pathway signaling all promote the nuclear localization of the Forkhead homeobox type O transcription factors (FOXOs).  FOXOs play a major role in cellular stress resistance by turning on genes that code for anti-oxidant enzymes, such as MnSOD (SOD2) and catalase.  FOXOs also control genes for apoptosis. Unfortunately, none of these benefits occur unless blood sugar levels are low and insulin/IGF-1 signaling is low.  In these conditions, the FOXOs can all migrate into the cell nucleus and turn on many genes responsible for cellular stress resistance.  Both SIRT1 and SIRT2 deacetylate FOXO transcription factors and thereby activate the FOXOs. For instance, SIRT1             deacetylates FOXO1 which then increases gluconeogenesis in the liver. SIRT2 deacetylates FOXO3a and also promotes hepatic gluconeogenesis.

We predict that restoring nuclear NAD+ levels with NAD+ precursor therapy will increase cellular stress resistance and this could be measured by stem cell survival with stem cell harvesting, stem cell transplantation, and stem cell banking (protection from freeze/thawing induced apoptosis).  This could be easily measured in the laboratory by culturing stem cells under conditions of cellular stress. 

LKB1AcLiver kinase B1 (LKB1) is an enzyme that mediates much of the effect of mitochondrial biogenesis with CR or fasting. This occurs due to the fact that LKB1 is a direct activator of AMPK, the master regulator of metabolism and mitochondrial biogenesis.  Recently, it has been disclosed that LKB1 also functions as a tumor suppressor by maintaining epithelial integrity. In tumors where LKB1 is mutated, cells loose an orderly epithelial configuration and the cancers start to grow rapidly  LKB1 must be deacetylated by SIRT1 for proper tumor suppression and for AMPK activation. SIRT1 deacetylates lysine 48 (K48) on LKB1 and causes the LKB1 to leave the nucleus and go to the cytoplasm where it can associated with the adaptor protein STE20, activating itself and AMPK.

Thus, SIRT1 deacetylation of LKB1 induces LKB1 and AMPK activity in the cytoplasm. (Ruderman, SIRT1 Modulation of the Acetylation Status, Cytosolic Localization, and Activity of LKB1 2008). Both of these effects promote longevity and increase energy. For this reason, we predict that restoring nuclear NAD+ levels will have a direct effect on reducing age-induced fatigue.  This could be measured with a VO2 max measuring device and endurance testing.  We also predict that restoring nuclear NAD+ levels will re-organize skin cells that have lost their epithelial polarity, restoring better looking skin and improving skin histologic architecture on light microscopy.

MyoDAcMyoD is a key transcription factor in skeletal muscle differentiation.

STAT3Ac – Skeletal muscle insulin resistance is a key component of the underlying cause of type II diabetes. Fasting and CR both can increase whole body insulin sensitivity, even when practice for brief periods of time (4-20 days). Although there are multiple ways that CR changes Insulin/IGF-1 signaling, the primary method by which CR promotes insulin sensitivity appears to be via the (inhibition of )  STAT3.  SIRT1 deacetylates STAT3, which inactivates the transcription factor. This reduces gene expression for two subunits of the enzyme PI3K (p55a/p50a). This results in more efficient PI3K signaling with insulin stimulation.  In summary, SIRT1 inhibits STAT3 which inhibits gene expression for PI3K subunits, thereby increasing energy expenditure.

IRS1/IRS2AcCR has a paradoxic effect on insulin receptor substrate 1 and 2 (IRS1/IRS2) gene expression. IRS1 and IRS2 are the first proteins in the molecular cascade of events that occurs when Insulin binds to the Insulin/IGF receptor on the cell.  With CR, however, there is an increase in protein expression of IRS1/IRS2 in muscle, which in turn increases intracellular signaling for the Insulin/IGF-1 pathway.  SIRT1 deacetylates IRS1/IRS2, thereby “turning off” this pro-aging pathway.

Nrf2Ac (E2F1) – Sirtuins have a paradoxic effect on the transcription factor called Nuclear factor Erythroid 2-related factor 2 (Nrf2 or E2F1). Normally, cellular stress activates the nuclear localization of Nrf2 which then in turn activates gene transcription by binding to the antioxidant response element (ARE) found in the promoter sites of these genes. This can occur due to direct effect of ROS on Nrf2 binding to its binding partner, Keap-1. It can also occur by the acetylation of Nrf2 by p300/CBP (aka CREB-binding protein). Paradoxically, both SIRT1 and SIRT2 can deacetylate Nrf2, SIRT1 deacetylates at two specific  lysine residues (K588 and K591) which promotes cytoplasmic localization of the Nrf2 protein and prevents nuclear localization of Nrf2. As a result, SIRT1 actually is an inhibitor of Nrf2  antioxidant gene transcription. This is one of the paradoxic effects of SIRT1 and CR on Nrf2 (Kawai, Acetylation-Deacetylation of the Transcription Factor Nrf2 (Nuclear Factor Erythroid 2-related Factor 2) Regulates Its Transcriptional Activity and Nucleocytoplasmic Localization 2010).

Another paradoxic effect is the effect of SIRT2 on Nrf2.  SIRT2 also deacetylates Nrf2 and therefore can decrease Nrf2 gene expression.  One of these genes is the major cellular iron exporters called FPN1.  Nrf2 activates FPN1 gene expression and SIRT2 inhibits FPN1 gene expression (Yang,  Sirtuin 2 mediated-deacetylation regulates cellular iron homeostasis

2014).  Thus SIRT2 controls regulates iron levels within the cell, decreasing iron export by FPN1, by deacetylating Nrf2.

p66shc – The adaptor protein p66shc is a major “pro-aging” factor within the cell.  When growth factor signaling or ROS activates p66shc, the protein is phosphorylated on Serine (S).  This promotes mitochondrial migration of p66shc into the mitochondrial matrix where it increases ROS production from mitochondria. SIRT1 decreases p66shc activity by decreasing both p66shc mRNA and p66shc protein levels.  The molecular mechanism responsible for SIRT1 repression of p66shc gene expression is thought to be mediated by the epigenetic silencing of the p66shc gene by SIRT1-mediated histone deaetylation. Thus SIRT1 is a negative          regulator of ROS production by epigenetically repressing p66shc gene expression (Xu, Salvianolic acid A preconditioning confers protection against concanavalin A-induced liver injury through SIRT1-mediated repression of p66shc in mice 2013) (Paneni, Molecular pathways of arterial aging 2015).

PGC-1αAc – Peroxisome proliferator activated receptor PPAR-γ co-activator-1α (PGC-1 α) is a master gene co-activator that works with over a dozen different transcription factors to turn on hundreds of genes involving peroxisome and mitochondrial biogenesis.  Thus, PGC-1α turns on all of the genes involving making and burning of fat, producing of ketones, making ATP, and generating energy.  SIRT1 also promotes gluconeogenesis in the liver by deacetylating PGC-1α (along with deacetylating FOXO1).  Earlier blog entries discussing PGC-1 α can be found in this list,

PPARγ – Caloric restriction also activates the master transcription factor for the production of peroxisomes, called peroxisome proliferator activator receptor gamma (PPARγ). PPARγ induces long chain fatty acid oxidation, which is the first step required before fats can be oxidized in the mitochondria by beta-fatty acid oxidation.  SIRT1 deacetylates PPARγ and then recruits a coactivator for PPARγ called Prdm16.  Then the PPARγ/Prdm16 complex can activate the genes required to make brown fat.  You can see the blog entry Getting skinny from brown fat,

NF-kβ – Nuclear factor kappa-β is a transcription factor that is the “master switch” for inflammation. SIRT1 deacetylates NF- kβ at the p65 subunit of NF-kB at lysine 310.  This “turns off” gene expression for all of the genes involving inflammation, such as CRP, TNF- α, IL-1β, etc.  Since arthritis is a universal feature of aging and all of these inflammatory biomarkers are elevated in joints with OA, we predict that restoring nuclear NAD+ with NAD+ precursor therapy will reduce the signs and symptoms of OA.  This could be measured with various validated clinical scoring systems, such as the K-L scoring system based on plain, X-rays with weight bearing, the WOMAC scale, the IKDC scale, etc.  All of these should improve with NMN or other NAD+ enhancing therapy.

Fine Tuning of SIRT1 Protein Activity

Endogeneous Activators and Inhibitors of SirtuinsNAD+, NAM, AROS, lamin A, Tenovins, DBC1/CCAR2, CD38,  HIC1, Cathepsin D

Alas, in biology for any generalization there is too often one or more “An the other hands, —.”  We have discussed SIRT1expression here as if it were mainly driven by NAD+ level.   Actually, it is affected both positively and negatively by many interacting variables. SIRT1 activity is increased by increasing nuclear NAD+, by fasting, and by caloric restriction. Most of these positive effects on SIRT1 are mediated by increases in nuclear NAD+ levels. SIRT1 activity is also inhibited by nicotinamide. This may be why niacin supplementation has not been shown to have a longevity effect, since it is converted into nicotinamide within the cell.  In addition to activating SIRT1 with NAD+, there are naturally derived exogenous compounds such as reseveratrol and other plant-based compounds that bind to a different site on SIRT1, increasing it’s activity independently from NAD+. There are also several exogenous small molecule inhibitors of SIRT1, such as Tenovin-1 and Tenovin-6 which prevent the deacetylase activity of SIRT1. There are also endogenous proteins that bind directly to SIRT1 and increase or decrease the activity of SIRT1, such as AROS, lamin A, and DBC1.  AROS is a protein that binds to SIRT1 and increases its activity.  DBC1 (aka CCAR2) is a protein that binds to SIRT1 and inhibits SIRT1.  We discussed these two in the Part 1 blog entry.  HIC1 is a protein that binds to the SIRT1 promoter and increase SIRT1 gene expression. Another recently discovered protein that binds to SIRT1 is lamin A, a nuclear cytoskeletal protein that binds to SIRT1 and activates the protein.  Another endogenous inhibitor of SIRT1 is the enzyme CD38. Although initial reports labeled CD38 as an “ectoenzyme”, several reports have shown that the CD38 protein is found on the inner membrane of the nucleus of the cell. Aksoy and colleagues have  shown that CD38 is an SIRT1 inhibitor (Aksoy, Regulation of SIRT 1 mediated NAD dependent deacetylation: A novel role for the multifunctional enzyme CD38  2006).

In inflammatory joint diseases such as osteoarthritis and rheumatoid arthritis, there is another endogenous disruptor of SIRT1 – Cathepsin B.  Normally SIRT1 has a positive effect within the joint, inhibiting chondrocyte apoptosis and promoting extracellular matrix synthesis of proteins such as alpha2(I) collagen. However, when there are high levels of TNF-a within the joint, TNF-a mediates a Cathepsin-B induced cleavage of the SIRT protein at amino acid 533, creating a 75-kd SIRT1 fragment that is no longer functional.  As a result, there are low levels of SIRT1 activity within the chondrocytes and synovial cells of arthritic joints.

Some of these activators and inhibitors of SIRT1 activity are illustrated below:

Image may be NSFW.
Clik here to view.
NAD+16

Image source: How does SIRT1 affect metabolism, senescence and cancer?

DBC1 (aka CCAR2) is one of the primary inhibitors of  SIRT1 within the nucleus and it is activated by DNA damage (genotoxic stress).  Fasting also inhibits the interaction of DBC1 and SIRT1.  This may be a NAD+-independent molecular mechanism for how fasting increases SIRT1 activity.  Likewise, a high fat diet activates SIRT1 binding to DBC1. This may be an NAD+-independent effect of a high-fat diet inhibiting Sirtuins.

Image may be NSFW.
Clik here to view.
NAD+17

SIRT1 PhosphorylationSIRT1 phosphorylation can increase or decrease SIRT1 activity and SIRT1 half life

In addition to the above factors, SIRT1 is modified  by at least 7 enzymes that phosphorylate SIRT1 at 13 “site-specific” locations on the SIRT1 protein. These enzymes phosphorylate different sites, and thereby either inactivate SIRT1 (AMPK),  activate SIRT1 (cAMP/PKA, Cyclin B/Cdk1, CK2, JNK1, DYRKs) or increase the half life of the SIRT1 protein (JNK2). For instance AMPK phosphorylates SIRT1 at Thr344, which inactivates the p53 deacetylase function of SIRT1.  On the other hand, DYRKs (Dual specificity tyrosine phosphorylation-regulated kinases) phosphorylate SIRT1 at Thr522 in response to environmental stress. This DYRK-mediated phosphorylation prevents SIRT1 from forming oligomeric aggregates of SIRT1 proteins. As a result, the Thr522 phosphorylated SIRT1 forms only monomers and thereby becomes a more active deacetylator of p53. Thus SIRT1 phosphorylation by AMPK and DYRKs have opposite effects on SIRT1 deacetylation of p53. Two phosphorylation sites on SIRT1 help regulate the cell cycle. Specifically, the CyclinB/Cdk1 complex phosphorylates SIRT1 at Thr530 and Ser540.  Thus CyclinB/Cdk1 phosphorylation of SIRT1 increases cell proliferation.  This is why SIRT1 is so important for cell growth and is present in high levels in mitotically active cells. Even the two cJun N-terminal kinases, JNK1 and JNK2, have different phosphorylation sites on SIRT1 and different effects. For instance, JNK1-mediated phosphorylation of the Ser47 residue on SIRT1 increases the histone 3 (H3) deacetylase activity of SIRT1, whereas JNK2-mediated phosphorylation of the Ser27 residue of SIRT1 increase the half life of the SIRT1 protein from 2 hours to 9 hours. Thus each of these different “SIRT1 phosphorylators” add a phosphate group at specific sites on SIRT1. This increase specific activities of SIRT1 and these effects are independent of NAD+ levels within the cell. Last of all, UV light and free radicals such as hydrogen peroxide (H2O2) inactivates SIRT1 by another protein called SENP. SENP inactivates SIRT1 by removing a sumoyl group from the SIRT1 protein.  Here are some diagrams that illustrates how “SIRT1 phosphorylators” activate SIRT1 activity and how de-sumoylation of SIRT1 inhibits SIRT1.

De-SUMOylating SIRT1

UV light or H2O2 inactivate SIRT1 via a UV/ROS sensitive protein called SENP.  SENP removes a SUMO group from SIRT1, thereby inactivating the protein.

Image may be NSFW.
Clik here to view.
NAD+21

ROS activation of SIRT1

Free radicals such as H2O2 or superoxide can activate the SIRT1 protein via a protein kinase called c-Jun Kinase (JNK), increasing the ability of SIRT1 to deacetylate histone proteins such as H3.

Image may be NSFW.
Clik here to view.
NAD+19

SIRT1 and Cell Survival

DYRKs are enzymes that are activated by  ROS  or (environmental stress) or DNA damage. DYRKs activate SIRT1-mediated deacetylation of p53, thus increasing cell survival in stressful times.

Image may be NSFW.
Clik here to view.
NAD+20

SIRT1 and the Cell Cycle

Two proteins involved with cell cycle regulation form a complex with SIRT1 and phosphorylate the SIRT1 protein.  This increases cell proliferation and is a key factor in allowing mitotic cells to keep dividing.

Image may be NSFW.
Clik here to view.
NAD+18

In summary, SIRT1 activity is dependent on NAD+ levels, nicotinamide levels, phosphorylation status, DBC-1 status, AROS status, ROS or other stressors, and the presence of exogenous SIRT1 activators (resveratrol) or inhibitors (Tenovins).

The over-all importance of Sirtuins, however, is their ability to affect gene expression in the nucleus. Changing gene expression is is considered an “upstream event” in aging.  In this aspect, SIRT1 is not the only Sirtuin in the nucleus of the cell.  There are two others that we will discuss now – SIRT6 and SIRT7.

SIRT6 – The Master DNA Repair and Genomic Stability Sirtuin

The effects of SIRT6 on Genome Stability

Another Sirtuin family member that directly affects gene expression is SIRT6.  SIRT6 is also found in the nucleus and is also an NAD+-dependent enzyme.  Like SIRT1, SIRT6 plays a vital role in both single strand DNA breaks (SSBs) and double stranded DNA breaks (DSBs). With DSBs, SIRT6 is one of the earliest factors that is recruited to the site of the DSB. This occurs within 5 seconds in a healthy cell. SIRT6 recruits the chromatin remodeler, SNF2H, to the site of the DSB and deacetylates histone 3 at lysine 56 (H3K56). This allows SNF2H to open up the chromatin at the DSB site, which then allows the DNA DSB repair proteins to be recruited (BRCA1, 53BP1, and RPA).  This is shown in the diagram below.

SIRT6 – The Early Responder to DSBs

Double stranded DNA breaks are the most lethal DNA damage type and are primarily responsible for cancer and aging.  Of the seven SIRTs, the SIRT6 isoform probably plays the greatest role in DNA repair.  In the diagram that follows, a double stranded DNA break occurs and within 5 sec, SIRT6 shows up to deacetylate H3K56. This recruits the chromatin remodeler, SNF2H, which then “opens up” the chromatin, allowing the key DNA repair proteins to bind to the site of injury. The key DNA repair proteins include 53BP1, RPA, BRCA1, and CtIP (not shown). Collectively, these proteins repair double-strand DNA breaks by the more accurate repair program called “homologous recombination”, or HR.  The other DNA DSB break repair pathway, NHEJ, is not as accurate a repair pathway as the HR pathway, which is the pathway shown in the diagram.

Image may be NSFW.
Clik here to view.
NAD+22

Image and highlights source SIRT6 Recruits SNF2H to DNA Break Sites, Preventing Genomic Instability through Chromatin Remodeling  “Highlights: •SIRT6 arrives to DNA break sites within 5 s, •Lack of SIRT6 and SNF2H increases sensitivity to genotoxic damage, •SIRT6 directly recruits SNF2H, which in turn opens chromatin at break sites. •SIRT6 and SNF2H are necessary to recruit 53BP1, RPA, and BRCA1 to the damage sites”

With DSBs, SIRT6 plays crucial roles in both the nonhomologous end joining (NHEJ) pathway and the homologous recombination (HR) pathway.  With HR, SIRT6 deacetylates a key protein called CtIP which works with the BRCA1 protein to generate single stranded DNA (aka “DNA end resection”) at the site of the DSB. Unless CtIP and BRCA1 can form a single strand of DNA at the break site by “DNA end resection”, then the non-homologous end joining (NHEJ) method of DNA repair takes over, which does not repair DSBs nearly as accurate as HR.  In addition to the effects of SIRT6 on HR and NHER repair of DSBs,  SIRT6 activates PARP1 directly as well.  This increases DNA repair for single stranded DNA breaks (SSBs) by increasing base-excision repair (BER) pathway for SSBs and also increases double stranded DNA repair by both HR and NHEJ pathways.  All of these effects have a net effect of increasing genome stability within the cell.

Image may be NSFW.
Clik here to view.
NAD+23

Image and legend source: 2011 Repairing split ends: SIRT6, mono-ADP ribosylation and DNA repair  “SIRT6 regulates genomic stability. SIRT6 promotes genome stability by regulating DNA single-strand and double strand break repair pathways and by facilitating telomere maintenance. The deacetylase and the mono-ADP ribosyltransferase activities of SIRT6 both contribute to this function.”

Based on the three mechanisms illustrated above, SIRT6 plays a key role in both SSB and DSB repair.  As a result, when SIRT6 knock-out mice are created, they have an accelerated aging-like phenotype.

The Other Effects of SIRT6 besides Genome Stability

Other than genomic stability, the other primary effect of SIRT6 are mediated by histone protein modifications of specific lysines found on Histone 3 (H3K9 and H3K56).  Although SIRT1 has some histone protein deacetylase function, it has a much greater mono-ADP-ribosyltransferase activity and an even greater “deacylation” function. “Deacylation” refers to the removal of long chain fatty acids (palmitic acid, myristic acid, oleic acid, and linoleic acid) from lysine amino groups on proteins.  One of the SIRT6 targets for ADP-ribosylation is PARP1 (see above).  PARP1 is mono-ADP-ribosylated by SIRT6 which activates PARP1.  The “deacylation” function of SIRT6 was just recently discovered. Here is a diagram that shows the effects of SIRT6 deacetylase function and the effects of SIRT6 on CtIP which also occurs via its effects on gene expression in the nucleus of every cell.  (The mono-ADP-ribosyltransferase and deacylation function of SIRT6 are not shown in the diagram).

Image may be NSFW.
Clik here to view.
NAD+24

Illustration  and legend reference “SIRT6 is a critical regulator in genome stability, metabolism, and inflammatory response. By deacetylation of H3, SIRT6 regulates metabolic homeostasis and inflammatory response in peripheral tissues, while functioning as a central regulator of somatic growth.”

As you can see, most of the effects of SIRT6 are mediated by histone protein deacetylation of two specific lysine residues found on the histone 3 (H3) subunit of the histone “spools” that wind up DNA and compact it into the nucleus.  The H3 subunit has two specific lysine residues found on the tail of “H3” protein called H3K9 and H3K56.  When these two sites are deacetylated by SIRT6, this inhibits the type of metabolism seen in cancer cells called “Warburg metabolism” where the cells are totally dependent on sugar for generating energy and cannot burn fats.  Also, SIRT6 inhibits the inflammation caused by the major inflammatory “on switch” called NF-kB.  The other mechanisms of action of SIRT6 have not been fully elucidated, such as the effects of SIRT6 on growth hormone, IGF-1 and telomere stability.  What appears clear, however, is that all of the effects of SIRT1 and SIRT6 occur in the nucleus of the cell and all of the activity of both SIRT1 and SIRT6 are dependent on the availability of NAD+ in the nucleus of the cell.

The effects of SIRT7 within the cell, SIRT7 activators and SIRT7 inhibitors

                             Image may be NSFW.
Clik here to view.
NAD+25

                           Image may be NSFW.
Clik here to view.
NAD+26


Image source: A Big Step for SIRT7, One Giant Leap for Sirtuins… in Cancer

Outlier Research

Unfortunately, there are research results that challenge some of the basic assumptions of those who are looking for health creation through enhancing body NAD+ levels. And, they chellenge some of our predictions listed above.   For example there seems widespread agreement that:

  1. If you want to activate SIRT1, you must have adequate levels of nuclear NAD+.

2,  Having adequate levels of nuclear NAD+ is the best way to keep SIRT1 active.

  1. The impact of SIRT1 is universally health-producing.

Unfortunately, there appears to be research that suggest that these broad assertions ain’t always necessarily so.  We have above discussed how SIRT1 phosphorylation can increase or decrease SIRT1 activity and a number of proteins that bind to SIRT1 and increase or decrease its activity.  Cold is another example.

Cold can activate SIRT1 in a way that is completely independent of NAD+

You can use cold to activate SIRT1 and PGC1alpha regardless of your nuclear NAD+ status. The December 2011 article The cAMP/PKA Pathway Rapidly Activates SIRT1 to Promote Fatty Acid Oxidation Independently of Changes in NAD+ reports: “Highlights

  • Stimulation of the cAMP/PKA pathway results in phosphorylation of SIRT1 serine 434
  • SIRT1 S434 phosphorylation increases intrinsic deacetylase activity
  • SIRT1 activation by S434 phosphorylation is rapid and independent of changes in NAD+
  • S434 phosphorylation induces PGC-1α deacetylation and increased fatty acid oxidation”

“The NAD+-dependent deacetylase SIRT1 is an evolutionarily conserved metabolic sensor of the Sirtuin family that mediates homeostatic responses to certain physiological stresses such as nutrient restriction. Previous reports have implicated fluctuations in intracellular NAD+concentrations as the principal regulator of SIRT1 activity. However, here we have identified a cAMP-induced phosphorylation of a highly conserved serine (S434) located in the SIRT1 catalytic domain that rapidly enhanced intrinsic deacetylase activity independently of changes in NAD+ levels. Attenuation of SIRT1 expression or the use of a nonphosphorylatable SIRT1 mutant prevented cAMP-mediated stimulation of fatty acid oxidation and gene expression linked to this pathway. Overexpression of SIRT1 in mice significantly potentiated the increases in fatty acid oxidation and energy expenditure caused by either pharmacological β-adrenergic agonism or cold exposure. These studies support a mechanism of Sirtuin enzymatic control through the cAMP/PKA pathway with important implications for stress responses and maintenance of energy homeostasis.”

We have discussed cold as a simple and practical hormetic healh intervention in previous blog entries(ref)(ref)(ref)(ref).

SIRT1 turns off Nrf2 and its health-producing affects

We mentioned this above.  We have published several blog entries on the numerous impacts of activating Nrf2 which turns on hundreds of positive “antioxidant response genes.” See this list.  One of the last things we would expect to find is that SIRT1 which also produces numerous health benefits actually turns Nrf2 off. but that appears to be the case. It tends to keep Nrf2 in the cytoplasm rather than allowing it to migrate to the nucleus where it can do good.  Even worse, resveratrol, our favorite SIRT1 activator actually inhibits expression of Nrf2.

SIRT1 “turns off” Nrf2-mediated antioxidant gene expression?

The 2010 publication: Acetylation-Deacetylation of the Transcription Factor Nrf2 (Nuclear Factor Erythroid 2-related Factor 2) Regulates Its Transcriptional Activity and Nucleocytoplasmic Localization reports: “Activation of Nrf2 by covalent modifications that release it from its inhibitor protein Keap1 has been extensively documented. In contrast, covalent modifications that may regulate its action after its release from Keap1 have received little attention. Here we show that CREB-binding protein induced acetylation of Nrf2, increased binding of Nrf2 to its cognate response element in a target gene promoter, and increased Nrf2-dependent transcription from target gene promoters. Heterologous sirtuin 1 (SIRT1) decreased acetylation of Nrf2 as well as Nrf2-dependent gene transcription, and its effects were overridden by dominant negative SIRT1 (SIRT1-H355A). The SIRT1-selective inhibitors EX-527 and nicotinamide stimulated Nrf2-dependent gene transcription, whereas resveratrol, a putative activator of SIRT1, was inhibitory, mimicking the effect of SIRT1. Mutating lysine to alanine or to arginine at Lys588 and Lys591 of Nrf2 resulted in decreased Nrf2-dependent gene transcription and abrogated the transcription-activating effect of CREB-binding protein. Furthermore, SIRT1 had no effect on transcription induced by these mutants, indicating that these sites are acetylation sites. Microscope imaging of GFP-Nrf2 in HepG2 cells as well as immunoblotting for Nrf2 showed that acetylation conditions resulted in increased nuclear localization of Nrf2, whereas deacetylation conditions enhanced its cytoplasmic rather than its nuclear localization. We posit that Nrf2 in the nucleus undergoes acetylation, resulting in binding, with basic-region leucine zipper protein(s), to the antioxidant response element and consequently in gene transcription, whereas deacetylation disengages it from the antioxidant response element, thereby resulting in transcriptional termination and subsequently in its nuclear export.”

A brand new 2015-dated publication seems to say the direct opposite to the just-cited publication Polydatin promotes Nrf2-ARE anti-oxidative pathway through activating Sirt1 to resist AGEs-induced upregulation of fibronetin and transforming growth factor-β1 in rat glomerular messangial cells.  “Highlights:

  • PD increased Sirt1 levels, promoted Nrf2-ARE pathway activation, and reduced ROS levels in AGEs-treated GMCs. (PD is a resveratrol glycoside)
  • PD resisted AGEs-induced upregulation of FN and TGF-β1 by activating Sirt1-Nrf2-ARE pathway.
  • PD ameliorated DN in a STZ-induced diabetic rat model.”

“Sirt1 and nuclear factor-E2 related factor 2 (Nrf2)-anti-oxidant response element (ARE) anti-oxidative pathway play important regulatory roles in the pathological progression of diabetic nephropathy (DN) induced by advanced glycation-end products (AGEs). Polydatin (PD), a glucoside of resveratrol, has been shown to possess strong anti-oxidative bioactivity. Our previous study demonstrated that PD markedly resists the progression of diabetic renal fibrosis and thus, inhibits the development of DN. Whereas, whether PD could resist DN through regulating Sirt1 and consequently promoting Nrf2-ARE pathway needs further investigation. Here, we found that concomitant with decreasing RAGE (the specific receptor for AGEs) expression, PD significantly reversed the downregulation of Sirt1 in terms of protein expression and deacetylase activity and attenuated FN and TGF-β1 expression in GMCs exposed to AGEs. Under AGEs-treatment condition, PD could decrease Keap1 expression and promote the nuclear content, ARE-binding ability, and transcriptional activity of Nrf2. In addition, PD increased the protein levels of heme oxygenase 1 (HO-1) and superoxide dismutase 1 (SOD1), two target genes of Nrf2. The activation of Nrf2-ARE pathway by PD eventually led to the quenching of ROS overproduction sharply boosted by AGEs. Depletion of Sirt1 blocked Nrf2-ARE pathway activation and reversed FN and TGF-β1 downregulation induced by PD in GMCs challenged with AGEs. Along with reducing HO-1 and SOD1 expression, silencing of Nrf2 increased FN and TGF-β1 levels. PD treatment elevated Sirt1 and Nrf2 levels in the kidney tissues of diabetic rats, then improved the anti-oxidative capacity and renal dysfunction of diabetic models, and finally reversed the upregulation of FN and TGF-β1. Taken together, the resistance of PD on upregulated FN and TGF-β1 induced by AGEs via oxidative stress in GMCs is closely associated with its activation of Sirt1-Nrf2-ARE pathway.”

How do these and possibly many other contrarian or contradictory findings play out in-vivo? We simply don’t know.  We don’t know how all the regulatory feedback inhibition loops will affect each other when we make a major intervention like enhancing body levels of NAD+.  And we don’t know what the effect of many other variables will be, such as initial oxidative state, circadian state, relationship to stressors, disease states, hormonal states, age, sex, etc. Our theories which look at one pathway at a time under standardized conditions cannot tell us that. We will only know the effect of NAD+ enhancement therapy through observing net health effects and key health surrogate biomarkers. And we have to do that on and highly individualized basis That is why we regard the issue of individual biomarkers to have such great importance.


Digital health – health and fitness wearables, apps and platforms – implications for assessing health and longevity interventions – Part 1 Flux in the market

By Vince Giuliano with inputs and assistance from Melody Winnig and James P Watson

INTRODUCTION

The consumer electronics industry is giving a tremendous boost to public and individual health – perhaps the most important boost in the first half of this century. The digital health movement could result in a number of important but unforeseen consequences, such as the emergence of powerful personal electronic health biomarkers which were hitherto unavailable.   The movement is already contributing significantly to changing our health paradigm by allowing individuals to document their day-to-day health-related behavior patterns.

2014 has been a huge year for health tech according to digital health incubator startup health, “Digital health funding in the first three quarters of 2014 has already surpassed $5 billion, close to double what was invested in all of 2013 ($2.8 billion). “Digital health funding for the year is on track to double last year’s total,” said Unity Stoakes, co-founder and president of startup health. “Some trends we’re watching include a growing corporate interest in digital health, more global cross-pollination of ideas, as well as increasing health consumerism as people move into the driver’s seat when it comes to their care.  With this kind of capital pouring into the market, the health tech space should be exciting to watch in the coming years.” (from mashable.com 5 digital health trends you’ll see in 2015.

This Part 1 blog entry provides a panoramic snapshot view of one area of digital health: the rapidly changing landscape of consumer health and fitness smart wearables like smart watches, online and mobile health and wellness applications, and the associated emergence of online and mobile software platforms that can integrate such applications together.  I also discuss a couple of devices I am personally familiar with.

Smart wearables include electronics-infused clothing and body devices that enhance our perceptions and allow us to do things we cannot normally do – such as know our actual heart rate at any time, or experience virtual reality.  Consumer digital health and fitness is a central theme of smart wearables,  The expectation has been  that 90 million SMART wearables would be sold in 2014(ref),  Accordingly, tremendous capital has been flowing into this area as can be seen from the amazing new array of health-measuring wearables now being sold by leading retailers.

Morgan Stanley has projected that the smart wearables market will soon be worth $1.6 trillion(ref). “Wearable devices will far surpass market expectations, and become the fastest ramping consumer technology device to date, in our view,” a group of Morgan Stanley analysts wrote in a note on Thursday. The analysts add that wearable devices will have “far-reaching” impacts by creating a new category and disrupting or even accelerating change within industries outside of technology.” (I think one of these industries will be medicine – VG) “The analysts project sales of wearable devices will grow at a 154-percent annual compound rate through 2017, where 248 million devices will be sold. The figure will grow even further where sales of wearable technologies will reach one billion in 2020.”

THE QUEST FOR SIMPLE, SENSITIVE AND EASILY-MEASURABLE GENERAL STRESS BIOMARKERS

Image may be NSFW.
Clik here to view.
Queat for holy grail

Quest for the Holy Grail   Image source


A key fantasy I and other longevity researchers have long had may soon start becoming reality – the ability for ordinary people to monitor readily accessible biomarkers that will allow us to evaluate the impacts of day-to-day health and longevity interventions and stress events.  Such an intervention could be a simple change in diet, exercise or sleep patterns, or consuming a new supplement or drug.  Stress events could be a disease, of an emotional or traumatic nature, or as simple as disruption of the normal sleep pattern. These biomarkers could conceivably provide easy and very accessible answers in a few days to very basic questions such as “is my new approach (to a new pattern of exercise/taking a new supplement or drug/sleeping longer or differently/etc.) really working?”  “Comparatively speaking, how well am doing now compared to before?”  “What price am I paying for staying up drinking and carousing until 4 AM last night?”  “How long will it take for me after returning from China to re-establish my normal circadian rhythms?” “What has been the health impact of my partying for several nights in a row over Christmas, drinking more than usual and eating large late meals?”  “I had to take a strong prescription antibiotic.  How long will it take for my gut biome to recover?” Or “I have added a high intensity 8-minute segment to my daily exercise regimen, designed to send my heart rate above 125.   What is this doing to me or for me?”   I now believe the fantasy of ordinary people being able to answer such questions for themselves without professional help is rapidly becoming real.  It will be realized through a powerful wave of developments in consumer electronics powered by billions of dollars in investment.

In fact, during the period of generating this blog entry I have been doing some initial personal research that leads me to think I may already have discovered reliable metrics of constitutive  stress that can be easily computed from measurements made by an existing wearable device.     I expect to report on that personal research very soon in a Part 2 blog entry. Wearables - measuring practical stress biomarkers.

Because new improved products are coming on the market at an incredible rate, it is likely that some devices described here will be becoming obsolete in six months or even less.  That is why I expect to continue reporting on health and fitness wearables on an ongoing basis in this blog.

What is exciting from the viewpoint of this longevity science blog is not that the existing or even the latest generation of consumer devices and software can measure traditionally-identified  biomarkers, such as those identified in the previous blog entry NAD+ an emerging framework for life health and life extension — part 2: deeper into the nad world, hopeful interventions. Rather what exciting to me is the extremely massive public scale and rapidity of adoption of consumer health wearables and apps, the deep pocket companies investing in them, the variety of physiologic biomarkers that are turning out to be electronically measurable by wearables, the possibilities inherent in 24-7 gathering of personal health data, and the extremely low cost to consumers of starting to participate in this movement.

THE SITUATION IS BIG, RAPIDLY DEVELOPING, ALREADY INVOLVING MORE THAT A HUNDRED MILLION PEOPLE, HIGHLY FACETED, AND CHAOTIC

The situation is one of chaos typical in the early stages of a rapidly developing new family of electronic gadgets aimed at almost everybody. There is an avalanche of new products together with much confusion about what they really do or whether they even really work.  A wide variety of products with differing capabilities was already on the marketplace for Christmas 2014.  I understand there were more than 300 booths at the 2015 Consumer Electronics Show in Las Vegas featuring new health and fitness product.  It is impossible to know which product offerings are best and who the winners and losers will eventually be.  The situation is like that we have seen repeatedly over the years for personal computers, digital cameras, personal PDA assistants, mobile music devices, digital pads and smart phones. Seemingly-sophisticated digital watches that can measure exercise and heart rates are now being sold for $5.99 and up. We seek here to provide a snapshot of the changing picture as we see it now.

SOME RECENT HISTORY

A variety of stand-alone health monitoring devices and kits have long been found on the shelves of drugstores. They measure a number of biomarkers that once required going into a doctor’s office or laboratory for testing.  E.g. they measure blood pressure, blood glucose, pulse oximetry, heart rate, heart rate variability, cholesterol, and many are designed to detect presence of certain diseases.  They are designed for personal use and are available to all without prescription.   Likewise, some treadmills and other machines in sports facilities and homes have had built-in indicators of exercise heart rates and elaborate displays showing stress levels, heart rate and likely calories burned in the course of an exercise session.

What we are seeing today is the miniaturization and personalization of such devices – the continuing upward integration of historical lines of consumer electronic health and fitness devices and applications, including: a) functionalities of such stand-alone personal testing devices, b) fitness measuring devices that first appeared in sports facilities connected to machines, and c) consumer health and wellness computer applications, particularly mobile applications (over 100,000 of them),. Most current attention is on an almost-here generation of smart watches and wrist straps that monitor movement, exercise patterns, calories burned, heart rate, sleep parameters and other bio-indicators.  However, I believe we are still in a very early stage of the wearables revolution, and new technologies and devices will continue to emerge that are not imagined now.  This health-wearables revolution is being propelled by new technologies, by increasing consumer interest in health and well-being, and by a maturing baby boomer generation of mostly healthy people in the middle and late 60s who want to stay healthy, and by a consumer electronics industry that sees personal health as an ultimate Killer App.

Here, we look at some of what is going on with

  • Fitness trackers
  • Smart watches and bracelets
  • Advanced body electronic sensor devices and smart clothing
  • Health and fitness apps
  • Integrated health and fitness display software platforms
  • A couple of wearables that I have personal experience with

The consumer wearables area of digital health we discussed here is very large but the entire field of digital health is even larger. According to a recent report by Startup Health.  “The top 10 most active subsectors include big data/analytics, navigating the care system, practice management, sensors/diagnostics and patient engagement.” We don’t touch the first three of these areas here and focus on consumer electronic monitoring. Also we touch only lightly on the tremendous area of associated software apps and online services. Perhaps in a subsequent blog entry we will try to make sense of the some 100,000  health and fitness apps currently available on iOS and Android.

ACTIVITY TRACKERS

A few years back, a first generation of personal health and fitness wearables appeared, like the first FitBit and Jawbone movement-tracking devices.  They provided crude but effective constant real-time measurements of number of steps taken, intensity of exercise, flights of stairs climbed, calories burned, and different stages of sleep. They communicate by bluetooth with computers and smart phones and it is possible to see how these indicators change throughout the day and night, compare them from day-to-day, and even share them with other people in a personal network.  I have been using a FitBit One for about a year now and have found it quite useful for telling me at the end of the day whether I have had sufficient exercise, and, when I wake in the morning a rough indicator of how well I have slept.

From Wikipedia: “The term “activity trackers” now primarily refers to wearable devices that monitor and record a person’s fitness activity. The concept grew out of written logs that led to spreadsheet-style computer logs in which entries were made manually, such as that provided in the us by the president’s council on physical fitness and sports as part of the president’s challenge.[1] improvements in technology in the late 20th and early 21st century have made it possible to automate the monitoring and recording of fitness activities and to integrate them into more easily worn equipment. Early examples of this technology include wristwatch-sized bicycle computers that monitored speed, duration, distance, etc., available at least by the early 1990s. Wearable heart rate monitors for athletes were available in 1981.[2] wearable fitness tracking devices, including wireless heart rate monitoring that integrated with commercial-grade fitness equipment found in gyms, were available in consumer-grade electronics by at least the early 2000s. Wearable fitness tracking computers with tightly integrated fitness training and planning software were available as consumer products by at least 2006.[2][3]?\ — Electronic activity trackers are fundamentally upgraded versions of pedometers; in addition to counting steps, they use accelerometers and altimeters to calculate mileage, graph overall physical activity, calculate calorie expenditure, and in some cases also monitor and graph heart rate and quality of sleep.[4][5][6] some also include a silent alarm.[5][7] some newer models approach the us definition of a class ii medical monitor, and some manufacturers hope to eventually make them capable of alerting to a medical problem, although fda approval would be required.[8] early versions such as the original FitBit (2009), were worn clipped to the waist;[4] formats have since diversified to include wristbands, armbands, and smaller devices that can be clipped wherever preferred.[7][9] Apple and nike together developed the nike+ipod, a sensor-equipped shoe that worked with an ipod nano. In addition, logging apps exist for smartphones and facebook;[6] the nike+ system now works without the shoe sensor, through the gps unit in the phone. The forthcoming Apple watch and some other smart watches offer activity tracker functions.[8]in the us, bodymedia has developed a disposable activity tracker to be worn for a week, which is aimed at medical and insurance providers and employers seeking to measure employees’ fitness.[10] other activity trackers are intended to monitor vital signs in the elderly, epileptics, and people with sleep disorders and alert a caregiver to a problem.[8]

Earbuds and headphones are a better location for measuring some data, including core body temperature; valencell has developed sensor technology for new activity trackers that take their readings at the ear rather than the wrist, arm, or waist.[11] — There are collar-mounted activity trackers for dogs.[12][13][14] — Much of the appeal of activity trackers that makes them effective tools in increasing personal fitness comes from their making it into a game, and from the social dimension of sharing via social media and resulting rivalry.[4][6][15][16] the device can serve as a means of identification with a community,[17] which extends to broader participation.”

The December 2015 issue of PC magazine report The Best Activity Trackers for Fitness provides a lot of comparative data on some current trackers.  This is what they look like.  As you can see, the most popular ones are worn on the wrist

Image may be NSFW.
Clik here to view.
pcmagbestdevices

DEVICES FOR THE HIGH-END SPORTS AND FITNESS MARKET

One of the families of the new wave of wearables is devices designed to be worn in gyms and exercise clubs or by serious workout training addicts.  While this category is quite important, it is not the central focus of this blog entry.  The AMIGO is an example. It is a combination of a wristband and shoe lace device for measuring both upper and lower body movement.  You train the Amigo to recognize patterns of movement that occur in specific exercises. This product, like many others reported here, is scheduled for delivery in 2015.  Of many other devices in this category I mention the Polar H7 Bluetooth Smart Heart Rate Sensor, available as a bluetooth-enabled strap that measures heart rate quite accurately.  This can be used as input for measuring Heart Rate Variability (HRV) on your smartphone, a potentially useful stress indicator.  Much more on this in the Part2 blog entry.

MEDICAL ESTABLISHMENT WEARABLES

Another important category of wearables that we do not focus on here are high-end devices and systems designed to be worn in hospitals or healthcare institutions as well as by individuals at home under medical care. An example is the ZypherLIFE system. This system is designed to measure a significant portfolio of biomarkers and integrate them into medical systems as illustrated in the following diagram.

Image may be NSFW.
Clik here to view.
medsystem1


WHERE CONSUMER FITNESS ACTIVITY TRACKERS STAND NOW

We are currently seeing a transition from the first generation of consumer fitness trackers to a variety of second-generation devices with differing form factors and expanded functionalities.

The first generation are devices like the Fitbit One , the Nike+ Fuelband SE, and the Jawbone Up and many similar devices combine a sensitive electronic  accelerometer-pedometer into a little bracelet or pendant which monitors movement. This movement can be interpreted by software to provide logging of: steps taken per day, total distance traveled, intensity of walking or running exercise during various times of the day, periods of sleep and rough indicators of depth of sleep, and calories burned per day. Other options, such as inclusion of an altimeter, allow logging of flights of stairs climbed.   Following is one of several screenshot of a typical day of my FitBit results. I have been logging activity with this device for about a year.  I have found it particularly useful for assessing periods of sleep and telling me at the end of the day whether I have exercised sufficiently.

Image may be NSFW.
Clik here to view.
Wearable000a


Most of the shown boxes in the online or cell phone display are expandable to show more detail, and it is also possible to view weeky and monthly comparative data.  The weight is from a FitBit wireless scale which also records computed BMI and lean-to-fat ratio


My FitBit 1 communicates with my Samsung S5 smart phone or my computer via bluetooth.  Current and historical records are uploaded to the cloud and available on any Internet or mobile-connected platform. Further, my records can be shared with other FitBit users at my option. The software display platform is proprietary and cannot accept inputs from non-FitBit products. Other first-generation trackers generally provide similar capabilities and sharing of performance records with other users of the same device, a very useful feature for encouraging social support of exercise patterns.

Many smartphones came with built-in accelerometers and can do similar tracking.  The Samsung S5 is an example and the phone comes with a similar activity tracking app, Samsung’s S Health.  The phone itself contains a pedometer like the FitBit and can make other health measurements like instantaneous heart rate.  Limits of the first-generation trackers and smart phones include:

  • Measurements of movement depends on where the device is located on the body. If it is clipped to a belt or in a pants pocket, for example, the device may not provide a good indicator of my upper body exercise. If the device is a smartwatch on my wrist, it cannot detect the exercise movement when I am on a treadmill holding the rail.  Or, while I am pushing a shopping cart.  At best, it provides an approximation of whole body movement.  You cannot rely on your smartphone for activity tracking if you don’t carry it all the time.
  • The measurements do not include any that indicate how my body is responding to the exercise. They do not include anything we would normally regard to be a biomarker.
  • Most basically, the devices are limited by the sensors they contain, in the case of a FitBit, an accelerometer/pedometer and an altimeter.
  • The software platforms and display apps are highly specific to the manufacturer and are incompatible among each other. Users of one tracker cannot automatically share performance records with users of a different tracker.  And if you carry two or more wearable trackers from different manufacturers, you can’t display the results together so you can compare them.  Each of the three tracking apps now on my S5 smart phone only accepts device specific input and none can display an integrated picture.
  • Although the market is crowded with new devices, hard technical and reliable performance specifications are generally unavailable. Information available from manufacturers is generally high-level hype, and it is quite impossible to tell which devices deliver on their promises and which deliver junk results.  Reliable reviews are few and far between, and industry-level standards are missing.   It is a general case of “buyer beware.”  This situation appears to persist today for smartwatches and other new devices coming onto the market.  Having said this, I can say that my limited personal experience with my FiytBit and Basis Peak devices up to this point has been generally positive.

CURRENT MARKET TRENDS

What we have seen in the market since before Christmas 2014 is a) strong price competition for activity trackers of the first generation described above – many new low-cost competitors, b) rapid emergence of second-generation and third-generation devices with much enhanced functionality and bio-measurement capabilities including smartwatches and smart wrist straps, c) a flood of new products being sold, and d) announcements of several new kinds of bio-measuring wearables that go far beyond traditional activity tracking. ..

There are some traditional products such as from FitBit, Misfit and Shine, selling in the $50 – $150price range.  These are from FitBit:

Image may be NSFW.
Clik here to view.
Wearablwe3

Image Source: Fitbit.Com


Likewise, other reputable first-generation products like those from Jawbone are dropping their prices, but not by a lot.

Image may be NSFW.
Clik here to view.
Wearablle4

Image Source: Amazon.Com

A recent review article is compare before you wear: the most popular fitness trackers.

THE NEW GENERATIONS OF WEARABLES – CHOICES GALORE

Smart wearables and wrist straps in the second generation include high-end devices costing $500 and more and low-end devices costing as little as $5.99.   This link goes to the first of 13 pages listing smartwatches and tracker-related such devices for sale at Walmart,  This link is to a Cruncheara site offering smart wearables ranging from eyeglasses, to polo shirts to insoles.

Who is in the game?  Wearable health and fitness monitoring devices are available or announced from Polar, Garmin, Mio, Basis, Withings, FitBit, Timex, New Balance, Wahoo, Suunto, Jawbone, Pebble, Androset, Scosche. LL Bean, Radius, Jarv, Pyle, TomTom, New Arrival, Tune Belt, Luxsure, SNEER, New Arrival and several others,  And, oh yes, also in this game are lurking giants like Microsoft, Intel, SONY, Motorola, Samsung and Apple.  Browse for yourself!  Here is a REI shopping site for watches and straps with heart rate monitors,  Here is an Amazon.com shopping site for health and fitness monitors,  Here is a listing of LL Bean offerings.  Here is a different amazon.com catalog listing.  Here is a listing of just SONY smart watches. This page from saleguru.net shows price comparisons for 49 different Apple-compatible models of smartwatches.

At the lower-end price points, such devices are highly likely to become must-have items for middle school and high school kids and young adults.  Many cheaper ones were stocking stuffers for Christmas.  For this reason alone, it is likely that tens of millions of people were introduced to health and fitness capable wearables just during the 2014 Christmas season,  The images shows some of the cheaper devices.

Image may be NSFW.
Clik here to view.
Wearablle5

Image may be NSFW.
Clik here to view.
earable00


Image may be NSFW.
Clik here to view.
Wearablle6

Smartphone sensors

Many smartphones have built-in sensors that allow them to function as first-generation trackers.  Such as:

– accelerometer pedometer-type motion sensors which allow them to monitor movement and even sleep – if you are willing to sleep with your cell phones

– cameras which can double as optical heart rate monitors.  They can also serve as bar code scanners for screening packaged foods at supermarkets or some restaurant menus that print barcodes.  Software apps can then give you nutritional values and calorie counts.

HIGHER-END CONSUMER FITNESS TRACKERS AND SMART WATCHES

The higher-end devices are embodying the functionality of the first generation, in some cases doing a better job at that, plus additional functionality due to the incorporation of additional sensors.  They are evolving from being basically movement trackers to more general health biotracking devices.  Again, the first generation was based on pedometer/accelerometer and altitude sensors. The higher- end second-generation trackers variously embody additional other sensors such as for heart rate measurement, skin temperature, 02, skin galvanic resistance, and GPS capability. Some of these are sold in the form of wrist straps, and some in a new generation of smart watches,   In general, these devices offer a higher level of integration with smart phones, and come with broader and more comprehensive but still proprietary health and wellness apps. Estimates of levels of exercise and associates stress can be based on combinations of the sensor outputs.  The following as representative of the higher-end second generation trackers/smartwatches with heart rate measurement capabilities:

How can one make sense of this avalanche of offerings?  I don’t know. My personal choice a few weeks ago was based on my health/longevity biomarker primary focus of interest – rather than a strongest interest in  fitness/exercise, elegance, or general smartwatch capability.  After limited research I ordered a Basis Peak.  That and my trusty old FitBit One are the only devices I am personally familiar with and will discuss here in any detail.

THE BASIS PEAK

The Basis Peak arrived at my doorstep about three weeks ago, so I can tell you what motivated me to buy it but am not yet quite ready to report on my experience with it.  The package claims “The ultimate fitness and sleep tracker.” Image may be NSFW.
Clik here to view.
Peak watch
Based on its published specifications and positive reviews, it indeed may be that right at the moment. However, there is no guarantee on how long it will remain that way.  A November 2014 review in PC world  This is the band to buy if you obsess over heart rate and sleep tracking reports: “this is a second generation device, an improvement in multiple dimensions over the first generation device which appeared about a year ago. Among the sensors it encompasses are a FitBit-type accelerometer, an optical sensor that measures heart rate through the skin 24-7, a galvanic skin resistance sensor and a skin temperature sensor. Basis was recently acquired by Intel and has a history of earlier devices basically marketed to the fitness community.  As I write this, smart watches with heart rate measurement capabilities are announced and will be available in the coming months from Apple,  FitBit, and Jawbone among others, but these will be first generation devices which will no-doubt need improvement.  Now being an Intel company, I expect a continuing process of improvement in the Basis products.”

So far, I am very happy with the choice.  Here is the Peak’s record of my sleep for a typical night..

Image may be NSFW.
Clik here to view.
Wearablle 23

I do not know how the Peak can distinguish REM sleep from light sleep and cannot vouch for the accuracy of its findings. The FitBit was on my wrist next to the Peak.  It is interesting that the estimates of both devices for any period of sleeping are off by only a few minutes, although the details of the sleep is reported differently.  The FitBit does not try to distinguish among depth or type of sleep.  Here is A FitBit sleep record for me for a week:

Image may be NSFW.
Clik here to view.
Wearablle


Here is a day’s(24 hours) activity record from the Peak:

Image may be NSFW.
Clik here to view.
Wearablle 34

I have been logging these Basis Peak patterns every day on a spreadsheet since the watch arrived and studying them to see what their implications might be for my health.  After just 24 days of doing this I can say the results so far are quite exciting.  I am coming to believe these activity indicators can be combined with the sleep indicators to produce interesting new constitutional stress-state measures,  I expect to report on my observations after a full month of data gathering and analysis in the Part 2 Blog Entry for the wearables topic.

A preliminary observation relating to the device is that the existing software could be more comprehensive in providing consumer advice,   Also, I strongly suspect that the sensor data might be combined in different ways to provide measures of other physical conditions such as hydration and heat exhaustion stress.  My sense is that the Basis Peak is probably a superior hardware platform but that its software and user-friendliness integration might be significantly enhanced.  My hope is that the Basis company will move in this direction.  Earlier, the company promised an API for Peak outputs that would allow new customized forms of use data analysis.  And the company promised a software upgrade for December 2014 that would include smartwatch notifications on the Peak.  But so far these have not been forthcoming.

A more basic downside of the Basis Peak or any other single smart wearable available today is that its measurements are limited by the sensors it contains.   Ideally, my smartwatch would provide good measurements of heart rate variability, breathing regularity, blood pressure, body posture, glucose levels, blood oxygen, ECM, and embody a GPS capability.  At present the Basis Peak does not measure any of these although other new-generation consumer wearables do. (None measures all or even most of these).  Further, it is doubtful that third-party applications from either iOS or Android will be able to compute adequate heart rate variability (HRV) measurements from the physical sensor inputs the Peak watch provides.

NO SINGLE SMARTWATCHCAN PROVIDE THE BIOSENSING WE WILL WANT

Different smartwatches and other biosensing wearables typically embody different combinations of possible sensors and none have even most of them. This is understandable because  the number of sensors that can be put in any single device is limited for reasons of size, power consumption and location of that device on the body.  If you want to measure blood flow, near the ear may be a much better location than on the wrist.  If you want to measure body movement during exercise, it is best to have multiple sensors on the arms, legs and torso. If you want to measure brain waves, it is best to have sensors on the head, etc.

For these reasons, I expect the long-term  trend not to be cramming more and more sensors into a smartwatch, but rather the emergence of body networks of sensors all communicating with a central processing and data storage and external communications capability.  Today,  the smartphone is a far better candidate for that capability than any smartwatch.

This observation is also disappointing news for those expecting that the Apple Watch will be the ultimate sensing device with regard to health and fitness.  It can’t possibly be that.  However, it and watches like the Peak might provide a good start.  What can be put in any smart watch is a matter of compromise.  For example, the Apple Watch’s brilliant reconfigurable color display uses so much power that I suspect the watch must be taken off and recharged daily, while the black-and-white display trackers like the Peak can go for a few days between charges.

In the longer term I expect to see a wider variety of specialized and communicating wearables and direct-to skin-contact sensor devices, all kinds of smart clothing, and ultimately subcutaneous and possibly deeper body implants of many kinds.  These sensors will measure a growing list of bio indicators, communicating locally to a central processor, probably in the smart cell phone, which in turn will communicate with database and processing resources on the web.

BEYOND SMARTWATCHES – THIS YEAR

The article  5 digital health trends you’ll see in 2015 list some interesting predictions of what is likely to come in 2015. I quote from this article here.

“Wearables for the ear”

Despite that current craze for wrist straps and smartwatches, the ear may be the next favorite place..

“Due to the proximity to the temporal artery, devices worn on the ear can conduct completely unobtrusive, passive monitoring and offer far more precise measurements,” says Dr. Vahram Mouradian, founder and CTO of Sensogram Technologies. “Moreover, they can deliver a wealth of wellness information, including real time blood pressure, respiration rate and oxygen saturation, in addition to the typical readings of heart rate or steps taken.” — We’ve already seen a few of companies introduce ear buds with basic health monitoring, such as Iriveron and Freewavz. Watch for increasing sophistication in ear-based devices over the coming year.  For example, Sensogram’s Sensotrack — slated for general availability in March 2015 — is an elegantly designed device that fits snugly on your ear, where it measures heart rate, blood pressure, oxygen saturation and respiration rate. It also counts steps and calories burned, while sensing your speed, activity level, geolocation, altitude, body posture and pace.”

Notice that this device adds oxygen saturation, respiration rate and body posture to the measurements made by the latest smartwatches.

Continuing, “also keep an eye out for Bitbite, the first ear-based device that automatically tracks your eating habits and helps you improve them with real-time dietary advice. The Bitbite device fits comfortably in your ear and learns when, where and how you eat. It then analyzes this data and gently nudges you to make adjustments, such as slowing down your eating pace or drinking more water. Bitbite doles out its advice either by “whispering” in your ear or by alerting you through the bitbite smartphone app.  Bitbite just launched its Indiegogo crowdfunding campaign on November 11, with general availability expected in Q2 of 2015.”

So, some of the devices are becoming more bossy and nanny-like.  Some may end of virtually screaming at you if you start doing something healthwise foolish.  For now, they’re mostly simply flashing reminders on your cell phone or smartwatch screens or giving you a gentle buzz.  The Pavlok, a wrist wearable, is more aggressive and gives you electrical shocks.

“2. Sweat sensor strips”

“Want even more insight into what’s going on in your body? You’ll soon be able to track your internal biochemistry with a simple biosensor strip.  Electrozyme is developing a printed, flexible strip sensor that inserts into the back of your wearable device and measures the metabolic substances secreted in your sweat, allowing you to track your electrolyte balance, hydration level, muscle exertion and physical performance. According to electrozyme, the chemical analysis enabled by its disposable biosensors can give people actual insights into their metabolism that go way beyond steps and heart rate.”  Ok.  Another bunch of indicators.  “see also: Is that App FDA approved? Mobile health tech falls into gray area.  “The advantage of tracking sweat using chemical sensors is that it gives insight into your body chemistry and how it is responding to your workout that is not available using traditional sensors,” says Jared Tangney, Ph.D., co-founder and COO of Electrozyme, llc. “Chemical sensors open up a whole new world of information that was previously never available in wearable devices.”  “Tangney sees a range of different applications for this technology, including letting you know when it’s time to drink some water — something most of us probably need: according to some reports, up to 75% of americans may be chronically dehydrated.”

“3. Smartphone case devices”

“You’re already carrying around a smartphone with a protective case. Why shouldn’t it do double-duty as a medical device?  “We’re starting to see some initial forays into using smartphones and their cases to measure medical conditions that previously required specialized equipment,” says Joanne Rohde, CEO and founder of Axial Exchange. “imagine an electrocardiogram anywhere — not just at your doctor’s office — or a dyi blood test to check your glucose right in your pocket. Some of these innovations are already available, but there are many more to come.”  One of the first to hit the market was the Alivecor heart monitor, an FDA-approved iPhone case that allows you to record ECGS and heart rate on the go. You can rest it on your fingers or chest to record an ECG in 30 seconds, and know right away if atrial fibrillation is detected, which could be an early indicator of stroke.”  This could be valuable because the pulse rate monitors currently being marketed fall far short of providing ECG levels of information.”

” in 2015, watch for more such devices to become available as they pass through the FDA approval process. — For example, Azoi’s Wello is a mobile health tracking device which doubles as an iphone case and is currently in the process of getting FDA approval. It can measure vitals such as ECG, heart rate, blood oxygen saturation levels, respiration and temperature.”

“4. Prescription-only apps”

“There are already thousands of health apps you can find on Google Play or iTunes. Soon, some of these apps may require a prescription.  One early example is Welldoc’s Bluestar, the first “mobile prescription therapy” for people living with type 2 diabetes. The prescription-only app allows people to input data about their glucose levels, diet, exercise, well-being and other factors, which Bluestar automatically analyzes to give the patient immediate guidance and feedback. Bluestar also analyzes the data for the patient’s physician and allows the patient to provide a detailed summary of their progress to the physician for review prior to or during office visits. — While you might not see a flood of prescription-only apps hit the app store in January — launching one requires FDA approval, clinical trials, insurance reimbursement and more — Welldoc’s co-founder and chief medical officer Dr. Suzanne Sysko Clough says we should “expect to see more mobile prescription therapies for many major chronic diseases over the coming years.”

“5. Healthier lighting

“Finally, ever wonder why “you have trouble drifting off after staring at your iPAD in bed? The culprit may be the blue light emitted from your device — the part of the light spectrum that causes the biggest changes to your internal circadian rhythm, which can disrupt your sleep and impact your health.”

(Check out our blog entry Blue light, sleep, mental alertness and health)

“People who don’t get enough sleep have trouble being productive, controlling their emotions and coping with change. They’re also at greater risk of major health issues such as heart disease, diabetes and stroke,” says Cameron Postelwait of Sewell Development Corporation, developer of the low-blue-light Drift light bulb, which launched in May of this year. Postelwait believes that in 2015, we’ll see a much bigger focus on the effects that artificial light has on people’s health, as well as new product innovations to address the problem, particularly in clinical environments and hospitals.  “A patient in unstable condition requires nurse visits all through the night. Every time the nurse enters the room, he activates some kind of lighting to help him check on the patient’s condition and to give medication. This throws off the patient’s natural circadian rhythm, which not only disturbs sleep, but may also impact immune response,” explains Postelwait. “There’s a huge need for lighting that either has an absence of blue light or a way to change the amount of blue light that the patient receives during the day or night.”  But while too much bright light might be harmful at night, too little during the day can also bring you down.  Luckily, there are folks hard at work to add some sunshine to your day.  For example, Goodlux Technology recently launched Sunsprite, the first wearable device to track daily bright light intake. According to Goodlux, scientific studies have linked bright light exposure to health benefits such as better energy, mood and sleep.”

“There’s so much focus on nutrition and fitness that mental wellness is often overlooked. Bright light sets the body’s internal clock, which controls essential components of mental wellness: hormones, energy levels, mood, digestion and sleep,” says Goodlux CEO Ed Likovich. “Three out of four of our early adopters report improvements in these essential components to mental wellness.”  “The solar-powered Sunsprite boasts dual sensors that measure visible and UV light and lets users know when they’ve absorbed just the right amount of bright light to maintain health, while also providing tracking for monitoring UV exposure.” (Quotes above are from ref)

HEALTH AND FITNESS MEASURING DEVICES VS. MEDICAL MEASURING DEVICES

As the consumer wearables move increasingly towards measuring traditional medical indicators like heart rate and blood pressure, the distinction between sports-and-fitness aids and medical devices becomes increasingly blurred.  The former are not subjected to regulation but the later are regulated by the FDA, including being subject to approval.  For now, manufacturers of most fitness-oriented devices and consumer smart wearables have not sought such approval.  At the same time, a number of other manufacturers have sought and sometimes have received approval.  See the December 2014 article Round-up: 31 FDA clearances for digital health in 2014  “In August, the FDA proposed to largely deregulate a sizable list of Class II and Class I medical devices and no longer require their makers to go through the 510(k) process. These devices included thermometers, smart body scales, stethoscopes, and some ophthalmic cameras. — Still, there were many devices that did get clearances this year — by MobiHealthNews’ count there were at least 31 new FDA 510(k) clearances for digital health. == Devices cleared this year include an app that uses the iPad’s camera to estimate the amount of blood lost during a surgery, a smartphone-connected thermometer, an iOS application that treats a medical condition called tinnitus, and a vitals sensing chair. There was even one mysterious clearance from South Korean technology company LG Electronics for something called “LG Smarthealth”.

The clearances are listed in the article.  Most relate to applications in medical practice. Yet the distinction of what constitutes a medical device remains fuzzy. “Swiss remote cardiac monitoring company LifeWatch received FDA 510(k) clearance for LifeWatch VSP (Vital Signs Patch), the company’s adhesive patch for remote patient monitoring. The device is a disposable adhesive strip which contains sensors to monitor ECG, heart rate, respiration rate, temperature, saturation, and movement. It also contains a battery which allows the device to collect data continuously for five to seven days.”  This description of functionality sounds identical to that for some sports-and-fitness wearables.

SMART CLOTHING

Building sensors into clothing and shoes seems to be a sensible approach and is already starting to happen.  From the Gizmag article Top personal health and fitness gear of 2014: .  “The Omsignal biometric smartwear is created from a stretchable, machine-washable fabric designed to compress the user’s torso in order to encourage blood flow both during exercise, and after, to expedite recovery. The shirts feature an inbuilt accelerometer and electrocardiogram sensors that monitor variations in the wearer’s heartbeat throughout the workout, while other sensors work together to calculate calories burnt. Data collected by the smart shirt is recorded by a detachable data module and relayed in real time via a bluetooth to the Omsignal companion app (currently only available for iOS) on the user’s smartphone. — The collection currently features only men’s smart shirts, which range from us$100 to $130 in price, with women’s shirts slated to become available in early 2015.  —  Not content with its own offerings, Omsignal also partnered with Ralph Lauren to design the Ralph Lauren Polo Tech Shirt. Complete with polo player logo, the shirt features an electrocardiogram, a breathing sensor, a gyroscope and an accelerometer that monitors and analyzes stress levels, energy output, heart rate, heart rate variability, breathing rate, breathing depth, activity intensity, steps and calories burned and provides real-time training feedback. For those looking to keep fit in colder climes, the Hexoskin Arctic Biometric Smartshirt (us$199) features sensors knitted into a new textile developed from research on polar bears. It tracks metrics like heart rate, steps and calories burned, as well as cadence, activity level, acceleration, breathing rate, sleep duration, heart rate recovery and variability, and more (in all, it tracks some 42,000 data points per minute). — from shirts to shoes – or at least, insoles. The moticon opengo sensor insoles (price on application) turn your footwear into a wireless performance-tracking system with 13 pressure sensors that monitor foot pressure, movement, acceleration patterns and gait, with the data stored on a usb stick for post-workout computer analysis, or transmitted wirelessly via ant+ for real-time feedback while working out.” I think it will only take a few years for costs of sensor-ladened clothing and shoes to come down to ordinary consumer price points.  And the polo tech shirt already appears to have sensors beyond those available in any smartwatches

HEALTH AND FITNESS APPS

Starting perhaps four or five years ago, health and fitness applications began to appear for both the Apple iOS and the Android smartphone  platforms.  They are available in the Health and Fitness departments if the iTunes Store and of Google Play. These are variously devoted to activity and sleep tracking, management of diet, calorie counting, weight tracking, connecting you to fitness communities, personal training, customized workouts,  specific athletic activities such as running, and countless specialized functions.  Some make use of your phone camera and offer voice commands or virtual personal trainers,  many allow you to compare week-by-week progress.  Some are based on or can connect to motion trackers, or use your phone’s GPS, to determine where you have been, the distance covered and the level of exercise. Some are friendly companions, others are more like judgmental or bossy coaches.  Some award you points for healthy behavior, some give you constant reminders, some network you with possibly supportive people.  Some track your activity and tell you when you have fulfilled your daily quota.  Some apps can be customized to personal activities like rock climbing or playing ping-pong.   Some interface with pedometers, either in devices like a FitBit or built into your smartphone.  Some perform highly specialized functions, like variable heart rate analysis when connected to a chest strap with sensors.  Some have you play health and fitness games.   The variety is almost endless.  Zombie movement tracking, anybody?  The more complex of these apps cover several approaches and increasingly offer integrated personal views of health from multiple viewpoints.

To get a more concrete sense of these apps, here are short reviews of the “best 64″ such apps for 2014.  Here is another list of the “best 100 android health and fitness apps” for 2014.    One noticeable characteristic of these reviews is the general absence of hard technical or performance specifications that allow any real comparison.   The reviews tell you what the apps look like and are generally supposed to do, but not how well they actually work and leave you little sense of what is best to buy.

Here is a news story from June 2014, and so already hopelessly obsolete.  “health and fitness apps finally take off, fueled by fitness fanatics — “over the past six years, we have seen mobile and its apps disrupt and transform many industries. The healthcare industry, while named early on as an industry that would be totally transformed by smart devices, seemed to have lagged behind. In 2013 while the overall mobile app industry grew 115% in terms of average daily usage, the health and fitness category only grew 49%. This appears to be changing rapidly in 2014. We are not even halfway through the year (and usage normally accelerates in the summer and during the holidays) and the growth in health and fitness app usage has been stunning. We have studied the usage of over 6,800 iphone and iPAD apps listed in the health and fitness category on Flurry’s platform and we have seen a 62% increase in usage of health and fitness apps over the past six months. This compares to 33% increase in usage, measured in sessions, for the mobile app industry in general. Growth in health and fitness is 87% faster than the industry, which is itself growing at an astounding rate.” according to Nielsen: 46 million people used fitness apps in January  2014(ref).  The current number is of health and fitness apps users is without doubt more than double that.

The good news is that these apps tend to be cheap – typically free or less than $5, and increasingly comprehensive and multi-platform accessible, working interchangeably on a smartphone, a PC or a pad.  And they offer a multiplicity of displays of health data.  The bad news is that the vast numbers of them make it very difficult for a novice to figure out which ones to download and use.  Another piece of bad news is that those that connect to wearables tend to be very device specific.  The information offered about them online tends to be very limited.  And almost every app stands alone.

INTEGRATED CONSUMER HEALTH AND WELLNESS PLATFORMS

Given that there are many dozen kinds of of biometric sensors coming into use, be they in smart phones, wristbands, earbuds, clothing, shoes, or patches, question that arise include:

  1. What specific patterns of data among all those collectible by today’s and emerging wearables are useful either to individuals or health practitioners for determining states of health, possibly predicting diseases, and suggesting actions?
  2. As a prerequisite, how can this data be collected, viewed and analyzed together in ways that make sense for analyzing or predicting health and suggesting individual actions that will lead to longer healthier lives?

I do not know, nor do I think that anyone knows, the best answers to the first question. What I can say is that I have started to pay very careful attention to the personal data I am gathering now from my Basis Peak and am looking for patterns and correlations that I think may be meaningful. I believe I am finding interesting correlations between Peak data patterns and experienced stress events.  I will also be conducting tiny personal experiments, such as determining how my nightly dose of melatonin or the time I have dinner or what I eat for dinner may affect my sleep patterns.

Integrated data analysis platforms

With regard to the second question, we already seeing the emergence of software platforms that will receive data from multiple sources and display them integrated together. As can be expected, the main competition now seems to be between Apple and Google and their respective operating systems iOS and Android.

In the Apple world, “Apple’s new mobile operating system, iOS8, released in September included a new feature in the Health app that displays various bits of health data collected by various apps in one place. In the same vein, the app’s Medical ID feature lets you input various pieces of health information that could be important for emergency services workers if you are involved in an accident. This includes such things as allergies, blood type, medical conditions and emergency contacts. Importantly, this data can be accessed even if your phone is locked.(ref)”  The healthkit wellness app appears to be the main current Apple effort. “Healthkit will allow a user to view a personalized dashboard of health and fitness metrics, which conglomerates information from a myriad of different health and wellness apps, helping them “communicate” with one another.  With this technology, it’s easy to envision hospitals, clinics, pharmacies, laboratories, and even insurers integrating bilaterally with any patient information housed on healthkit, at the discretion of the user. ” Mayo Clinic, Cleveland Clinic, Kaiser Permanente, Stanford, UCLA, And Mount Sinai Hospital are all rumored to be working with Apple to figure out how to exchange relevant patient information to enhance the continuity of a patient’s care. In addition to these potential collaborators, electronic health record providers epic systems and allscripts are rumored to be working with Apple in some sort of partnership.3,4”  at least 56 apps to start with will connect to healthkit(ref). The consumer interface of healthkit, called Health is preloaded on all iphones running iOS

In the Android universe, it appears that Google Fit is the main competitor to Apple’s Healthkit. “Mobile fitness apps are a dime a dozen these days, but Google is trying to add value by letting fit act as a hub for third-party apps like those from Strava, Withings and Runkeeper. Fit users can access data gathered by those apps within the Fit app, instead of having to switch between them. That functionality makes Google Fit the prime competitor to Apple’s Healthkit, a software platform for iOS 8 that lets third-party apps share their data with Apple’s health app. Google Fit is available for devices running Android 4.0 (Ice Cream Sandwich) and above. Whether Google Fit catches on likely depends on the number of integrations it will support with other apps, and how well it presents the combined data. It’s unclear if other popular apps from device makers like FitBit or Jawbone will be integrated with Fit, and Google didn’t immediately comment.  In addition to it being an app, Google Fit is a software development kit. Its apps aim to let developers access data from other sources to make their own apps more powerful. Fit, therefore, could be a win for Google by strengthening the broader ecosystem of health apps, and then weaving them into Fit.  Fit API partners include Basis, Adidas And Motorola.” (As of the writing of this blog the Basis Peak data cannot be imported into Google Fit)

Both the Healthkit and Googlef Fit apps have had their own problems.  See the October 2014 articles Apple’s health app is an embarrassment and Google Fit has its own ailments.  I had no problem downloading the  Google Fit app yesterday but found it quite useless in its present state for what I wanted it to accomplish,  I wanted it  to offer me an integrated view of data from my three current health and fitness devices.  Those are my FitBit 1, my Basis Peak and my Samsung s5 smartphone which also has a pedometer and instantaneous heart rate measurement capabilities. As far as I can tell, there is no way right now to import data from the FitBit 1, or the Basis Peak into Google Fit.  Apparently, neither the FitBit nor the Basis organization have released the necessary APIs (application program interfaces).  So, a serious impediment to the emergence of software platforms that offer integrated data views from multiple devices could be the device manufacturers themselves who want to hold on to their own users via their own software.  It could be that both Healthkit and Google Fit are actually on the right track but just not there yet.  A Google fit webpage soliciting participation of sensor-makers lists 20  “partner” organizations including Intel, Basis and Withings. A list of apps that are presumably now compatible with Google Fit is here, as of this writing 13 in number.

MEDICAL AND RESEARCHER SKEPTICISM

The health and wellness consumer movement is seen by some members of the Health Care and Medical Establishment as possibly unsanitary trespassing on their pre-owned territory.

They rightly point out that the devices mentioned here are not regulated and who knows what these gizmos really can and cannot measure.  And human behavior being as it is, information feedback may or may not be enough to influence personal health related behavior.  Already we are seeing a few warning rockets being fired.  For example, check out this research report: Wearable tracking devices alone won’t drive health behavior change, according to researchers. “New Year’s weight loss resolutions are in full swing, but despite all the hype about the latest wearable tracking devices, there’s little evidence that this technology alone can change behavior and improve health for those that need it most, according to a new online-first viewpoint piece in JAMA. The paper, written by researchers at the Perelman School of Medicine, the Penn Medicine Center for Health Care Innovation, and the LDI Center for Health Incentives and Behavioral Economics at the University of Pennsylvania, points out that even though several large technology companies are entering this expanding market, there may be a disconnect between the assumed benefits and actual outcomes.”  Personally, I think this kind of engagement of serious researchers and questioning in the Wild-West health-wearables market could be a very good thing and should be welcomed.

SOME QUESTIONS AND SPECULATIONS

Will the area of consumer health wearables continue to take off as seems to be happening now or will it turn out to be a current fad as people do not find the health-measuring facilities of their smart watches to be that useful?  

I expect the wearables trend will continue to take off and become mainstream, although there are likely to be fits and starts and many products and concepts that go nowhere.  The trend will be part of and empower a broader trend of consumer health consciousness and individuals increasingly taking responsibility for their own health and longevity

Where is body sensor tracking going?  What, beyond smartwatches and straps will be the next big way of embodying consumer health- measuring sensors?

I do not see the present major trend continuing – that is integrating more and more sensors and measuring capability into a single device, be it wristband or smartwatch. Every added sensor, especially if it is constantly active in measures 24/7, takes space, has weight and consumes power. There are only so many sensor devices that can be compacted into the case of a smartwatch.  Nobody wants a 2 pound smartwatch.  That is why the different fitness band and smartwatch offerings available today are all compromises and none have all the functionality that is possible. Some leave out the altimeter, some leave out the pulse oximeter, some leave out the continuous pulse rate monitor, some cannot measure O2, etc.  I see the emergence of numerous specialized measuring devices which may be associated with different parts of the body, which are integrated together by third-party multi-sensor tracking systems.  The earbud sensors and leg motion sensors mentioned above are examples.  Others might be in the form of patches, pills that are swallowed, shoelaces, pieces of clothing, shoe inserts, and subcutaneous implants.

Specifically, how popular can we expect clothing that embodies biosensors to become? 

My guess is, in the longer run, very popular, along with smart shoes, hats, scarves, gloves, earrings, rings and pins. wallets, jewelry, skin patches and what-have you.

Where will the point of integration for all these sensors be on the body? 

For now the best answer seems to be in the smart phone where there is plenty of processing power, memory, and external communications capability.

What about industry standards?

Standards will have to be developed, getting us beyond the current Wild West of proprietary software platforms associated with individual pieces of proprietary hardware and the over 100,000 health and wellness apps out there.

To what extent will there be a confluence of consumer health-and-fitness and medical sensing devices?  Will the consumer health systems connect with or become integrated with or evolve into professional ones utilized by the medical profession? Or will they continue to evolve in their own trajectories and be regarded by medical professionals as “toy” systems. How and when will mainline medical practitioners tune into and adopt their practices to what health-conscious consumers are doing? 

This is very hard to predict.  I expect the consumer and medical devices and systems to remain in separate categories for some time.  I foresee a slow and bumpy process of reconciliation of consumer-driven health initiatives and medical-establishment protocols and initiatives, one that may require 30, 50 or more years.  In the shorter term, the consumer-related technologies and personal use patterns are likely to evolve very quickly in comparison to the hardened institutionalized patterns of the medical establishment, big pharma and the FDA.  There will be controversy.  There will be continuing efforts to regulate the consumer products as medical devices, but these will be mostly resisted. If history is any predictor, I expect soon to hear solemn warnings from medical device doctors in white coats not to trust health measurements made by consumer devices.  A few forward-looking HMOs or medical insurance companies may move to accelerate a process of reconciliation, however.  It will be fun to watch how this all unfolds.

ON TO PART 2

I will publish a Part 2 blog entry soon related to the likely emergence of practical health stress biomarkers, based on both theory and very recent personal experience.  I acquired a Basis Peak smartwatch a little more than three weeks ago and have been building a log of daily and nightly experience with the parameters it can measure – continuous heart rate, movement, skin temperature, ambient temperature and perspiration.  Based on these measurements I have been looking for overall health measurements – basically measures of overall constitutional condition of stress.  I believe I have been successful at identifying such, but don’t want to publish my conjectures until I have at least a month of data and personal experience to report on.  I am very excited by this effort.  In addition, in a Part 3 blog entry Jim Watson will report on  what is generally  thought to be a good measure of constitutional health – HRV, Heart Rate Variability,

DISLAIMER

None of the authors has or has had a personal or commercial relationship with manufacturers or sellers of any of the devices mentioned here.   In mentioning personal choices and experience, we acknowledge that our choices were necessarily relatively uninformed, given a general lack of reliable technical and performance specifications.  More capable products might appear on the market at the same or lower price point within six months, and any existing device may be obsolete in a year.  These are characteristics of a fast-paced consumer electronics market with multiple competitors at its current stage of development – like the situation was with consumer digital cameras about seven years ago.


Digital health – health and fitness wearables, Part 2: looking for practical stress biomarkers

By Vince Giuliano

This entry is different from any other published so far in this blog  – it describes an original research experiment rather than characterizing a whole area of research or being an editorial.

This is the second blog entry related to electronic wearable devices capable of making personal behavioral and physical parameter measurements that bear on health and wellness and likely longevity.  The first blog entry was Digital health – health and fitness wearables, apps and platforms – implications for assessing health and longevity interventions – Part 1 Flux in the market.  It provides a snapshot view of one area of digital health – the rapidly changing landscape of consumer health and fitness wearables like smart watches, online and mobile health and wellness applications, and the associated emergence of software platforms that can integrate such applications together.  I say snapshot because of the rapidity with which the market for these device is evolving.

This current blog entry reports on initial personal experience related to identifying what appear to be effective daily stress biomarkers that are derivable from measurements made by my Basis Peak smartwatch.  I report here on the results of logging data measurable by the watch for 30 days, analyzing it, identifying what I believe are critical constitutional stress biomarkers, and confirming that values of those biomarkers indeed correlate well with known stress events I have gone through over a period of 30 days.

A third blog entry on this series written by James P Watson, is currently in the draft stage and will be published soon.  This will be on Heart Rate Variability, a well-established and well-studied constitutive stress biomarker different from the new ones that I propose and discuss here.

THE DESIRABILITY OF AN EASILY MEASURED CONSTITUTIONAL STRESS BIOMARKER

First of all, I reiterate why I think this research could be quite important.

The Part 1 blog entry describes a fantasy enjoyed by some health and longevity researchers including myself – the availability to ordinary people of constitutional stress biomarkers that will help us understand the effectiveness of the multiple interventions we are entertaining for maintaining health and active longevity.

As I said there, “Such an intervention could be a simple change in diet, exercise or sleep patterns, or consuming a new supplement or drug.  Stress events could be of an emotional or traumatic nature or as simple as disruption of the normal sleep pattern.  The desired biomarkers could conceivably provide easy and very accessible answers in a few days to very basic questions such as “Is my new approach (to a new pattern of exercise/taking a new supplement or drug, sleeping longer or differently/etc.) really working?”  “Comparatively speaking, how well am doing now compared to before?”  “What price am I paying for staying up drinking until 4 AM last night?”  “How long will it take for me after returning from China to re-establish my normal circadian health patterns?” “What has been the health impact of my partying for several nights in a row over Christmas, drinking more than usual and eating large late meals?”   Or “I have added a high intensity 8-minute segment to my daily exercise regimen, designed to send my heart rate above 125.   What is this doing to me or for me?”  This fantasy of being able to answer such questions with measured physiological data may well be realized through a powerful wave of developments in consumer electronics powered by billions of dollars in investment.”

Based on the limited observations reported in this current blog entry, I think that I have identified a couple of readily measurable and indicative day-to-day stress biomarkers of exactly the kind we have been looking for.  These can be derived from measurements from a smartwatch, a Basis Peak in my specific case. No need for chest straps, electrodes and electrode gel required for heart rate variability measurements.  On the one hand, this blog entry is about a highly personal exploration.  On the other hand, it might also characterize stress biomarkers that can be measured and utilized by everybody.  Only a much longer period of systematic study and tests by additional people will tell for sure.

Some background personal experience over the last year

 Skeptics ask the question of “what good are the measurements made by health and fitness wearables anyway?  What is their practical value?  The skeptics point out that there has been a very high rate of abandonment of use of the first-generation trackers(ref).  People have been discovering that they are not conveying useful new information after a while, and stop using them

I don’t have definitive answers to this question yet. I don’t think anyone has. Yet I remain excited about the question and am happy to report here on my personal experience with exciting new stress bioindicators.

The personal usefulness to me of my first the-generation health wearable, a FitBit One, has been providing me ongoing support and impetus for my daily exercise regimen.  For about a year now, it has provided me a good approximation of the degree to which I have moved my body and calories expended, so that in late afternoons and evenings I have a good assessment of how much more exercise I need to fill in to meet my daily exercise quota.  I have been looking to move 3.5 miles or more a day and burn at least 1750 calories.  Some days I will go out on several shopping expeditions or engage in physical work such as mowing the lawn or raking leaves or shoveling snow, perhaps climbing 18 flights of stairs in the course of the day.  On those days I will easily make the daily exercise quota just by what I have been doing. Other days, particularly ones when I have been sitting at the computer studying and writing, I have sought to make the quota by filling in exercise later in the day on the treadmill or possibly by swimming or other physical work around the house.  The FitBit One measurements have been very useful to help me make those decisions.  They let me know how much I had to fill in.  And, the weekly comparisons have been useful to tell me whether I have been following my exercise  intentions.  And the FitBit scale measurements of weight and BMI have been helpful for letting me know if my eating is getting out of hand.

NEW MEASUREMENTS WITH THE BASIS PEAK

I have had the Basis Peak smartwatch for a little more than a month now and have been in the process of discovering what it is good for. The device provides very interesting records of activities and sleep.  The device includes sensors for movement (an accelerometer), heart rate, skin and ambient temperature, and galvanic skin response (for measuring perspiration). It logs these measurements from my wrist 24-7 when it is not in its charging station.  The following two diagrams illustrate a typical day’s activity record and sleep record

Image may be NSFW.
Clik here to view.
Wearablle19

Taypical Basis Peak daily activity record


Image may be NSFW.
Clik here to view.
Wearablle15


Typical daily Basis Peak sleep record

The Peak software is constantly recording, except when the watch is in its charging station – for about an hour every other day. New records like the above are produced every day and the historical ones are available online or on my smartphone.  The Peak also produces a display that illustrates levels of daily activity by the hour for a week.  That looks like this:

Image may be NSFW.
Clik here to view.
Peak activitypattern

CHART A Activity during week

Depth of color represents level of activity in terms of calories burned per hour..  Note that January 7 was different than the other days; I comment later here on what happened that day..

DERIVING DAILY STRESS BIOMETRICS FROM DATA PROVIDED BY THE PEAK

Since receiving the watch, I have been very concerned about what useful biometrics might be based on this kind of data.  Based on theory, actual measurements and correlating them with personal stress events as reported below, I am coming to believe that there are easily derived  measurables that together can constitute indicators of daily and even hourly stress, and constitutional stress recovery capability. My confidence in this statement and excitement about this has continued to grow as I have tracked these measurables for 30 days now.

About resting heart rate RHR

Key to my observations are measurements of resting heart rate RHR (ref). RHR is normally taken to be an indicator of overall health, level of fitness and capability to handle stress(ref).  The lower RHR the better, assuming there is no pathology or drug use effect. And lower RHR correlates with higher heart rate variability HRV, which is seen as another important measure of fitness and ability to handle stress.  An objective of exercise training is to lower our RHR.  Beats per minute (BPM) up in the 70s are too high, and possibly indicating a pathology if RHR is up in the 80s.  RHR down in the 50s is good and in the 40s for trained athletes is even better.  This chart rates RHR to fitness, from a sports and fitness science site Top End Sports

Resting Heart Rate for MEN
Age 18-25 26-35 36-45 46-55 56-65 65+
Athlete 49-55 49-54 50-56 50-57 51-56 50-55
Excellent 56-61 55-61 57-62 58-63 57-61 56-61
Good 62-65 62-65 63-66 64-67 62-67 62-65
Above Average 66-69 66-70 67-70 68-71 68-71 66-69
Average 70-73 71-74 71-75 72-76 72-75 70-73
Below Average 74-81 75-81 76-82 77-83 76-81 74-79
Poor 82+ 82+ 83+ 84+ 82+ 80+

Note in this chart that RHR is not very sensitive to age but is quite sensitive to fitness condition.

However, RHR is not one thing: it varies day to day, according to the time of day and according to individual state of constitutional stress.  Mine normally falls in the “excellent” range for people my age 56-61BPM.  But some times when I am stressed it can be in the upper 60s.  So, the normal advice is to measure RHR right after you wake up in the morning while you are still resting in bed.  Still, it is not at all the same day-to-day.  Worse, actual measurements with the Basis Peak indicates that there is an immense catch in that you can’t reliably measure RHR in that usual way described commonly in the literature. Again normally, RHR is supposed to be determined by measuring pulse immediately after you wake up before you get out of bed.  According to my Basis Peak, that is like getting out your camera and photographing a lightning strike when you see one.  There is no stability in heart rate during that interval according to the Peak.  After waking up, heart rate instantly starts to spike upwards as does perspiration even before I am fully awake.  By the time I could start taking my pulse, it is too late.  So, if the Peak is measuring correctly, the conventional way of measuring RHR yields unreliable results.  That is the bad news about RHR, but there is also seems to be some very good news.

The next observation is that over all the 30 days of measurement so far, that there are more or less stable plateaus of heart rates every night and every morning in which heart rate remains quite constant for at least an hour and a quarter.  One plateau occurs shortly after sleep starts and the other plateau occurs just before sleep ends.  These plateau intervals, according to the Peak are during sleep and only observable when awake by examining records.  I call these;

ERHR for evening resting heart rate. In measuring this for a given evening, I access the Peak online records, take four measurements of heart rate during the just-after-going-to-sleep plateau, and average these.  These are averages over about an hour and 15 minutes, and each Peak measurement included is also an average over a number of minutes.  So, the values truly represent stable plateau values.

MRHR for morning resting heart rate. In measuring this for a given morning, I access the Peak online records, take four measurements of heart rate during the before-waking-up sleep plateau and average these.  These are also averages over about an hour and 15 minutes, and each Peak measurement included is also an average over a number of minutes.  So, the values again truly represent stable plateau values.

So, I believe MRHR gives me resting heart rate measurements that are more reliable than can be obtained the conventional way. But this is just the beginning of the good news. There are other interesting and consistent day-to-day observations.

Here are some of my current speculations.

  1. MRHR is a measure of how prepared the body is to deal with stress in the coming day, stress responsiveness. The lower the MRHR the more relaxed and refreshed the body is and prepared to deal with stress. This is based on the literature of what is normally called “resting heart rate.” As mentioned, MRHR is more accurately and consistently measured during the final stage of sleep instead of after waking when heart rate is no longer stable and invariably is spiking up.
  2. ERHR is a measure of the accumulated stress at the end of the day, accumulated constitutional stress, some of which may have been accumulated in the course of several days. The greater the ERHR, the greater is the need for sleep recuperation regeneration or other measures that restore stress responsiveness.
  3. The overnight ratio MRHR/ERHR is a measure of the degree of recuperation and regeneration in the body that has happened in the course of the period of sleep. The lower this ratio, the better. This ratio appears to be always less than 1 and averages about 90% for me over the 30 days of measurement,
  4. Another measurement of the degree of the overnight degree of recuperation and regeneration is the difference of the two beat rates ERFR-MRGR. The bigger, the better the restoration of stress response during sleep. This number appears to be always positive and ranges from near-zero for me to over 12BPM.  Over the 30 days it averages 6.15BPM.

MRHR LEVELS AND ERHR-MRHR CORRELATE WELL WITH PERSONAL STRESS EVENTS I HAVE EXPERIENCED DURING THE PERIOD OF MEASUREMENT

Here in Chart B is a graph showing my MRHR and ERHR  for the 30 days of measurements I have taken so far.

Image may be NSFW.
Clik here to view.
30days
 CHART B  Blue is night-before ERHR and red is MRHR for the same night of sleep, in BPM.

Chart B graph is a good dynamic portrayal of the three measures MRHR, ERHR and ERHR-MRHR.  The blue line shows ERHR, stress on going to sleep and the red line shows MRHR, stress the morning after just before waking up.  The gap between the red line and the blue line is a measure of overnight stress recovery ERHR-MRHR.  The bigger the gap for a given day between the two lines, the more the sleep-related stress reduction and the better.  When the gap is tiny or vanishes, accumulated constitutional stress is not worked off very well by sleep.

Now, let’s look day-to-day at what is shown in Chart B as correlated with stress events in my life.  To help you understand what is going on, I allow myself to relate some personal matters.

Up through day 10 I am living my life more or less regularly with regular sleeping and no special stress events.  Then what happens on days 10-13? MRHR peaks and overnight sleep stress recuperation almost vanishes (as measured by ERHR-MRHR being very close to zero on day 11. There is a pretty good explanation. Days 11 and 12 are Christmas Eve and Christmas Day, times of irregular schedules, heavy late meals, multiple parties round-the-clock family events, birthday parties. a certain amount of drinking, and the emergency hospitalization of my first wife. I speculate that these stress events worked not only to raise MRHR but also to compromise night-time recovery of heart rate homeostasis over sleep

It appears that I have had very good stress recuperation starting on overnights 13-17.  And the morning of the 15, MRHR was 54bpm, the lowest measured. Again, my life was getting back to regular and I was feeling good about things.

Note that on day 18 the gap ERHR – MRHR closed and stayed closed through day 21.  What happened then, what stresses led to that? Here are some explanations: A possible factor affecting day 18 may be cold stress. Before retiring the night of the 18th, my wife, granddaughter and I were out walking in the bitter cold in downtown Boston for more than an hour and a half to see the First Night celebration events and fireworks, I was thoroughly chilled, Hoever, probably the key factor applicable during this period is nutritional stredss. I had a colonoscopy scheduled for day 21, so following the orders of my gastroenterologist, I literally had to start wrecking my gut biome on day 16. That is I had to go on a no-fiber diet featuring white bread, no fresh fruits or vegetables, no oatmeal, no nuts, and empty-carbs food and drinks. I also had to quit a couple of favorite supplements – Fish Oil Omega 3s and glucosamine. You can see how this and possibly the cold stress caught up with me by looking at what happened on Chart B on day 18. This is New Years Eve where the gap ERHR-MRHR nearly vanishes again as it did a week earlier. Yes dear reader, diet does have an immediate impact on stress responsiveness!, Without the butyrate and other good responses produced by the fiber-responsive gut bacteria, there goes my overnight stress reduction capabilities

That crummy situation persisted through to prepping for the colonoscopy procedure on the eve of  day 21. The sleep on the night of the 20-21 was particularly bad due to being mostly awake running back and forth to the bathroom   You can see that night was characterized by unusually high activity, by looking at the above weekly activity of Chart A for Wed Jan 7.  Note from Chart A that I got up that day two hours earlier than normal that day to go to the hospital, and there was an hour of quiet starting at 9AM.  That is when I was under anesthetic for the procedure in the hospital.  You can see on Chart B that the accumulated impact on day 21 is that the stress indicator MRHR of 67bpm is the highest on record.  And there was virtually no stress recovery ERHR-MRHR during the stressful night before.

You can see from Chart C below how my pattern of types of sleep started to go screwy the night of day 16 with no REM sleep then, and stayed screwy through the time of the colonoscopy on day 21.

Image may be NSFW.
Clik here to view.
30dayssleepB

CHART C  Green is light sleep, red is REM sleep and blue is deep sleep according to the Peak, all in percentages.

What happened on night 16 with no REM sleep? Perhaps it was the dawnin on me then that my first wife Lois would very soon die. We have always been good friends, we share two sons, and her family and mine share holidays and events together. She has been there in my life and part of my extended family for the last 65 years.

Going backto Chart B, days 22 and 23 show recovery of ERHR- MRHR and some but not complete recovery of MRHR.  What happened then? After the colonoscopy I resumed a normal diet and had had a good 2 hour nap. That night’s sleep was long and sound with ample REM and deep sleep and you can see significant changes in the charts toward a normal pattern on day 22. MRHR/ERHR is back down to 86%. You also see normalization of the sleep chart type curves in the Chart C

The gap ERHR – MRHR Chart B for day 24 seems to be closed again, indicating no overnight stress recovery, and MRHR shows no recovery to previous lows.  What happened then? Day 23 was a time of grief stress for me, with the funeral for Lois, ceremony, family wake events, and sharing of the loss with loved ones. That night I had horrible dreams. And body stress as measured by MRHR has still not recovered to the lower rates in the 50s before the colonoscopy

Days 25-30 show a steady trend to stress response recovery with slowly lowering MRHR, with Chart C showing declining oscillations between the different types of sleep.  Day 25 shows (Chart B) improvement: the gap ERHR-MRHR starting to open up again and a little lessening of the stress as seen in MRHR.  Day 26 of Chart B shows stress recovery ERHR-MRHR is there but not up to what it could be and stress level MRHR is stubbornly refusing to drop to its lower levels of before. Why is MRHR so slow in recovery to its possible low of 55?. I can think of two possible reasons: continuing sadness associated with Lois passing away, and a slow rate of recovery of my gut biome after the colonoscopy.

You can see days 26-30 reflect continuing normalization of all patterns to resemble those of days 1-10.  The large oscillations in the different categories of sleep shown in Chart C are markedly less and it appears that the impact of the previous stress events is slowly vanishing.

In summary, looking at the timing of stress events in my life over the last 30 days and correlating these day-by-day with measurements, it indeed appears highly plausible that MRHR is a measure of how prepared my body has been to deal with stress in the coming day.  And, that ERHR-MRHR is a measure of the overnight sleep-related degree of recuperation and regeneration in resting heart rate.

This is exciting for me because we have a long been searching for measurements of constitutional stress and measurements of stress-recovery capability. We are interested in these because we would like to know what our health interventions do, if anything.  The measurements MRHR and ERHR-MRHR might provide part of the answer.  In a next phase of this research as outlined below, now having established base-line measurements for me, I will be looking to see if some simple health interventions produce noticeable effects in these indices.  I will also be researching heart rate variability HRV during this period and seeing how those measurements fit in. My gut feel is that we might be getting a handle on measuring constitutional stress and overnight stress recovery.

ABOUT HEART RATE VARIABILITY

I am proposing that MRHR/ERHR and ERFR-MRGR are measures of overnight sleep-related stress homeostasis recovery.  This is new and fairly out-of-the-box.  The usual approach for using cardio signaling to estimate constitutional stress homeostasis recovery is via measuring heart rate variability (HRV).

So I comment here on HRV.  Heart rate variability (HRV) is generally acknowledged to be a good and well-studied measure of constituitive stress homeostasis recovery capability(ref).  So if my proposal is correct, people with large HRV should show larger and/or more frequent values of ERFR-MRGR and recover from stress events more quickly.  This idea is yet to be tested.   I have just started personal HRV measurements, but do not yet fully understand how to interpret them. They are much more complex measurements than those described above.

HRV as a health index goes back to the ancient Greeks(ref) and there are 17,895 Pubmed research publications related to it.  By contrast the measures proposed here are quite new. Use of these measurements were suggested to me by a reader comment in the Basis Peak blog about the sleeping heart rate plateaus, although as far as I know I am the first to formalize and systematically use them. Nonetheless at this moment I think they should be entertained.  For one matter, given the current state of technology, the measurements proposed here can be more easily measured 24-7 than HRV.  It is not now clear that HRV measurement can be accomplished by a smartwatch or wrist band.  To measure it reliably appears to require wearing a special belt or electrode array and use of electrode gel.  Also HRV is notoriously sensitive to the state of the individual, time of day, particular breathing patterns and other variables such as whether the individual is standing, sitting, or supine.  Despite its very long history, HRV remains a controversial measurement.  And comprehending it fully and understanding how to interpret it requires a level of expertise that lay people don’t possess.  James P Watson has drafted a comprehensive blog entry on HRV and I am currently helping prepare that for publication.  It will be appearing as Part 3 of this Wearables blog series very soon.

While the Basis Peak does not now measure HRV, it does contain sophisticated second- generation heart rate sensors and could possibly do so with proper software support.    If so, this could possibly be an excellent direction for the Basis company to move toward.

BEYOND STRESS TO ASSESSING IMPACTS OF HEALTH INTERVENTIONS

The personal events reported here are stress events. I expect that the proposed stress measures MRHR and ERHR-MRHR will be equally valuable for showing constitutional state impacts for important health and longevity interventions.  I intend to extend my program of deriving biomarkers from wearables and recording of correlated experiences.   During the coming month or two, I expect continue my existing 30 day logging of Peak data and in addition::

  • To periodically measure my blood pressure using a cuff and add this to tracked biomarkers
  • To log pulse rate measurements using a sensitive sensor on a chest strap, a Polar H7,  and alternative software to validate the Peak’s HR accuracy
  • To measure and also log heart rate variability HRV using the same heart strap and Android-based software. I am currently using HRV Expert by Cardio Mood, sophisticated software created by a team in Moscow
  • To see what correlations might exist between the stress-related indices reported here and HRV indices
  • To look into alternative possible stress and other indices based on the collection of measurements made and known stress events and health interventions in my life, deriving inputs from the Basis Peak, the Polar Belt, my FitBit and possibly additional wearables
  • To experiment with variations in my health and longevity interventions to see what impacts they will have on the indices.  For example, I have started to modify my daily treadmill exercise regimen to include 7-minute segments with higher heart rates on different days, starting with instantaneous rates of115 BPM ramping up to over 130 BPM
  • I may also experiment with stopping one or more of my longevity interventions for a period of a week to see what the stress consequences are
  • To experiment with doing my treadmill exercises at different times of day to see what impacts timing of this may have
  • To network actively with other people involved with stress monitoring via sharing experience and data.  As of the moment I have started doing that with two colleagues
  • To follow this blog entry up with others reporting more hypotheses and experience.

What exciting times we live in!

Digital health – health and fitness wearables, Part 3: Heart Rate Variability: Principles and Science and Practical Measuring Devices

By James P Watson with contributions and editorial assistance by Vince Giuliano

This is the third blog entry related to electronic wearable devices capable of making personal behavioral and physical parameter measurements that bear on health and wellness and likely longevity. The first blog entry was Digital health – health and fitness wearables, apps and platforms – implications for assessing health and longevity interventions – Part 1 Flux in the market.  It provides a snapshot view of an important area of digital health – the rapidly changing landscape of consumer health and fitness wearables like smart watches, online and mobile health and wellness applications, and the associated emergence of software platforms that can integrate such applications together.  I say snapshot because the technology and market for these devices are evolving very rapidly..

The second blog entry is Digital health – health and fitness wearables, Part 2: looking for practical stress biomarkers.   It reports on initial personal experience related to identifying daily stress biomarkers that are derivable from measurements made by Vince’s Basis Peak smartwatch.  Vince reports there on the results of logging data measurable by the watch for 30 days (since expanded to 47 days), analyzing it, identifying a few simple but critical stress biomarkers, and correlating the biomarker indications with known stress events he has gone through. That blog entry describes original research by Vince, defining and testing constitutional stress biomarkers. Those biomarkers are simpler and more easily, consistently, and reliably measurable using consumer wearables technology than HRV. While grounded in a history of research having to do with resting heart rates, these biomarkers are subject to validation via additional research and testing by additional people. I share Vince’s excitement about them.

This Part 3 blog entry relates to Heart Rate Variability (HRV), a well-researched biomarker for constitutional stress recovery capability.  The entry is in two Sections:  Section I Which is a primer about the science and usages of HRV on medicine and sports, “HeartRate Variability 101,” and Section II which is about practical HRV-measuring wearables and associated sofware.  Vince and I have independently been taking HRV measurements on ourselves.   Up to this time, this personal experience has been initial and inconclusive

We will probably communicate further about the theoretical bases for Vince’s biomarkers and about our practical personal experience measuring both HRV and Vince’s biomarkers in a soon-to-be-published Part 4 wearables blog entry.

Section I:  Heart Rate Variability “101”

HRV refers to the fact that there are minor variations from one heart beat to another.  The pulses may look the same on an emergency room monitor, but if you look carefully you will see they are slightly different, e.g. the periods between the spikes are sometimes longer or shorter and other minor differences are also likely to be present.

Image may be NSFW.
Clik here to view.
HRV-1

Image source

Not only are the pulses different, but heart rate is constantly going up or down a little.  Actually this variability is a good sign because the differences between beats in a healthy person represents a complex coordination between heart actions, breathing, nervous system and other body systems.  Under conditions of high stress and some pathologies these differences are suppressed and your heart beats more or less like a mechanical metronome.  A rock steady beat (low HRV) is predictive of diseases and cardiovascular problems.

“Various models propose that HRV is an important indicator of both physiological resiliency and behavioral flexibility, reflecting the individual’s capacity to adapt effectively to stress and environmental demands. It has become apparent that while a large degree of instability is detrimental to efficient physiological functioning, too little variation can also be pathological. An optimal level of variability within an organism’s key regulatory systems is critical to health. This principle is aptly illustrated by a simple analogy: just as the shifting stance of a tennis player about to receive a serve may facilitate swift adaptation, in healthy individuals, the heart remains similarly responsive and resilient, primed and ready to react when needed(ref).”

Here are some summary facts about HRV:

  • HRV, a measure of cardiac autonomic function, is a proxy for autonomic nervous system function, one of the fundamental physiologic systems governing organismal homeostasis.
  • HRV can be measured non-invasively and safely using a diverse array of tools at little variable cost.  All you need is a bluetooth communicating heart monitor strap costing as little as $50, a smartphone and computer, and to license a HRV app which could cost as little as $1.99 or be free.  You may be able to get a measurement of it using your smartphone’s camera and an aoo.  Section II of this blog entry lists practical alternatives.
  • HRV measurement tools (including those available on personal mobile devices) already have a global footprint around the world.
  • Autonomic dysfunction, as assessed by too little HRV, is associated with the panoply of aging diseases.
  • Therapies that ameliorate the diseases of aging, reduce mortality rates, and improve longevity such as exercise, sleep, smoking cessation and caloric reduction have been shown also to improve HRV.
  • Therapies that are known to promote health outcomes such as meditation, yoga, acupuncture and other alternative medicine treatments have been shown to improve HRV.
  • Chronic stress, which has been shown to exacerbate diseases of aging, increase mortality rates, and shorten longevity, lowers HRV.
  • HRV measurements via continuous fetal scalp monitoring have been used to prognosticate fetal distress and risk of mortality since 1965.
  • HRV, blood pressure and heart rate statistics can be powerful predictors of all-cause mortaity

The March2015 publication Blood pressure and heart period variability ratios derived from 24-h ambulatory measurements are predictors of all-cause mortality reports “CONCLUSION: The 24-h BP to heart period variability ratios are powerful independent predictors of all-cause mortality, especially for elderly hypertensive patients with slow heart rate. The results support their interpretation as integrative indices of cardiovascular function and markers for cardiovascular dysregulation during low DBP states, with potential use in clinical practice.”

I think that HRV is a great concept, considering that it can now be measured so easily with a “ECG-quality R-to-R interval measuring, Blue tooth chest strap” and a smart phone.  I describe options in Section II below

The history of HRV is very venerable.  Heart Rate Variability – A Historical Perspective points out that HRV was noticed by the ancient Greeks ”  ” Archigenes (1st century AD)  apparently described eight characteristics of the pulse, including observations on its regularity and irregularity.”

A great deal has been learned about HRV since its discovery, and it has become an important tool of sports medicine and for sports endurance training.  there has been much research on the topic  Pubmed.org currently lists 18,188 research publications related to the topic. 

HRV analyses are based on measuring frequencies of heartbeat events, a variant of classical mathematical Fourier analysis.  By looking at the relative power present in different frequency bands of a heartbeat signal, a great deal can be learned about the functioning of the autonomic nervous system and general stress.  This was known back in 1981.  The publication Power spectrum analysis of heart rate fluctuation: a quantitative probe of beat-to-beat cardiovascular control then reported “Power spectrum analysis of heart rate fluctuations provides a quantitative noninvasive means of assessing the functioning of the short-term cardiovascular control systems. We show that sympathetic and parasympathetic nervous activity make frequency-specific contributions to the heart rate power spectrum, and that renin-angiotensin system activity strongly modulates the amplitude of the spectral peak located at 0.04 hertz. Our data therefore provide evidence that the renin-angiotensin system plays a significant role in short-term cardiovascular control in the time scale of seconds to minutes.”

This kind of analysis, conducted by sophisticate software, can yield much more physiologic information than a simple number which quantifies total variation.

Here are some of the things that have been learned about HRV:

  1. HRV spectrum: Respiratory Sinus Variation (High Frequency), Parasympathetic activity (High Frequency and Low Frequency), vs Sympathetic activity (Very low frequency)

As background, “The parasympathetic nervous system (PNS) controls homeostasis and the body at rest and is responsible for the body’s “rest and digest” function. The sympathetic nervous system (SNS) controls the body’s responses to a perceived threat and is responsible for the “fight or flight” response. The PNS and SNS are part of the ANS, or autonomic nervous system which is responsible for the involuntary functions of the human body.”:  The quote is from the webpage Parasympathetic vs. Sympathetic Nervous System which compares specific aspects of the two systems.

Here is a diagram of brain-heart communications that bear on HRV showing sympathetic and parasympathetic channels:

Image may be NSFW.
Clik here to view.
HRV-2

Image and legend source: A healthy heart is not a metronome: an integrative review of the heart’s anatomy and heart rate variability, “Figure 3. The neural communication pathways interacting between the heart and the brain are responsible for the generation of HRV. The intrinsic cardiac nervous system integrates information from the extrinsic nervous system and from the sensory neurites within the heart. The extrinsic cardiac ganglia located in the thoracic cavity have connections to the lungs and esophagus and are indirectly connected via the spinal cord to many other organs such as the skin and arteries. The vagus nerve (parasympathetic) primarily consists of afferent (flowing to the brain) fibers which connect to the medulla, after passing through the nodose ganglion. Credit: Institute of HeartMath.”

HRV power spectrum analysis can differentiate between HRV changes that are due to breathing (called Respiratory Sinus Variation) and HRV changes that are due to the autonomic system (ANS). 

“The normal variability in heart rate is due to the synergistic action of two branches of the ANS (the sympathetic and parasympathetic branches), which act in balance through neural, mechanical, humoral and other physiological mechanisms to maintain cardiovascular parameters in their optimal ranges and to permit appropriate reactions to changing external or internal conditions. In a healthy individual, thus, the heart rate estimated at any given time represents the net effect of the parasympathetic (vagus) nerves, which slow heart rate, and the sympathetic nerves, which accelerate it. These changes are influenced by emotions, thoughts and physical exercise. Our changing heart rhythms affect not only the heart but indirectly also the brain’s ability to process information, including decision-making, problem-solving and creativity. They also directly affect how we feel. Thus, the study of heart rate variability is a powerful, objective and noninvasive tool to explore the dynamic interactions between physiological, mental, emotional and behavioral processes(ref).”

  • Very low frequency variations (power) in HRV are primary sympathetic nervous system activity and include frequencies in the range of 0.04 – 0.15 Hz
  • Autonomic system variations in HRV include both sympathetic and parasympathetic activity, but there is a lot of overlap in the spectrum between these two divisions of the autonomic system
  • High frequency (HF) variations (power) are due to respiratory variations and are mediated by the parasympathetic system.  HF are frequencies in the range of 0.25 Hz.  HF power can be improved with exercise and deep breathing.  Because HF power (respiratory changes) is driven by parasympathetic tone, HF power is dramatically increased in endurance athletes who have a resting bradycardia (low resting heart rate).
  • Low frequency variations (power) in HRV are due primarily to the parasympathetic system and include frequencies in the range of 0.15 – 0.4 Hz.
  •  However, less sophisticated HRV analysis systems lump VLF and LF into one power spectrum.  When this is done, they typically do a ratio of LF to HF (LF/HF), which is normally about 3.6 + 0.7

Here is a graph of these spectrums:

Image may be NSFW.
Clik here to view.
HRV-3

“Figure 2. Power spectrum of HRV (PSD = power spectral density).”  Graph and legend from Heart Rate Variability Summary prepared by Ichiro Kawachi in collaboration with the Allostatic Load Working Group. Last revised 1997.   “The approach uses Fourier transforms. The HRV spectrum contains two major components: the high frequency (0.18-0.4 Hz) component, which is synchronous with respiration and is identical to RSA. The second is a low frequency (0.04 to 0.15 Hz) component that appears to be mediated by both the vagus and cardiac sympathetic nerves. The power of spectral components is the area below the relevant frequencies presented in absolute units (square milliseconds). The total power of a signal, integrated over all frequencies, is equal to the variance of the entire signal. Some investigators have used the ratio of the low-to-high frequency spectra as an index of parasympathetic-sympathetic balance; however, this remains controversial because of our lack of complete understanding of the low frequency component (which seems to be affected by centrally generated brainstem rhythms, baroreceptor feedback influences, as well as both sympathetic and vagal input).”

Another diagram is

Image may be NSFW.
Clik here to view.
HRV-4

Image source

Other publications describing the overall HRV approach include:

As you can see from the references, HRV has been of great interest in the sports medicine and training fields.

Practical conclusions:

  • We need a sensor and software that can tell us the “power spectrum” of HRV, including the HF power (0.25 Hz),  LF power (0.15-0.4 Hz) and hopefully the very LF power (0.04-0.15 Hz)
  • The ratio of LF to HF is normally about 3.7 and ideally, we need a software program that computes this as well.
  • We want to decrease sympathetic tone (VLF or LF),  increase parasympathetic tone (HF and LF),  slow down heart rate,  and increase deep breathing (HF) to improve HRV.  These are not going to be easy to do in a rat or a mouse.  But the good news is that if we are healthy, HRV measurement can guide us for doing them for ourselves

Ideally, we will simultaneously use a sensor that senses respiration, since this is such an important aspect of HRV

  1. HRV Physiology: What “drives” Heart Rate Variability?

There are several anatomic structures in the brain, the brainstem, the aorta (pressure and chemoreceptors),  carotid artery (pressure and chemoreceptors in the carotid body),  and the heart (SA node) that “drive” heart rate variability.  Stretch receptors in the muscles also “drive” HRV.

References:

Image may be NSFW.
Clik here to view.
HRV-5

Reference for diagram:  Supine vs. Standing HRV Measurement: Is one better than the other?

HRV changes with Posture: Supine vs Sitting vs Standing position

HRV dramatically changes with body position – this is something we will NOT have to deal with in mice or rats (they don’t walk upright)

In the supine position, heart rate and blood pressure are low.  In the supine position, sympathetic activity is low and parasympathetic activity is high.

Just changing from the supine to sitting position changes these parameters somewhat, which can be measured in the power spectrum of HRV (i.e. LF vs HF).  In the supine position, the HF power spectrum is high. In the sitting position, the HF power spectrum of HRV decreases from 25% to 6.2%  (p < 0.005).  In the supine position, the LF power spectrum is low.  In the sitting position, the LF power spectrum of HRV increases.  One practical implication is that if you are older with a relatively lower HF power spectrum, you might get better HRV measurements while supine.

With standing, there is a dramatic withdrawal of parasympathetic activity and an increase in sympathetic activity.  This is not surprising, considering that these autonomic refexes are necessary to maintain blood pressure to the brain, in light of the standing position (i.e. gravity)

What is surprising is that endurance exercise training increased HRV in the HF power spectrum, but did not change HRV in the HF power spectrum with subjects in the supine position (Kiviniemi, 2007).

Conclusions:

  • Because body position makes such a big difference on the HRV power spectrum and overall HRV values, measuring HRV in the same position is key to avoiding false positives and false negatives and getting consistent day-to-day HRV measurements.
  • Standing position measurements may be a better reflection of the value of physical exercise if you are an athlete with a low heart rate.  If you are older or have a higher heart rate, on the other hand, the supine position might be better.
  • Postural changes will not be a factor in mice or rats.  This is why the field is “wide open”, when it comes to doing HRV work in four legged creatures that do not walk on two legs

References:

  1. HTN, CHF, and MI => increased sympathetic afferent output: Reducing autonomic (sympathetic) afferents from the brain, via the cardiac sympathetic nerves

Patients with hypertension (HTN) and chronic heart failure (CHF) have reduced HRV due to many factors.  After a myocardial infarction (MI), there is also a decrease in HRV.  HRV can predict mortality after an MI and in patients with CHF.

  • In these patients, there is strong evidence that reduced parasympathetic activity contributes to the decrease in HRV with CHF
  • In these patients, there is strong evidence that reducing cardiac sympathetic nerve activity increases HRV
  • Major factors are salt intake, Angiotensin II, decreased endothelial NO, and increased sympathetic afferent output

I do not think HRV would improve that much by consuming plant polyphenols, but reducing the output from the CNS to the cardiac sympathetic nerves (CSNs) should make a big difference.  CSN output is a separate effect from respiratory sinus arrhythmia (RSA).  ” Respiratory sinus arrhythmia (RSA) is heart rate variability in synchrony with respiration, by which the R-R interval on an ECG is shortened during inspiration and prolonged during expiration. Although RSA has been used as an index of cardiac vagal function, it is also a physiologic phenomenon reflecting respiratory-circulatory interactions universally observed among vertebrates(ref).”

RSA is involved in the high frequency spectrum of HRV, whereas CNS activity is involved with the slow frequency HRV with a period of about 10 seconds.

Obviously exercise and sleep will help, but I do not think that yoga, meditation, or Tai Chi is very feasible in mice or rats.  We may be able to reduce CNS output with an RF interference electrode that could be “trained” to inhibit CNS output.  In rodents with aging that have low eNOS activity and low nitric oxide levels in their blood vessels, chemical sympathectomy with 6-hydroxy dopamine restores HRV. We may want to do this as well.

References:

Conclusions:

  • Controlling HTN is clearly important for keeping HRV high.
  • There may be a possibility of doing a  “chemical sympathectomy” with 6-hydroxy dopamine in our “reference mammals.”
  1. Reducing Renin-angiotensin signaling

There is some evidence that reducing Renin Angiotensin II signaling (RAS) has a beneficial effect on HRV,  This primarily improves low frequency power of the HRV power spectrum,  Many studies of sleep have shown that Angiotensin II levels decrease at night in a circadian fashion (no surprise!).

At night, there is an increase in baroreceptor reflex sensitivity, which is the highest during dreaming.  “Baroreceptors (or archaically, pressoreceptors or baroceptors) are sensors located in the blood vessels of all vertebrate animals. They sense the blood pressure and relay the information to the brain, so that a proper blood pressure can be maintained(ref).”  With CHF, the circadian changes in HR and the baroreceptor reflex (BRS) is blunted.  This explains part of the mortality of CHF that is independent from LVEF

Angiotensin Type I receptors are the main way that this harmful effect of Ang II is mediated.  This may be why the ATR1 receptor blockers seem to have a longevity effect. See our blog entry ACE and Angiotensin II: The “Double Agents” that Play Multiple Roles in the Molecular Story of Life.

References:

Here is a diagram of what happens with Renin-Angiotensin system blockade and HRV.

Image may be NSFW.
Clik here to view.
HRV-6

Reference for diagram: Power spectrum analysis of heart rate fluctuation: a quantitative probe of beat-to-beat cardiovascular control

Conclusion:  Blockade of the Renin-Angiotensin system increases the area under the curve of the low frequency HRV power spectrum.  Using ATR1 blockers appears to be the best way to do this.

  1. Exercise and HRV – HF power increases, LF power decreases in endurance athletes. Supine position with exercise.

Endurance/Aerobic exercise

Endurance, aerobic exercises increases HRV in the high frequency (HF) spectrum (respiratory sinus arrthymia) but actually lowers the low frequency (LF) power spectrum.  Endurance athletes therefore have higher HF power spectrum and lower LF power spectrum

This drop in LF power spectrum may represent an imbalance between parasympathetic activity and sympathetic activity, due to the resting bradycardia seen in endurance athletes.  This resting bradycardia is due to increase in parasympathetic outflow.

Weight lifting exercise (supine position)

Because the sympathetic system signaling is dramatically decreased when the body is in the supine position, weight lifters working out in on a bench in the supine position display a dramatic increase in HRV in the low frequency (LF) power spectrum.  This means that there is a decrease in sympathetic activity when in the supine position.

References:

  1. Sleep and HRV -

Sleep has a beneficial effect on HRV.  At night, Angiotensin II levels go down, increasing HRV.  Baroreceptor reflex sensitivity goes up at night.  It is the highest during dreaming – REM sleep.

Here is a diagram showing typical behaviors of heart rate, the parasympathetic and the sympathetic nervous systems during wakefulness, non-REM and REM sleep.

Image may be NSFW.
Clik here to view.
HRV-7

Image and legend source  “(A) Modulation of cardiac activity during wakefulness: reflex loops [baroreflex (BaroR), respiration (Resp), chemoreflex (ChemoR)] including brainstem centers (BS) and central autonomic network including midcingulate cortex (MCC), insula (INS), amygdala (AMY) contribute to cardiac activity, leading to increased heart rate (HR), increased sympathetic activity (SNS), and decreased parasympathetic activity (PNS). (B) Modulation of cardiac activity during non-REMS: The drop in brain activity, with predominant contribution of reflex loops on ANS activity, leads to decreased HR, with parasympathetic predominance, and decrease in sympathetic modulation. (C) Modulation of cardiac activity during REMS: autonomic cardiac regulation is shared between central control in relation with the insula and amygdala and homeostatic control of the cardiovascular system by reflex loops, leading to decreased HR with sympathetic predominance and decreased parasympathetic activity. Red circles indicate increase and blue circles decrease in autonomic cardiac activity.“

Reference: Reflex Regulation of Arterial Pressure during Sleep in Man 1969

HRV has been suggested to be an excellent tool for the analysis of sleep and for distinguishing between healthy and pathological sleep.  See these additional references.

Conclusions: 

  • Baroreceptor sensitivity can be rapidly “reset” at night.  This is very important for controlling blood pressure
  • HRV results are likely to be different during during REM and non-REM sleep
  • HRV can be  a useful tool for distinguishing between sleep disorders.
  1. Oxidative stress and HRV

Rodents have accelerated telomere shortening that is NOT due to replicative senescence,  This means they probably have a lot of oxidative stress.  Although I could not find any articles specifically linking oxidative stress to HRV, I found some articles that showed that ROS-producing chemotherapy (alkylating agents) decreased HRV

Polyphenols and MitoQ may help some, but I think the following would be better:

  1. Bucky Balls – See our blog entries on C60 fullerenes(ref)(ref),
  2. Methylene Blue(ref)(ref)(ref), and
  3. a few of the other potent mitochondrial-specific antioxidants like MitoQ that change the membrane potential across the inner mitochondrial membrane.

I speculate that these could potentially make a huge difference in HRV

References:

  1. Gut bacteria/Celiac disease

Some fascinating information is coming out about the effect of wheat intake in patients with celiac disease.  Patients with celiac disease have a much lower HRV than controls.  Also, patients with celiac disease have less HRV with deep breathing.

  • 20% of the patients with celiac disease had parasympathetic dominance, whereas
  • 36% of the patients with celiac disease had sympathetic dominance
  • 44% of the patients did not show parasympathetic or sympathetic dominance

Measurements can show decreases in HRV with all three of these groups of celiac disease patients.

Reference: Disturbances of autonomic nervous system activity and diminished response to stress in patients with celiac disease 2014.

  1. Stress and Glucocorticoids - glucocorticoids, epinephrine (from adrenal gland), and norepinephrine (from sympathetic nerves) all decrease HRV

Stress reduces HRV by several hormones and neurotransmitters, including glucocorticoids, epinephrine, and norepinephrine.  Glucocorticoids (cortisol, synthetic steroids, etc.) decrease heart rate variability.   Glucocorticoids also increase systolic blood pressure.  The mediator of this is impaired hydrogen sulfide signaling.

References:

High sodium diet - This decreases HRV

A high sodium diet decreases HRV,  The exact mechanism is not clear, but it probably involves blood pressure changes and changes in nitric oxide (NO) synthesis.

Reference:  Contribution of nitric oxide to arterial pressure and heart rate variability in rats submitted to high-sodium intake 2001

  1. Gasotransmitters – Nitric oxide (NO), Hydrogen Sulfide (H2S), and Carbon Monoxide (CO)

Much has been learned about HRV from patients with congestive heart failure (CHF) and patients with coronary artery disease (CAD).  In CHF, there is a dramatic decrease in heart rate variability (HRV) and an increase in low frequency systolic blood pressure variability (SBPV).  CHF also results in increases in breath interval variability (i.e. snoring, sighing, etc.), and an increase in apneic episodes (like in obstructive sleep apnea).

These effects in CHF are thought to be mediated by the carotid body (CB), which senses oxygen levels.  Hypoxia causes an increase in CB signaling.  The molecular mediators of these changes in CHF include sympathetic dysregulation, renin-angiotensin dysregulation, increased atrial naturetic peptide (ANP), increased brain naturetic peptide (BNP), and increase in Hypothalamic-pituitary-adrenal axis hormones (cortisol, epinephrin, aldosterone).

However, the most recent molecular mediator discovery in CHF is the gasotransmitters – they play a major role in the pathogenesis of CHF.  These gasotransmiters and their dysregulation plays a major role in the decrease of HRV that occurs with these diseases.

Nitric Oxide is “good”, but NO dysregulation is “bad- acute exogenous NO administration is ‘good”, but chronic exogenous NO administration results in “nitrate tolerance”.

Inhibition of endogenous NO production decreases HRV in some circumstances.  In others, inhibition of endogenous NO production increases HRV

Nitric oxide has “good” and “bad” effects that are very hard to understand.  Nitric oxide is thought to play an important role in the tonic control of carotid body (CB) chemosensitivity.  Both eNOS and nNOS are present in the CB.  NO inhibits CB activity by suppressing the CB chemoreceptors during normoxic periods.

Basal NO production, eNOS and nNOS expressio in the CB are depressed with CHF.  Thus there is no inhibition of the CB in CHF, due to a decrease in NO.

Part of the Paradox of NO is due to the differences between endogenous production of NO and exogenous production of NO.  In addition, part of the paradox is due to the differences between “acute” exogenous NO administration vs “chronic” exogenous NO administration.

  • Acute NO administration reduces sympathetic activity and increases vagal outflow
  • Chronic NO administration results in a loss of these effects and the development of “nitrite tolerance”

The easiest way to understand this is that “nitric oxide acts at distinct levels in the autonomic system to control cardiac rate, with opposing effects at different sites

In general, endothelial nitric oxide has mostly “good effects.”  For instance, neuronal nitric oxide inhibition decreases HRV 3-fold by inhibiting vagal stimulation,  whereas increased neuronal NO increases HRV.  For instance, endothelial Nitric oxide synthase 3 increases NO after an MI and this increases survival from an MI – this also increases HRV

  • Nitric oxide increases in response to a high sodium diet – this reduces HRV.
  • With CAD, nitric oxide levels from eNOS fall.

References

Conclusions:  Administration of exogenous NO (acutely for a short period of time) may increase HRV, whereas chronic administration would not.  Administration of an exogenous NO donor (such as L-arginine) would also increase HRV, but probably not continuously on a permanent basis.

Hydrogen Sulfide is “good”, but dysregulation of H2S is “bad”H2S is involved with carotid body chemoreceptor sensitivity and with breathing control

Inhibition of hydrogen sulfide restores normal breathing, but increased hydrogen sulfide increases survival after an MI.  Hydrogen sulfide also increases antioxidant gene expression via an Nrf2-mediated pathway.  H2S product by the enzyme CSE is not decreased in CHF – CSE inhibition with CHF reduces carotid body afferent responsiveness

There are a lot of puzzling paradoxes about H2S that I do not understand.

  • Hydrogen sulfide signaling upregulates antioxidant gene expression by the transcription factor, Nrf2 – this is a “good thing”
  • Hydrogen sulfide also increases survival after an MI via a nitric oxide synthase 3 dependent mechanism – this is a “good thing”
  • However, H2S production by the carotid body chemoreceptors can also have “bad consequences”
  • H2S is known to be an important signaling molecule in the carotid body (CB). H2S is synthesized by cystathionine gamma-lyase (CSE) in the CB
  • Carbon monoxide (CO) inhibits CSE, thereby increasing HRV.
  • Exogenous CSE inhibitors such as PAG also increase HRV
  • Evidently in response to hypoxia, hydrogen sulfide signaling reduces HRV and causes abnormal breathing (apnea and increased breath intervals)
  • Increased hydrogen sulfide signaling from the carotid body hypoxia sensor is part of the pathology of CHF.
  • These effects in CHF are thought to be mediated by the carotid body (CD), which senses oxygen levels.
  • In CHF, there is an increase in carotid body (CB) chemoreceptor outflow due to hypoxia.  The “signaler” is the gasotransmitter, hydrogen sulfide
  • Thus CHF results in increased CB hydrogen sulfide synthesis, which reduces HRV. increases breath interval variability (BIR), and increases apneic episodes
  • Inhibitors of hydrogen sulfide synthesis (by cystathionine gamma-lyase) like the drug di-propargylglycine (PAG) inhibit H2S synthesis by the CB.  In rodents, this reduced the apnea index by 90%, reduced breath interval variability by 40-60%,

Hydrogen sulfide signaling is a major reason why HRV decreases with aging.

References”

Conclusion:  Since CSE is not down regulated in CHF, hydrogen sulfide probably plays a supportive role, rather than a causal role in CHF.  I am not sure if we want to inhibit it or activate hydrogen sulfide signaling.  In CHF, we probably want to inhibit it.  Under normal conditions, I am not sure. If we want to improve breathing, however, we will need to inhibit H2S production.

If we want to increase Nrf2 gene expression, however, we will want to activate H2S production or give exogenous H2S.  To improve HRV, we may need to use a H2S synthesis inhibitor like PAG to down regulating H2S signaling from the carotid body

Carbon Monoxide is “good”, but dysregulation or too much CO is “bad” - CO production in the CB is due to HO-2 gene expression and is reduced in CHF

Carbon monoxide (CO) is the 3rd and last gasotransmitter to be discovered.  CO is very important to health.  The first case of a human to have a gene mutation in HO-1 (heme oxygenase-1, the enzyme that synthesizes CO) died at age 6.  HO-1 gene knock-out models in mice and rats also die at a young age.  It came as a surprise to many that the body synthesizes CO – to be exact, it makes 16.4 micro moles per hour of CO – all from heme breakdown.  The total amount of CO produced per day is 12cc (see ref below)

In the pulmonary artery, CO relaxes the pulmonary vasculature under normoxic conditions.  In the carotid artery, CO regulates (decreases) the sensitivity of the carotid body to hypoxia.  However, CO plays a much greater systemic role in the body – CO is synthesized during heme breakdown by heme oxygenase 1 (HO-1), heme oxygenase 2 (HO-2), and heme oxygenase 3 (HO-3).

HO-1 is the inducible form of the enzyme and is primarily found in the spleen, but is also expressed in other tissues in lower amounts.  The spleen is the only organ where HO-1 overpowers HO-2.  HO-1 is NOT expressed in the carotid body (CB).  HO-2 is the constitutively activated form that is mostly expressed in the brain and testes – it is expressed in the carotid body (CB).  HO-3 is another constitutive form of the enzyme that has only been found in rat tissues so far.

With CHF, the expression of the constitutively activated HO-2 in the CB is decreased.  This means there is less CO produced by the CB with CHF.

References:

Conclusions:

  • Exogenous administration of low dose CO (acutely only) may have a beneficial effect on HRV, since this inhibits CSE and thereby H2S production
  • Exogenous administration of low dose CO (acutely) also induces the enzyme that makes endogenous CO, HO-1.
  • For this reason, exogenous CO administration should have both a direct and indirectly beneficial effect on HRV, but no one has measured this yet
  1. Chronic Hypoxia, Rapid ascent to altitude, High Altitude Acclimatization, and High Altitude Training in Athletes

Chronic hypoxia does not affect heart rate that much, but it has a dramatic negative effect on HRV.  This is why obstructive sleep apnea and COPD are so bad for health.

Rapid ascent to altitude decreased HRV in both the LF and HF power spectrums. In these individuals who ascended rapidly to altitude, 48% of them developed acute mountain sickness (AMS).  This decrease in HRV happened in individuals who developed AMS and in those who did not develop AMS (no difference).

Acclimatization has been reported to have conflicting results on HRV.  One study found that acclimatization at low altitudes (2,000-3,000 meters) and high altitude (5,000 meters) did not modify HRV in any statistically significant fashion.  Another study done in tourists at 2,700 meters and at 3,700 meters showed a decrease in HRV at both altitudes.  This decrease in HRV occurred in both the HF and LF power spectrums. At 3,700 meters, the sympathetic system was dominant over the parasympathetic system.  Another study done in high altitude mountaineers  found that at sea level, postural changes are mainly controlled by increases in sympathetic tone with sitting and standing,  whereas at high altitude, postural changes are mainly controlled by a decrease in parasympathetic activity and not an increase in sympathetic activity (5,000 meters).  However, high Altitude does not necessarily impair HRV, even though there is continuing exposure to low oxygen tension.

In trained Andean participants, completing a marathon at 4,220 meters elevation transiently increases sympathetic predominance of HRV after the marathon for less than 1 day.  Then their HRV returns to a healthy, baseline where parasympathetic tone dominates over sympathetic outflow.

References:

Conclusion:  I do not see any way how manipulating atmospheric pressure by reducing it would help HRV

  1. Air pollution

Air pollution has been shown to decrease HRV (that’s bad!)  The best study on this was done at Harvard’s School of Public Health.  They found that pollution in general reduced HRV and Blood Pressure Variability (BPV), but that ozone (O3) and moving averages of particulate pollution in the air (PM2.5) were most associated with a decrease in HRV and BPV.  The decrease in standard deviation of normal-to-normal HRV (SDNN) and low frequency power spectrum (LF) were greatest in diabetics.

FReference:  Effects of air pollution on heart rate variability: the VA Normative Aging Study.  A new study dated January 15 2015


Section II:  Consumer HRV Hardware and Software 101

The marketplace is offering a wide variety of consumer hardware and software options for measuring HRV, particularly newer options where bluetooth measuring devices link to smartphones with apps that link to personal HRV measurements databases on the web.  We list some of these options here.

A.   HRV Hardware

Chest Strap systems:

Chest straps are the most well-developed devices that give “ECG-quality R-to-R interval measurements” and wirelessly communicate to your smart phone.  The trend is to go to Bluetooth straps, rather than the old ANT+ standard that the fitness HR straps used in the past.  A new Bluetooth standard used in some belts, Bluetooth® 4.1, the latest standard, is a low energy one that increases battery life dramatically.  This low energy Bluetooth allows you to “sync” your HR strap to a smart phone or tablet PC.    Here is a list of several Bluetooth straps and a few ANT+ straps that can be used for HRV.

Polar H7 Bluetooth strap – Bluetooth 4 low energy

hardware compatibility – compatible with either iPhones (IOS) or Android phones (Android 4.3 or greater)

  • transmits the data in real time to a phone or to a Polar watch (like the M400)
  • software compatibility – not compatible with Apple Healthkit, but compatible with over 50 smartphone apps
  • onboard memory – no
  • accelerometer/pedometer – no
  • battery life: 350 hours – need to unsnap device from belt after use to get this.
  • cost – $50-70
  • nice feature – can wirelessly connect to a lot of gym equipment.
  • Both Vince and I have been using this sensor for our personal HRV measurements.

Wahoo TICKR heart rate monitor strap  – this is the entry level Wahoo strap – it has both ANT+ and Bluetooth wireless links

  • phone compatibility – compatible with either IOS (iPhone 4S or later) or Android phones (Android 4.3 or later version)
  • software compatibility – compatible with Apple Healthkit and over 50 Smartphone apps
  • onboard memory – no
  • accelerometer/pedometer – no
  • battery life: 350 hrs
  • cost – $58-70
  • nice feature – has a free 8 week Wahoo Fitness Burn and Burst Training app

Wahoo TICKR Run strap – this is Wahoo’s more advance version that has an accelerometer built into it – its wireless links also have both ANT+ and Bluetooth 4.0

  • phone compatibility – compatible with either IOS (iPhone 4S or later) or Android phones (Android 4.3 or later version)
  • software compatibility – compatible with Apple Healthkit and over 50 Smartphone apps
  • onboard memory – no
  • accelerometer/pedometer – yes
  • battery life: 350 hrs
  • cost – $68-80
  • nice feature – has a Wahoo Running Smoothness Metrics program/feature

Head-to-head review of Polar H7 and Wahoo TICKR straps – BATTLE! – Wahoo Fitness TICKR RUN Heart Rate Monitor vs Polar H7 Heart Rate Sensor + Polar Stride Sensor

60beat BLUE strap – Bluetooth 4 low energy

  • hardware compatibility – compatible with either iPhones (IOS) or Android phones (Android 4.3 or greater)
  • software compatibility – not compatible with Apple Healthkit, but compatible with over 50 smartphone apps
  • onboard memory – no
  • accelerometer/pedometer – no
  • cost – $35-60
  • nice feature – comes with several free apps called MapMyRun, RunMeter, Endomondo, LogYourRun, and RunKeeper

Cardiosport Bluetooth SMART strapBluetooth 4.0 low energy

  • hardware compatibility – compatible with either iPhones (IOS)
  • not compatible with Android phones
  • software compatibility – not compatible with Apple Healthkit, but compatible with over 50 smartphone apps
  • onboard memory – no
  • accelerometer/pedometer – no
  • cost – $35-60
  • nice feature – comes with several free apps called MapMyRun, RunMeter, Endomondo, LogYourRun, and RunKeeper
  • Review of this strap: ithlete Cardiosport Bluetooth SMART Heart Rate Monitor Strap – In Depth Review

smartLABhBeat HRM strap – Bluetooth 4.0 low energy with Bluetooth Smart technology

  • phone compatibility – compatible with iPhones or iPads
  • Works with several APPs that support HRM on iOS, Android and Windows mobile devices
  • software compatibility – not compatible with Apple Healthkit, but compatible with over 50 Smartphone apps
  • onboard memory – no
  • accelerometer/pedometer – no
  • battery life: rechargeable battery with 26 hrs battery life
  • cost – $39-40 (big price drop recently)
  • nice feature – cheap!

Zephr HxM Smart HRM strap – Bluetooth 4.0 low energy (no rechargeable battery on this model)

  • phone compatibility – compatible with Android phones (Android 4.3 or later version), and with Windows 8 phone devices
  • not compatible with iPhones or iPads
  • software compatibility – not compatible with Apple Healthkit, but compatible with over 50 Smartphone apps
  • onboard memory – no
  • accelerometer/pedometer – no
  • battery life: rechargeable battery with 26 hrs battery life
  • cost – $50-60
  • nice feature – waterproof up to 1 meter

Zephr HxM BT strap – Bluetooth 4.0 low energy and a rechargeable battery

  • phone compatibility – compatible with Android phones (Android 4.3 or later version) and Windows phones
  • no compatible with iPhones or iPads
  • software compatibility – not compatible with Apple Healthkit, but compatible with over 50 Smartphone apps
  • onboard memory – no
  • accelerometer/pedometer – no
  • battery life: rechargeable battery with 26 hrs battery life
  • cost – $60-80
  • nice feature – charging cradle to recharge the battery (most straps do not have rechargeable batteries)
  • review of this strap:  Keep the beat with the Zephyr hxm bluetooth heart rate monitor

4iii Innovations V100 viiiva strap – ANT+  and  Bluetooth Smart wireless linkages

  • phone compatibility – compatible with iPhones
  • not compatible with Android phones
  • can send real time info to ANT+ watches or bicycle computers
  • software compatibility – compatible with any iPhone apps
  • onboard memory – no
  • accelerometer/pedometer – no
  • battery life: 200 hrs
  • cost – $80
  • pros – has both ANT+ and Bluetooth technology
  • cons – not compatible with Polar devices and doesn’t work with legacy Bluetooth standard
  • online review of this strap: 4iiii’s Viiiiva ANT+ to Bluetooth Smart Bridge & Heart Rate Strap In-Depth Review

Pear Sports Mobile Training Intelligence strap – This one of those that can be used with either iPhone or Android phones

  • Bluetooth 4.0 low energy with Bluetooth Smart technology
  • phone compatibility – compatible with iPhones, iPods,  and iPads (4 or later model)
  • compatible with Android phones
  • software compatibility – not compatible with Apple Healthkit, but compatible with over 50 Smartphone apps
  • onboard memory – no
  • accelerometer/pedometer – no
  • battery life: 400 hrs
  • cost – $80-100
  • optional foot pod
  • Marketed as a comprehensive training system.  Real-time coaching while exercising is via heart rate feedback.
  • Nice features – 1. Realtime Audio training coaching, 2. comes with PEAR “Stride” earphones with Earlock ear pieces

Online reviews:

Under Armour Armour39 strap – ANT+

  • phone compatibility – compatible with iPhones, iPods,  and iPads (4 or later model)
  • not compatible with Android phones
  • software compatibility – not compatible with Apple Healthkit, but compatible with over 50 Smartphone apps
  • onboard memory – no
  • accelerometer/pedometer – no
  • battery life: 400 hrs
  • cost – $75-80
  • nice feature – transmits your data in “real time” into MapMyFitness Apps, or into the Armour39 App, or to the Under Armour Watch

Jarv Premium Bluetooth 4.0 strap – Bluetooth 4.0 low energy with Bluetooth Smart technology

  • phone compatibility – compatible with iPhones, iPods,  and iPads (4 or later model)
  • Works with most Android 4.3 or later devices
  • Software compatibility – not compatible with Apple Healthkit, but compatible with over 50 Smartphone apps
  • onboard memory – no
  • accelerometer/pedometer – no
  • battery life: 400 hrs
  • cost – $35 (big price drop recently)
  • nice feature – comes with several free software apps – MapMyRun, RunMeter, EndoMondo, LogYourRun, and RunKeeper
  • Plus, it is cheap!

Xyzer HRM strapBluetooth 4.0 low energy with Bluetooth Smart technology – one of those that are both iPhone and Android compatible

  • phone compatibility – compatible with iPhones, iPods,  and iPads (4 or later model)
  • not compatible with Android phones
  • software compatibility – not compatible with Apple Healthkit, but compatible with over 50 Smartphone apps
  • onboard memory – no
  • accelerometer/pedometer – no
  • battery life: 400 hrs
  • cost – $29-40 (big price drop recently, perhaps the cheapest belt sensor system)
  • nice feature – compatible with either phone platform

Ear and Finger sensor systems

These systems are not as well-developed (none are wireless) or are not as “user friendly.”  However, these have been around longer and the software that comes with them seems to be better than that for the chest straps.

HeartMath earlobe sensors – 6400 Inner Balance, EmWave Pro Model 6030 – HRV sensor that mounts on earlobe.  A $299 stand-alone package with an earbud and hand-held monitor

The Journey to Wild Divine finger sensors (DeePak Chopra endorsed) – Biofeedback device that senses HRV from 3 finger sensors

Tink Wellness Sensor – this is a finger sensor that picks up HRV, respiratory rate, and pulse oximetry (blood oxygen saturation) – a combination not now available in chest or wrist sensor systems

Wrist-based HRV sensors

Including  the “Breathing Coach” (W/Me) and the two 24/7 Automatic activity/sleep trackers (Reign and Basis Peak)

There is a growing interest in developing a HRV device that automatically tracks both activity and sleep with no straps, no wires, and no need to have a phone constantly linked.    This currently means that the device must be wrist mounted and have an internal data storage feature that can be downloaded to a smart phone.    If such a device is going to be created in the future, the future is already here!

There are at least three devices that fit into this category.

The first one mentioned here is not yet for sale – it is a proposed product created by a Kickstart, crowd-funded company.  This device is not a 24/7 device, from what we know,  The second and third ones mentioned here are both “24/7 activity/sleep trackers” that are waterproof and stylish.  The Jaybird Reign is a wrist band, whereas the Basis Peak looks more like a watch.

The Jaybird Reign measures HRV, whereas the Basis Peak does not, however, there is hope that the new owner of Basis Peak (Intel) will add this feature.

W/MeThe Wrist band HRV monitor designed as a breathing coach

This is a Kickstarter company that has been funded with $140,000 of crowd sourcing money.        They don’t yet have the wrist sensor in the market, but their prototypes and marketing information look great!

  • Technology:  a wristband style of wearable
  • Claims to state, your agility score, and your autonomic system age

What it does for you:  this is a breathing coach program

  • See the Kickstarter writeup Finally, a wearable device that can improve your life.  A  HRV sensor sends your measurements via Bluetooth to your phone.  The info is then downloaded into a spectrum analyzer, which then figures out your mental state and helps you as a breathing coach.
  • compatibility:  iOS with Bluetooth 4.0 (iPhone 4S or higher)
  • battery:  rechargeable via USB port.  7 day battery life
  • cost: $55 for early access.  $139 once it comes out
  • features: no chest strap, ear lob device, or finger device needed
  • what it tells you:  It purports to calculate your mental state
  • pros: very modern and stylish
  • cons:  Based on limited existing capitaliation, company must be in a very early stage.  Unclear if the device  delivers on its marketing promises.  Unclear if it gives you any info on HRV power spectrum (i.e. numbers on LF, HF, etc.).  Unclear if and when the product will actually hit the marketplace.  “Tis many a slip twix the cup and the lip.”

Jaybird ReignThe Wrist band HRV monitor, Activity tracker, Sleep monitor, with unique feedback features for sleep decision making

  • This device is from Austrailia and is already on the market that targets HRV for training recovery decisions (i.e. a rest coach) and for deciding how much sleep you need (i.e. a sleep coach)
  • This is a stand-alone wrist band HRV monitor that has been designed primarily to help you determine when your body is fatigued and should rest – They call it the “Go-Score”, which is when you have fully recovered and are ready to do strenuous workouts again.  It also tells you how much sleep you need and whether your sleep was fitful.
  • compatibility: iOS with Bluetooth 4.0 (iPhone 4S or higher) now
  • Android software will be available in 2015 for all Android 4.3 or higher devices
  • battery life:  Lithium batter that lasts 5 days
  • water?  lifetime waterproof warranty
  • cost: $180-200
  • features: no chest strap, waterproof, stylish magnetic pin-locking technology for strap
  • more info here.
  • Pros:  The Jaybird Reign won the Outdoor Retailer 2014 “Gear of the Show” award
  • It also won the “Best Digital Health and Fitness Product” award at CES 2014
  • It also won SlashGear’s “Best Wearable Tech” award at CES2014
  • Cons:, does not display HRV power spectrum, missing many practical features commonly available such as a display, alarms, “Can’t see trends over time. Doesn’t track heart rate. No calorie-logging system. Rudimentary mobile app. No desktop or Web app. No integration with third-party apps. No real display; LED indicators difficult to read. Difficult to fasten. Sensor pops out easily. So-so battery life.(ref)”
  • online review: From PC magazine   Rated only fair because of negatives just listed.

Basis Peak Ultimate Fitness & Sleep TrackerThe Wristwatch HR monitor (does not measure HRV at this time), Activity tracker, and Sleep monitor that also has a skin temperature sensor and a sweat sensor- Bluetooth 4.0

  • This is a second-generation wristband devices made by a company called Basis that was recently cquired by Intel Corp,
  • It is a specialized “smartwatch” designed as a “24-7 automatic fitness and sleep tracker”
  • The sensors it embodies include a 24-7 continuous heart rate monitor, an accelerometer, a galvanic skin resistance sensor, and skin and ambient temperature sensors
  • Since the Basis company is now owned by Intel, they may possibly update the device with software or hardwired versions that offer HRV
  • It can measure stress and various stages of sleep using its accelerometer – measures REM sleep, light sleep, and deep slee
  • The constitutional stress biomarkers proposed by Vince in the Wearables Part 2 blog entry were based directly on data from his Basis Peak
  • compatibility: iOS with Bluetooth 4.0 (iPhone 4S or higher) now
  • Android software for all Android 4.3 or higher devices
  • battery:  rechargeable battery with magnetic charging cradle, 4 day battery life (Vince gets only 3 days)
  • screen: touch screen
  • cost: $200
  • water?:  waterproof to 5 atmospheres
  • features: no chest strap, waterproof, stylish magnetic pin-locking technology for strap
  • more info: https://www.mybasis.com
  • Pros:  The Basis Peak watches have won several editor’s choice awards, including PC magazine
  • A recent Basis Peak software upgrade allows the Peak to show smartwatch-type notifications originated from the companion smartphone
  • It zeroes in on habits, rather than raw numbers.
  • Excellent web interface
  • Cons:  It does not measure distance traveled, stairs climbed, breathing, oxygen saturation or many other biomarkers measurable using wearables..  It also does not now measure heart rate variability
  • Online review of the Basis Peak

A comparison on the Jay Bird Reign and the Basis Peak can be found here, including “The top 20 reasons for the Basis Peak.”

Vince’s comments;  See the Part 1 and Part 2 Wearables blog postings for my experience with the Basis Peak and what I believe are good constituitive stress biomarkers that can be derived from its measurements.  I find these very exciting and believe that they could be practically superior to HRV in practice by virtue of their stability, reliability and ease of measurement. It looks like the Jaybird Reign may be a good competitor to the Peak, and currently possibly superior in reporting in some respects.   As I point out in these blog entries my impression is that the Basis Peak offers an excellent hardware platform but that its software may not yet come close to providing the biomarker measurements that might be derived from its sensor outputs.  In particular, I strongly suspect its second-generation heart rate measurement sensors could be used to create HRV measurements if the Basis company saw this as an objective.  I mention also that a few competing products have just come on the market that are promoted as  generating measurements similar to those obtainable from the Basis Peak.  I am thinking particularly of the FitBit Charge HR, the Fitbit Surge and the Jawbone UP3.  The above comments regarding the Peak may also apply to these products.

Using the iPhone or Android phone camera to measure HRV

An iPhone camera can be used as a photoplethysmography (PPG) device.  This means it detects changes in blood volume during the cardiac cycle. Using the iPhone camera and the PPG technique, you can calculate HRV

Here is an article on this:  Heart rate variability using the phone’s camera.

The correlation between an iPhone camera based HRV monitor and a Polar H7 is very close (0.97).  Here is the diagram to show this:

Image may be NSFW.
Clik here to view.
HRV-8

  • This approachbasically eliminates the need for any heart rate sensor hardware
  • You just put your finger up to the iPhone camera and it senses your HR and calculates your HRV
  • The measurements may not be that accurate, but clearly the simplest, easiest, and cheapest way to measure HRV
  • Here are some places you can download an app to do this

Azumio Instant Heart Rate Pro is also available for use with selected Android phones on Google Play

More Sophisticated Sensors

These devices are much more sophisticated than the above devices.  They have more sophisticated capabilities, such as measuring respiration (breathing), skin temperature, and, reportedly, HRV.

Zephyr BioModule BH3 removable sensor system - This is a strapBluetooth 4.0 low energy strap that is much more sophisticated than the straps above, for Android devices

  • The sensor is removable and can be mounted on a strap, a compression shirt with a pocket for the sensor, or a loose fit shirt
  • The sensor has a respiration sensor, a 3-axis accelerometer, and HR/HRV sensor
  • Sold as a performance monitoring device for serious athletes

Vital Connect’s Health Patch – This is a strapless Bluetooth 4.0 low energy patch

  • It can measure HR, HRV, respiratory rate, skin temperature, body posture, steps, sleep staging
  • However, they do not have software out for this yet, so you have to use Sweetbeat’s software, which is what I am using now with the Polar H7 chest strap.
  • See the Sweetwater HRV site and the Vital Connect store site

Actiheart system by Camntech – This is a strapless (or strap) system that can be stuck on the skin with standard ECG electrode patches

  • One electrode goes over the sternum and the other electrode is 10 cm away over the “V5″ or “V6″ position of an ECG (this gives better data)
  • It can also be used with a strap and can record heart rate and activity for up to 21 days.
  • Unfortunately,  it is not a Bluetooth 4.0 low energy system
  • It can also record “Inter-beat-Interval”, which is used to calculate HRV.  Here is some more info on this:

HRV Software

Software for Bluetooth HRV devices -

BioForce – This is a highly rated HRV app for Blue tooth HR sensor devices – Android

Senseview – This is a free software that is designed for the Android 4.0 dual core processor

Sweetbeats – This one is $4.99.  It is the one I am using.  Currently Apple iOS only but an Android version has gone into alpha testing.  My rating: not that good

ithlete - This one is expensive.  Android and Apple iOS

Heart Rate Variability Logger – this one is free – Apple iOS

SelfLoops HRVthis one is free  – Apple iOS

HRV trackerthis one is also free – Apple iOS

Heart Rate + Cardiorespiratory Coherence – this one is $4.99. My rating: from what I can see, this may be  the best one out there

MyCalmBeat – this one is free

Buddha Mind – this one is $2.99 – Apple iOS. My Rating: I like this one, from what I have read.  There are 120,000 downloads, but 58% say there are problems with it

Expert by CardioMood – $1.69 – Android only

May be the best non-professional Android HRV app. Offers much information including spectral power breakdowns.  This is one of the HRV  apps that Vince has been using with his Polar H7 belt.   Vince likes the wealth of readouts, but has been unable to generate measurements with consistency and reliability.  Vince relates that on five  occasions he has made three measurements in a row while in the same sitting position without touching the belt or changing position or modifying anything else.  The way Vince puts it is that one of the back-to-back measurements shows a  50% or more high frequency HRV power measurement, stress of 60 and the profile of a healthy athlete; another of the measurements shows 75% of the HRV power is in the low and ultralow frequency spectrum and the stress index is over 300.  And the third measurement is so screwy that if Vince were to take it seriously, he would have his wife call an ambulance to rush him to an emergency room.  These variations seem to appear in most multi-reading session Vince has done with the software.  So something is seriously wrong in the software, the belt, or in what Vince has been doing.

Elite HRV – free – Android

Has a neat and simple dashboard and rated with 4 stars.  Produces only two numbers: heart rate and a HRV reading.  Company is in development,  Does not appear to offer a web data interface yet.  This is another HRV  app that Vince has been using.  Produces back-to-back HRV measurement that are not always consistent.   Three readings taken  in a row for Vince may show stress indices of 36, 76 and 58.

************************

Vince and I expect to report on our personal HRV measuring experiences and measurements in a subsequent blog entry.  There we expect to compare the ease and efficacy of measuring HRV as against Vince’s stress biomarkers MRHR (morning resting heart rate just before waking up) and ERHR-MRHR (drop in sleeping resting heart rate overnight).

A simple, comprehensive plan to prevent or reverse Alzheimer’s Disease and other neurodegenerative diseases – Part 1: The Plan

By James P Watson, with contributions and editorial assistance by Vince Giuiliano

 INTRODUCTION AND OVERALL PRINCIPLES

This is the first of a pair of blog entries concerned with dementias – neurological diseases including Alzheimer’s Disease (AD) and its cousins.  This Part 1 write-up was inspired by a recent small, non-randomized clinical trial done by Dr. Dale Bredesen that showed true “Reversal of Cognitive Decline” in 9 out of 10 patients with documented cognitive decline (Bredesen, 2014).  Not all of these patients had AD, but all had cognitive decline.  Five had AD, two had SCI (subjective cognitive impairment), and two had MCI (mild cognitive impairment).  Although this study was too small to allow any statistical conclusions, it is the most positive report in a series of disappointing reports on the recent failures of Big Pharma’s monoclonal antibodies against amyloid-beta.  Dale Bredesen’s approach was a multifactorial one – utilizing 24 different approaches to halt or reverse cognitive decline.  We explore those 25 interventions here, focusing on the first 19.  They do not depend on drugs.  . The focus of this blog entry is “What can be done about dementias now?”

The forthcoming Part 2 blog entry will provides a detailed discussion of some of the key science related to AD and dementias.  This is the “What is science telling us about dementias?” part which gets quite complex.  We review major theories related to AD there including the Hardy Hypothesis related to amloid beta, the GSK3 theory and more detail on the neuroinflammation theory which we introduce in this Part 1 blog entry.  We expect to emphasize the emerging importance APP (Amloid Precursor Protein).  And we will describe some very recent research that appears to establish that a basic cause of AD is the proliferation in aging of vestigal DNA segments in our genomes (known as LINEs which are long interspersed nuclear elements and SINEs which are short interspersed nuclear elements) with encode over and over again for the production of APP and for the failure of its clearance.  This could well finally explain the role of beta amyloid in AD.

We have published a number of earlier blog entries relating to AD and dementias.  For example, you might want to review my August 2014 blog entry The Amyloid Beta face of Alzheimer’s Disease.

About dementias

Dementia only happens to a minority of the population with aging, but is becoming an ever increasing problem with the explosion in longevity occurring world-wide

Cognitive decline is the major “fear” people have of getting old.  Even individuals with the feared “ApoE4 polymorphism” are not “predestined” to develop Alzheimer’s Disease (AD).  The ApoE4 allele is only a “risk factor” for AD, not the cause of AD.

A common error is that most people view “dementia” and “Alzheimer’s disease” as synonyms, but this is incorrect.  Alzheimer’s disease is only responsible for 60% of cases of dementia in the US and even less of the cases in Japan.  In the US,  Vascular Dementia (VaD) is the second-most common cause of dementia (20%), whereas in Japan, the incidence of AD and VaD is almost the same.  In the US, the remaining 20% of dementia cases are due to several other neurodegenerative diseases such as Lewy Body Dementia (LBD), Parkinson’s disease with dementia (PDwithD), Frontotemporal dementia/ALS spectrum disorder (FTD/ALS), and mixed dementia (which is usually a mixture of AD and VaD).

A portrayal of the breakdown follows.

Image may be NSFW.
Clik here to view.

Image source

In the Middle East and China, VaD is more common than AD.  This was true in Japan two decades ago, but now the ratio of AD to VaD is 1:1.  Since AD and VaD are clearly the leading causes of dementia world-wide, we will focus mostly on these two types of dementia.  Also, the risk factors for AD and VaD overlap and there are cases of “mixed dementia” which include features of both diseases.  AD affects 5.4 million Americans and 30 million globally.  By 2050, these numbers will be 13 million (US) and 160 million (world-wide) (Ferri, 2005). Many experts now regard dementia from neurodegenerative diseases as the 3rd leading cause of death after cardiovascular disease and cancer.  Despite millions of dollars being spent annually on research, the exact causes of these dementias are still unknown, but the number of clues to the causes is growing and we will explore some of the main ones in our Part 2 blog entry.

Neuroinflammation is the most universally accepted explanation for AD

What is clear is that the “universal sign” of all neurodegenerative disease is “neuroinflammation”, which under the microscope is manifested as “gliosis” and is seen with AD, VaD, PD, FTD/ALS, and the type of dementia seen after multiple concussions, which is now called “Chronic Traumatic Encephalopathy” (CTE).  Although they all have different “triggers” for each disease, they all have “neuroinflammation” and histologic signs of gliosis.  We return to neuroinflammation several times as a central theme here and in the Part 2 blog entries.

Another “universal feature” is that all of these disease have familial cases with as few as 5% being genetic (AD) and as many as 50% being genetic (FTD).  In these familial cases, there is most often a genetic mutation that is causal in nature (early onset disease) or a single nucleotide polymorphism (SNP) that is not causal in nature, but predisposes the patient to the disease.   With the exception of CTE (where the primary cause is multiple concussions) and PD (where pesticide exposure, family history of PD, and depression combine to produce an odds ratio OR = 12.0), most of the cases of neurodegenerative dementias remain largely sporadic with unknown specific causation.

Environmental risk factors for neurodegenerative diseases are discussed in the 2005 publication Neurodegenerative Diseases: An Overview of Environmental Risk Factors  and in publications in this list.

Despite millions of dollars being spent annually on research, the exact cause of these dementias are still unknown, but the number of clues to the cause is growing.  What is clear is that the “universal sign” of these neurodegenerative diseases is “neuroinflammation”, which under the microscope is manifested as  “gliosis” and is seen with  AD, VaD, PD, FTD/ALS, and the type of dementia seen after multiple concussions, which is now called “Chronic Traumatic Encephalopathy” (CTE).  Although they all have different “triggers” for each disease, they all have “neuroinflammation” and histologic signs of gliosis.  Another “universal feature” is that all of these disease have familial cases with as few as 5% being genetic (AD) and as many as 50% being genetic (FTD).  In these familial cases, there is most often a genetic mutation that is causal in nature (early onset disease) or a single nucleotide polymorphism (SNP) that is not causal in nature, but predisposes the patient to the disease.

With the exception of CTE (where the primary cause is multiple concussions) and PD (where pesticide exposure, family history of PD, and depression combine to produce an odds ratio OR = 12.0), most of the cases of neurodegenerative dementias remain largely sporadic with unknown specific causation.

Failure of Monotherapeutic Approaches to Neurodegeneration – It is time to consider multiple component therapies

The development of drugs to treat neurodegeneration has probably been the biggest failure of the pharmaceutical industry.  Although there are three FDA-approved drugs for AD, none of them produce anything other than a marginal, unsustained effect on symptoms.  Hundreds of clinical trials for AD have failed over the past two decades, most recently being the large Phase III trials of monoclonal antibodies that target amyloid-beta.  As of today, no drugs have been approved for Frontotemporal dementia, Vascular dementia, and Lewy body dementia.  Only one drug has been approved for Amyotrophic lateral sclerosis (ALS).  All of the clinical trials done for these diseases have largely been with monotherapeutic drug approaches.

We know from the field of cardiovascular disease, cancer, and HIV that single drug therapy for these diseases largely fail.  .  It is now clear that cancer is “incurable” with chemotherapy unless multiple drugs are used.  Combination therapies have become the standard for treating these conditions.  The requirement to combine drug therapies appears to pertain as well to diseases that we cannot “cure” but that are are yet treatable:  we can control the disease and prevent premature death from the disease.  This includes cardiovascular disease, HIV, and a few other glaring chronic diseases.  These diseases like dementias involve simultaneous upregulation or downregulation of hundreds or thousands of genes including protein-producing ones, and simultaneous activation or inhibition of a large multiplicity of pathway.  It is a very tall order to find a single molecule that can have the right effects on so very many different upregulated and downregulated molecules and pathways at the same time.  Yet, Big Pharma by tradition and because of patent law likes to look for single molecules that can be patented and that can make a big differences in a key step in a highly specific disease processes.  But most serious aging-related diseases and dementias don’t offer such an opportunity.

The Multi-factorial approach rather than “single target” approaches to Treating Alzheimer’s Disease

For the same reasons, it makes sense that a single drug made by “Big Pharma” could NOT solve the problems with these neurodegenerative diseases.  Here is a list of 25 different interventions that were combined into one effective program that “reversed” AD in 9 of 10 patients treated in a pilot study at UCLA and the Buck Institute.  None of these involve drugs.  I will include in black, the ones that were recommended by Dr. Dale Bredesen in what he calls the “MEND” program, which is an acronym that stands for “Metabolic Enhancement for NeuroDegeneration”.  You can check out his 2014 paper Reversal of cognitive decline: A novel therapeutic program.

SECTION I PRACTICAL INTERVENTIONS

1.  Eat a low glycemic, low inflammatory, low grain diet – Since sugar triggers insulin release and the insulin receptor triggers brain aging, this is easy to understand. For several complex reasons, certain proteins found only in grains (such as wheat germ, wheat gliadins) also triggers inflammation. The foods that have a high glycemic index or have lots of wheat in them include the following:

High glycemic index foods (these are bad) (and pro-inflammatory nonglycemic foods)

Low glycemic index foods (these are good) (and anti-inflammatory foods and beverages)

Sweet Fruit – banannas, oranges, grapefuit

Fatty fruit – avocadoes, olives, capers

Orange juice, Apple juice, grape juice

Unsweetened coconut milk, soymilk, almond milk

Pancakes, waffles, French toast, toast

Scrambled eggs, omelettes, boiled eggs, fried eggs

Candy, Pies, Cake, Ice cream, Sherbert

Vegetables – Broccoli, Brussel sprouts, Artichokes

Corn bread, Cornflakes, corn oil

Olive oil, Coconut oil extract (MCT oil)

Processed cold cereals – Chex, Raisin bran

Oatmeal, barley cereal, rye bread, etc.

   Cream of wheat, Fruit loops, etc.

Mushrooms, seaweed (Sushi), cheese, butter

Toast, bread, donuts, bagels, croissants

tomato soup (add some protein), mushroom soup

Potatoes, potato chips, French fries

Cream of broccoli soup, lentils, legumes

Sweetened yogurt, sweetened milk

Unsweetened yogurt, Greek yogurt

Cow’s milk, Chocolate milk, hot cocoa

Prosage patties, garden burgers, vegelinks

Jam, jelly, honey, maple syrup, pancake syrup

Soymeat, tofu, vegameat, Frichick

Peanut butter, Jam, and bread sandwiches

Portobello  mushroom sandwiches w/o bread

White rice, brown rice, pita bread, wild rice

Indian curries (leave out the potatoes), Thai curry

Wheat thins, Pretzels, wheat snacks

Dried kale chips, seaweed snacks, onion snacks

Sugar drinks, sweetened tea, Gatoraid

Green tea, white tea (no caffeine), herbal teas

2.   Enhance autophagy – This can be done without fasting all day.  Research has shown that fasting for at least 12 hours per day (evening and night) is sufficient to activate autophagy.  Not eating for at least 3 hours before bedtime also activates autophagy.  Eating the evening meal earlier in the day also helps.  For those who do not want to fast for at least 12 hours, there may be little hope of “cleaning the cobwebs out of the brain”.  Studies have shown that eating too much or eating late at night completely shuts off autophagy.  This is probably the #1 reason why most people have so much “proteotoxicity” in the brain, the pancreas, and other organs.  You can review our blog entry Autophagy – the housekeeper in every cell that fights aging.

There are some natural compounds and some drugs that stimulate autophagy, however. They include the following:

  • mTOR inhibitors – The mTOR pathway is “downstream” from the Insulin/IGF-1 pathway. The mTOR pathway completely “shuts off” autophagy and stimulates protein synthesis. This is the primary “danger” of eating too much meat or protein (i.e. stimulating the mTOR pathway).  Continually inhibiting the mTOR pathway is probably not a good idea either, since it is very important to synthesize proteins.  However, intermittent mTOR pathway inhibition has been shown to be a very effective way of stimulating “cellular housekeeping” in the brain. The best-known drug that inhibits the mTOR pathway ia rapamycin.  Low glucose levels and low amino acid levels in the blood also inhibit mTOR.  It is interesting that at least one big pharma company, Novartis,  is interested in marketing rapamycin as an anti-aging drug(ref).
  • AMPK activators – The AMPK pathway is one of the major pathways that activates autophagy. AMPK is activated by both exercise and fasting. The AMPK pathway is a “cross-talk” pathway between mTOR and the Insulin/IGF-1 pathway.  Activating AMPK inhibits both of these “bad” pathways. (They are only bad in certain contexts of aging and still serve important functions in aging people.  We could not be alive without them.  In the Part 2 blog entry we will talk about how some times IGF is the good guy we don’t want to be without.)  Besides exercise and fasting, AMPK can be stimulated by three hormones, some drugs and many natural compounds. The most potent AMPK activator is muscle contraction (i.e. exercise). The three hormones that stimulate AMPK are thyroid hormone and two hormones secreted from fat: leptin and adiponectin. Next to this, the most potent chemical activators of AMPK are probably AICAR and ZMP. These are synthetic compounds that are the only true “exercise mimetics”.  ZMP is a derivative of AICAR.  AICAR has been shown to increase endurance in rodents by 44% without exercise.  This is amazing.  Combining AICAR with exercise makes the drug even more effective. Unfortunately, AICAR is very expensive ($350-450/gram).  Common drugs that activate AMPK include metformin and aspirin.  Natural compounds that activated AMPK include resveratrol, pterostilbene, curcumin, EGCG,  betulinic acid, Gynostemma Pentaphyllum, Trans-Tiliroside (from rose hips), and 3-phosphoglycerate.  See this list for articles in this blog that deal with autophagy or describe autophagy activators.
  • Sirtuin activators – The 3rd major family of pathways that activates autophagy is for the Sirtuin enzymes (SIRT1-7). Sirtuins are enzymes that remove acetyl groups from proteins. The most important ones it deacetylates for autophagy are 3 proteins that are crucial to the autophagy system of “cellular housekeeping”.  These 3 proteins are Atg5, Atg7, and Atg8. There are many practical reasons why activating Sirtuin-induced autophagy is critical to health.  For instance, SIRT1 activation protects cells in human degenerative discs from death by promoting autophagy.  This is why fasting has been shown to eliminate back pain. The most well-known SIRT1 activator is resveratrol, the active ingredient in red wine.  However, both red wine and white wine have been shown to activate Sirtuin enzymes.  NAD+, NMN, and NR all activate Sirtuin enzymes (all 7 of them), whereas resveratrol only activates SIRT1.   You can see our blog entry NAD+ an emerging framework for health and life extension — Part 1: The NAD World

3.   Reduce stress – psychological stress, depression, worrying, and being obsessive compulsive all increase the risk of Alzheimer’s disease. The most effective ways to reduce “cellular stress” are as follows:

  • Yoga – yoga has been scientifically proven to reduce stress. The mechanism may be multifactorial, but studies suggest that activating stretch receptors in the muscles induces the SIRT3 gene.  The Sirtuin pathway is a major pathway activated by fasting, caloric restriction, red wine, NAD+, NMN, NR, and certain other natural compounds.
  • Meditation – meditation has been scientifically prove to reduce stress. However, 3 minutes of prayer is NOT meditation. Meditation requires 30-60 minutes of time. The MEND program recommends 20 minutes of meditation twice a day (No one prays that long).
  • Tai chi – this ancient Chinese form of exercise has been shown to reduce stress
  • Exercise followed by rest – exercise alone does not reduce stress, but exercise followed by a good night’s rest is very effective at reducing stress
  • Stretching exercises – These have a special beneficial effect on stress, especially back stretching exercises for back pain.

Self-monitoring of daily stress and exercise can be helpful for knowing what your stress levels are and how good a job you are doing at keeping stress at non-harmful levels.  A great many of the upstream conditions that can lead to dementias mentioned here (sedentary life style, improper diet, inadequate sleep, etc) are likely to induce constitutional stress which can be picked up by such monitoring.  A host of new wearable devices can keep track of exercise and its consequences.  See the blog entry Digital health – health and fitness wearables, apps and platforms – implications for assessing health and longevity interventions – Part 1.  Vince has identified two constitutional stress measurements in his blog entry that can be tracked starting with smartwatch heart rate and sleep measurements, MRHR (morning resting heart rate before awakening), and ERHR-MRHR (difference between evening resting heart rate and morning resting heart rate during sleep, a measure of overnight sleep-related constitutional stress recovery),.  These are described in the blog entry Digital health – health and fitness wearables, Part 2: looking for practical stress biomarkersAlso, heart rate variability is another personally trackable constitutional measurement of stress,  See my recent blog entry on heart rate variability, Digital Health Part 3.

4.    Optimize sleep – At least 8 hours of sleep at night is very effective in preventing Alzheimer’s disease.

Daytime sleeping probably is not as effective, but is probably not harmful provided that a person is not too sedentary with daytime sleeping (i.e. short naps).  Adding 0.5 – 3 mg of melatonin and 500 mg of tryptophan is also very helpful in getting a good night’s sleep.  One of the biggest problems with getting a good night’s sleep is sleep apnea, which is actually very common as we get older.

Image may be NSFW.
Clik here to view.
An external file that holds a picture, illustration, etc.<br /><br /><br /><br /><br /><br />
Object name is fnagi-06-00325-g0002.jpg


“A Simplified schematic of the proposed interventions that may have potential to delay AD pathogenesis — The green arrows indicate pathways for improved circadian regulation and sleep quality, ultimately delaying AD pathogenesis. According to this model, chronobiotics (i.e., bright light therapy (BLT); melatonin; exercise; and food restriction) and good sleep hygiene could be used individually—but preferably in combination—to improve circadian regulation and sleep quality, decrease inflammation and Aβ deposition, and thereby delay AD pathogenesis.”  Image and legend source

5.   Exercise – The World Health Organization recommends 150 minutes of exercise per week, but the best scientific evidence suggests that this is NOT enough. The best scientific evidence suggests at least 450 minutes of exercise per week.  That is 60 minutes per day and an extra 20 minutes on one of those days.  If you want to skip Saturday, that means 75 minutes per day (1hr 15 minutes).  The exercise should include the following for preventing Alzheimer’s disease:

  • Swimming, outdoor hiking, calisthenics, aerobic fitness classes, spinning classes, etc.
  • 30-45 minutes of aerobic exercise where the heart rate is 60% of training heart rate.  This can be on a stationary bicycle, an elipical machine, a “hand bicycle”, a stair climber,
  • 1 mile per day of walking outside (the speed is not important)
  • Resistance exercise – this includes weight lifting, machines, stretch bands, push-ups, etc.
  • Stretching – stretching activates stretch receptors which activates the SIRT3 gene, which is key for mitochondrial function and decreasing free radicals in the muscles (which cause pain
  • Listening to relaxing music – classical music listening is a good way to relax.

Watching TV or looking at a computer screen and “surfing on the computer” probably does NOT work to reduce cellular stress.  Here are some of the blog entries we have published relating to exercise.

6.   Brain stimulation – The Mayo Clinic did a study in 487 patients where they participated in a computerized cognitive training program called “Brain Fitness Program” by Posit Science. This computer training required 1 hour of time per day, 5 days per week for 8 weeks (totaling 40 hours). This was called the IMPACT study.  This program increased their auditory processing speed by 131% and improved their memory an equivalent of approximately 10 years!  Here is some information on this inexpensive computer program:

Some of us think that we may keep our brains fit by constantly trying to figure out the mechanisms of aging.

7.  Keep your homocysteine low – High homocysteine levels seem to correlate with inflammation and also with deficiencies in folate cycle intermediates. The MEND program recommendation is to check your homocysteine levels and if it is > 7, then to take methyl-B12, methyltetrahydrofolate, pyridoxal-5-phosphate, and trimethylglycine (if necessary). The dosages are: Methyltetrahydrofolate – 0.8 mg/day and Pyridoxine-5-phosphate –  50 mg/day

8.   Keep your vitamin B12 high – Vitamin B12 is very important in memory and prevention of dementia. Vit B12 deficiency alone can cause dementia. It is easier to prevent than to reverse.  The MEND program recommends taking methyl-B12, not regular B12. They recommend basing the dose of methyl-B12 on serum levels of B12, which they recommend keeping above 500 with 1mg of methylB12/day.

9.  Keep your C-reactive protein low – CRP is a measure of inflammation. This correlates very well with inflammation in the brain (called neuroinflammation).  They recommend keeping the CRP levels below 1.0 and the Albumin/globulin ratio > 1.5.  There are no FDA-approved drugs that lower this which are safe to be used on a chronic basis.  However, there are several natural products that are effective in reducing C-reactive protein (CRP).  They include curcumin (400 mg/day), Fish oil (DHA & EPA), and an anti-inflammatory diet that is low in sugar and wheat products.  The MEND program recommends 700 mg of DHA twice a day (total 1400 mg) and 500 mg of EPA twice a day (total 1,000 mg).  Since most Fish oil capsules are only about 1/3rd omega-3 fatty acids, that means you need to take about 7,000-8,000 mg (i.e. 7-8 one gram capsules) per day of Fish oil.

10.   Keep your fasting insulin low – Most people develop insulin resistance with aging. Unfortunately, this is rarely diagnosed until they have already suffered the consequences of insulin resistance, which include metabolic syndrome, hypertriglyceridemia, hypercholesterolemia, Alzheimer’s disease osteoarthritis, accelerated hearing loss, accelerated visual impairment (including presbyopia, cataracts, and age-related macular degeneration, aka AMD).  Once these things occur, then reducing your fasting insulin no longer is useful – the cells are already dead!  The MEND program recommends keeping your fasting insulin to < 7.0.  The best way to do this is to eat a low glycemic index diet, encourage ketogenesis by 12 hours of fasting per day, exercise, sleep, and in some cases the drug metformin.  We have found that the NAD precursor, NMN is effective in reducing fasting insulin levels.  Other supplements designed to enhance NAD+ may help as well.

11.   Hormone balancing – The MEND program recommends normalizing thyroid hormone levels (free T3, free T4, estrogen, testosterone, progesterone, pregnenolone, and cortisol). For most people, cortisol levels are way too high.  The best way to reduce cortisol is to reduce stress, improve sleep, and also possibly to supplement with NMN or NR.  The rest of the hormones decline with aging and often need replacement. Here are some ways to make this safe:

  • Testosterone replacement therapy – this is risky in older men, due to the risks of accelerated coronary artery narrowing due to neointimal hyperplasia, as well as benign prostatic hypertrophy worsening or by making prostate cancer grow. For this reason, a thorough work-up for prostate cancer must be done before starting testosterone. In addition, testosterone dosing should be based on testosterone levels.
  • Progesterone – This is primarily for women, but also helps men in low doses. Any progesterone replacement therapy should also be based on blood levels of progesterone.
  • Pregnenolone – This helps both men and women for the brain.
  • Estradiol (E2) – This should also be done based on blood levels of E2

12.   Healthy gut bacteria – Most people have very unhealthy gut bacteria due to the use of antibiotics, due to general anesthesia, and due to dietary factors such as a high sugar diet. As a result, the lactobacillus that are good for your health often die.  In addition, the fiber-fermenting bacteria are often absent, thereby eliminating the healthful effects of a high fiber diet.  Probiotics and prebiotics are often helpful in restoring healthy gut bacteria.  You can see Vince’s 2012 blog entry Gut microbiota, probiotics, prebiotics and synbiotics – keys to health and longevity.

13.   Reducing amyloid beta aggregates – One of the hallmarks of Alzheimer’s disease is the accumulation of misfolded, aggregates of a protein called amyloid beta. Fortunately, there are two natural compounds that if taken in large quantities can reduce amyloid-beta plaques in the brain.  They are Ashwagandha and curcumin.  Both of these are effective in reducing amyloid beta plaques.  The MEND program recommend doses of 500 mg for Ashwagandha and 400 mg for curcumin.  Because curcumin is so poorly absorbed, it is better to take a liposomal or nanoparticle form of the curcumin, like Bio-curcumin 95. Curcumin can be taking as a pill, but it may be absorbed much better in curry that has coconut oil, since the coconut oil creates an emultion and micelles which can be absorbed by the lymphatic system and thereby “bypass” the liver and the “first pass effect”.   Ashwagandha is much better absorbed and does not have as much of a problem. It can be taken as a pill, but also can be taken as a tea.   My friend Dr. Vince Giuliano has made a liposomal form of these two compounds together with two complementary anti-inflammatory herbal extracts which he believes get into the blood stream in concentrations that are 8-10 times higher than by pill form.  He has written about these and other phytosubstances a number of times, e.g.(ref) (ref) (ref) (ref) (ref).

14.   Cognitive enhancement – This category was probably added to the MEND program for supplements that could not be categorized elsewhere. They specifically recommend the natural product called Bacopa monniera and Magnesium. Bacopa monnieri is also called “water hyssop”, “herb of grace”, “Indian pennywort” and Withania somnifera.  Bacopa monniera has been shown to reduce amyloid plaque and prevent synaptic decline in mouse models of AD.  One possible mechanism by which Bacopa monnieri works is to enhance LDL receptor-related protein, which is the “amyloid exporter” in the brain.  There are many studies that show a benefit from Bacopa monniera In humans. A meta-analysis of 6 high quality clinical trials of Bacopa monniera showed that 9 out of 17 tests showed improved performance in the domain of “memory free recall”. In a study on Okadaic acid induced memory impaired rats, the effect of standardized extract of Bacopa monnieri and Melatonin on the Nrf2 pathway was investigated.  “OKA caused a significant memory deficit with oxidative stress, neuroinflammation, and neuronal loss which was concomitant with attenuated expression of Nrf2, HO1, and GCLC. Treatment with BM and Melatonin significantly improved memory dysfunction in OKA rats as shown by decreased latency time and path length. The treatments also restored Nrf2, HO1, and GCLC expressions and decreased oxidative stress, neuroinflammation, and neuronal loss. Thus strengthening the endogenous defense through Nrf2 modulation plays a key role in the protective effect of BM and Melatonin in OKA induced memory impairment in rats.” There is a special form of magnesium which is much better incorporated into the cell called Magnesium-L-threonate, aka MgT.  Both can be taken as a capsule.  The dose Bacopa monniera they recommend is 250 mg/day. However, most of the clinical trials recommend dosages of 300-450 mg/day.

15.  Vitamin D3 –Vitamin D3 seems to be quite different than the other vitamins for a variety of reasons. The most important difference is that Vitamin D levels should be checked and individuals need to adjust their dose based on their serum vitamin D3 levels. To prevent AD, the levels of Vitamin D3 need to be > 50 nmol/L.  The strongest evidence for this comes from two recent studies from 2014.  One was a 5 year study in 1,658 elderly patients who started the study with no dementia. During the 5 years, 171 of the 1,658 developed dementia (10% risk over 5 years).  This study looked at “all cause dementia”, of which 90% is Alzheimer’s dementia (AD) and Vascular dementia (VD).  The risk of developing dementia when serum Vitamin D3 levels were > 50 nmol/L was very low.  However, those with Vit D3  levels between 25 and 50 nmol/L had a 1.53 fold higher risk of developing dementia of any type.  Those with levels below 25 nmol/L had a 2.25 nmol higher risk of developing dementia of any type.  The 2nd study reported in 2014 was from Denmark and followed 10,186 individuals in the Danish population for 30 years.  They looked at the risk of specific kinds of dementia and the relationship to Vitamin D3.  For Alzheimer’s disease (AD), the risk of AD type dementia was 1.25-1.29 fold higher in those with serum Vit D3 levels below 25 nmol/L.  For Vascular Dementia (VD), the risk of VD type dementia was 1.22 fold higher in those with serum Vit D3 levels below 25 nmol/L.  In conclusion, low Vitamin D3 levels is one of the largest risk factors for dementia and the easiest to prevent.  Most people do not get their Vitamin D3 levels checked.  Do you know what yours is?

16.   Increasing Nerve Growth Factor (NGF) Hericium erinaceus and ALCAR — Although there are many growth factors that make nerve cells grow, the most important one is probably Nerve Growth Factor (NGF).  NGF is a growth factor made and secreted by astrocytes in the brain and spinal cord.  NGF enhances neuronal stem cell regeneration of the brain.  Exercise is a potent stimulator of NGF secretion. There are several natural compounds that stimulate nerve growth factor secretion.  They include extracts from the mushroom, Hericium erinaceus. Although there are other edible mushrooms that are good for you, of the 4 edible mushrooms that were studied for their effect on NGF secretion, only Hericium erinaceus induced the secretion of NGF from human astrocytes in the Hippocampus of the brain.  Another compound that stimulates the secretion of NGF is Acetyl-L-carnitine, aka ALCAR.  Acetyl-L-carnitine also helps with neuropathic pain.   In rodent models of Alzheimer’s disease, 150 mg/kg/day of ALCAR induced NGF secretion and increased choline acetyltransferase activity, which increasea acetylcholine levels in the hippocampus.

17.   Provide the substrates for synaptic formation uridine, choline, citocolin, DHA, EPA, and herring roe — The ability to form synaptic connections between neurons is a key part of forming memory. Several key molecules are needed to create these synapses and dendritic spines that are not made by the human body (e.g. DHA) or are made in inadequate amounts (e.g. citicoline).   The omega-3 fatty acid called docosahexaenoic acid (DHA) is probably the “rate-limiting substrate” in the formation of presynaptic and postsynaptic proteins.  DHA alone will increase the formation of synapses and increase cognitive performance in humans and experimental animals, but the addition of two other circulating precursors for phosphatidylcholine also enhance memory formation.  These two other precursors are uridine (which gives rise to brain UTP and CTP) and choline (which gives rise to phosphocholine).   Phosphatidylcholine (PC) is the major phosphatide found in human neuronal connections. The other two major synaptic ingredients are uridine and DHA.  Studies have shown that the aministration of choline, uridine, and DHA together have a greater effect than the sum of the individual effects (i.e. they have a synergistic effect on generating synapses and dendritic spines). DHA alone increased the synthesis of hippocampal phospholipids by 8-75%, with the greatest percentage being in the synthesis if PC (phosphatidylcholine).  There are still controversies as to how much DHA a person should take per day.

The MEND program recommends 320 mg of DHA/day, but other experts recommend as much as 2,000 mg/day of DHA.  Herring roe, the eggs from the Herring forage fish, is another good source of n-3 polyunsaturated fatty acids that have a high phospholipid content.  MOPL 30 is a supplement product made by Artic Nutrition that includes a lot of phospholipids and a 3:1 ratio of DHA:EPA.  The MOPL 30 proprietary supplement not only increased neuronal generation, it also decreased plasma triacylglycerol and non-esterified fatty acids as well as increased HDL-cholesterol.  Although fasting glucose did not change, the glucose measurement on OGTT decreased at 10 minutes and 120 minutes into the test.   Instead of taking herring roe, uridine, or choline, the MEND program recommends citocoline (aka CDP-Choline) an intermediate compound in the generation of phosphatidylcholine from choline (i.e. already half made).  It is marketed under many names worldwide, including Ceraxon, Cognizin, NeurAxon, Somazina, Synapsine, etc. Studies have shown that citocoline increases dopamine receptor densities, prevents memory impairment, improve focus and mental energy.  Citocoline may also help treat attention deficit disorder (ADD).  The MEND program recommends a dose of 500 mg of Citocoline twice a day, 320 mg of DHA per day, and 180 mg of EPA per day.

18.   Optimize antioxidants – mixed tocopherols, tocotrienols, Selium, blueberries, NAC, Vit C, a-lipoic acid.  Although the free radical theory of aging has largely been proven to be incorrect as the “cause of aging”, there is no question that the “effect of aging” includes free radical damage to proteins, lipids, and nucleic acids that make up a cell.  To try to mitigate these “downstream effects” of aging, many believe that the judicious use of antioxidants still plays a useful role in treating neurodegeneration.  In this blog we have questioned that viewpoint and have pointed out that “antioxidants” like those mentioned often have powerful epigenetic impacts that better explain their actions(ref)(ref).

19.  Optimize Zn:fCu ratio – Alzheimer’s disease may be caused (in part) by copper toxicity — The fact that Alzheimer’s disease was rare prior to 1900, yet now being very common has led many experts to look for environmental “causes” of AD. One of the leading “suspects” in a long list of environmental risks for AD is inorganic copper, which comes from drinking water and supplement pills. There is clear evidence from human subjects that serum free copper is elevated with AD and that the level of free copper in the serum correlates with cognition and predicts cognition loss.  Animal studies have replicated these findings and have shown that as little as 0.12 ppm of coper in distilled drinking water in cholesterol-fed rabbits greatly enhanced the formation of AD.

A 2nd feature of AD is that those affected also have Zinc deficiency.  A small clinical trial published in 2014 showed that in patients over the age of 70, Zinc supplementation protected against cognitive loss and also reduced serum free copper levels in AD patients.  For these reasons, it is unclear if the efficacy of Zinc therapy is on restoring normal Zn levels or if it is due to reducing Cu levels.

The following Table lists the remaining interventions in Dale Bredesen’s list.  These are fairly clear and we will not expand on them here.

20.  Ensure nocturnal oxygenation Exclude or treat sleep apnea [54]
21.  Optimize mitochondrial function CoQ or ubiquinol, α-lipoic acid, PQQ, NAC, ALCAR, Se, Zn, resveratrol, ascorbate, thiamine [55]
22.  Increase focus Pantothenic acid Acetylcholine synthesis requirement
23.  Increase SirT1 function Resveratrol [32]
24.  Exclude heavy metal toxicity Evaluate Hg, Pb, Cd; chelate if indicated CNS effects of heavy metals
25.  MCT effects Coconut oil or Axona [56]

Neuroinflammation “causes” all of the neurodegeneratove diseases

Although we will save most of our discussion on the science of AD to the coming Part 2 blog entry in this series, we comment here a bit more on the the science behind most of the above interventions – their neuroinflammatory nature.

In all neurodegeneratiave diseases (both familial and sporadic cases), there is evidence of a chronic, low grade brain inflammation that does not go away.  Histologically, this is called “gliosis”, a term that describes what is seen under the microscope. As mentioned above, microglial cells are increased in number and they appear “angry” (i.e. they are activated) likely due to the presence of 1-42.  It is likely that these microglial cells are secreting pro-inflammatory factors which are causing the inflammation, although the picture is actually much more complex.  Vince has written about this in 2011 and before in the blog entries Key roles of glia and microglia in age-related neurodegenerative diseases, New views of Alzheimer’s disease and new approaches to treating it, and Alzheimer’s Disease Update. We surface some additional insights here and in Part 2..

This illustration portrays some of the inflammatory processes that go on when microglia and astrocytes are activated:

Image may be NSFW.
Clik here to view.

Image and legend  source The 2014 publication Inflammasomes in neuroinflammation and changes in brain function: a focused review  “Cytokines hypothesis of neuroinflammation: Implications in comorbidity of systemic illnesses with psychiatric disorders. Pro-inflammatory cytokines can migrate between systemic circulation and brain in both directions which could explain the comorbidity of systemic illnesses with psychiatric disorders. There are three pathways for the transport of pro-inflammatory cytokines from systemic circulation to brain as described by Capuron and Miller (2011): Cellular, Humoral, and Neural. Moreover, PAMPs and DAMPs from trauma, infection, and metabolic waste can prime glial cells to express pro-inflammatory cytokines TNF-α, IL-1β, and IL-6. When expressed, these cytokines activates granulocytes, monocytes/macrophages, Natural Killer, and T cells and together contribute to the pathophysiology of neuroinflammation. Chronic neuroinflammation could result in neurodegeneration and associated psychiatric disorders. These pro-inflammatory cytokines also stimulate production and expression of anti-inflammatory cytokine by glial cells that function as negative feedback to reduce the expression of pro-inflammatory cytokines, subsiding the neuroinflammation. MCP-1, Monocyte chemoattractant protein-1; CP, Choroid plexus; CVO, Circumventricular organ.”

The chronic inflammation viewpoint of Alzheimer’s disease is related to but somewhat different than the Beta Amloid viewpoint, the viewpoint covered in my recent blog entry The Amyloid Beta face of Alzheimer’s Disease.

The situation is described in a 2014 publication by Landry and Liu-Ambrose: “An alternative to the classic amyloid centric view of AD suggests that late-onset AD results from age-related alterations in innate immunity and chronic systemic inflammation (for review see Krstic and Knuesel, 2013).

So, a basic strategy for preventing or delaying the onset of neurodegenerative diseases is to mount a multifront war on systematic inflammation.  The 25 Bredesen interventions described above are initiatives in that war.


30 Major Factors that Control SIRT1 Expression, SIRT1 Activity, and SIRT1-mediated Aging. Part 3 of the series NAD+ an emerging framework for health and life extension


By James P Watson with comments and editorial assistance by Vince Giuliano

Introduction by Vince Giuliano:

This is the third blog entry in the series NAD+ an emerging framework for health and life extension.  The first two entries were   Part 1: The NAD World, and Part 2: Deeper into the NAD World, hopeful interventions  We invite our readers to review these for background. 

Ever since David Sinclair’s seminal 2013 publication relating insufficiency of NAD+ to mitochondrial dysfunctionality(ref) , and and for some time before that, many research scientists have thought that insufficient nuclear levels of NAD+ are a major cause of diseases and aging processes including mitochondrial dysfunctionality,  associated deleterious metabolic consequences, and insufficient DNA repair.  Based on much research, this point seems to be solid and incontrovertible.  Having higher levels of NAD+ would doubtlesly be a good thing, especially for older people whose levels decline with age.  The major though not the only avenues of benefit are realized via sirtuins, particularly SIRT1. As is well-recognized and pointed out in many of out earlier blog entries, the sirtuins are essential for multiple key biological processes such as DNA repair and healthy mitochondrial metabolism.  Further, with aging and disease they tend to be in declining supply.  When there is not enough SIRT1. serious consequences can ensue .

In the growing excitement about NAD science during last two years, some researchers and entrepreneurs have further thought that human NAD+ levels can likely be enhanced by ongoing supplementation with NAD precursors such as nicotinamide riboside (NR) or  with  nicotinamide mononucleotide (NMN), The thinking has been that such supplementation might make a significant difference in human health and longevity.  However direct evidence  that NAD levels can be non-transiently enhanced in humans, either intracellular or extra-cellular, is thin to nonexistent.  No direct research shows this.  Likewise, evidence that human health or longevity benefits will result from continuous NAD precursor supplementats  is equally thin,  Enhancement of SIRT1 levels in mice via NMN supplementation and associated health benefits has been observed in only short term trials with mice, ones that lasted only 7 or 10 days (ref)(ref). There appears to be no clear evidence however, either human or animal, that continuing to take a NAD precursor supplement over a long term can lead to higher continuing levels of NAD+ or the many health benefits hypothesized to ensue.

This has led Jim Watson to investigate just what determines human NAD levels and what determines SIRT1 levels.  He found at least 50 such factors  In this current blog entry reports on what he believes are the most important 30 of these. 

This is another Chapter in the extended NAD story, but not the final one.  We expect soon to publish a Part 4 blog entry in this NAD World series.  That blog entry will look with more detail into several additional areas including NAD/Sirtuins and inflammation, and NAD and the much-discussed Warburg effect.  Despite a now-popular perception that scarcity of NAD+ is the main cause of the Warburg effect, Jim Watson points out that the effect  has multiple other causes including three long non-coding RNAs that promote it happening as a key effect in aging and cancer processes. Related to these causes,Jim discusses some possible intervention strategies that go beyond those normally discussed in the longevity literature.

1.  Subcellular compartment levels of NAD regulate aging 

The content of NAD in the nucleus as well as total cellular NAD levels declines with aging.

A.  Animal studies that showed how total cellular NAD decline with aging – DNA damage seems to be the most significant biomarker that correlates with the change in cellular NAD levels

Several papers in the 1990s showed that PARP activity increased with aging in both animal and human cells, but the evidence that NAD declined with aging was not discovered until the past 10 years.  In fact, a 1983 paper by Chapman, Zaun, and Gracy suggested the opposite effect – that NAD levels increased with aging.   The first paper to show that NAD depletion occurred was actually a heart failure study published in 2005.  Pillai and colleagues showed that PARP1 activation resulted in NAD depletion, reduced SIRT2 activity, and myocyte cell death. The next report was in 2008 by Parihar and colleagues, and was a study of rat hippocampal neurons.  In this in vitro study, they showed that a 50% decline in NAD(H) levels occurred in the aged neurons. (see reference below).  The 3rd report was a study in Wistar Rats, which showed a 4-7 fold decline in NAD+ levels with aging.  ThIs paper by Braidy and colleagues at the U of New South Wales in Sidney, Australia was the first study that specifically was designed to look at declining levels of NAD with aging. (2011).  What was remarkable in this study was that the DNA damage biomarker, pH2AX, seemed to correlate with the decline in NAD levels, even more than other biomarkers for oxidative stress.

B,  Human Studies showing that total cellular NAD levels decline with aging DNA damage seems to be the most significant biomarker that correlates with the change in cellular NAD levels

Until recently, it was not known if human cells also underwent a decline in NAD content with aging.  The first paper to show this effect in humans was also from Sidney, Australia.  In 2012, Massudi and colleagues showed a precipitous drop in NAD levels within human skin cells, harvested from areas of skin with no sun exposure from infancy to old age.   Although measures of oxidative stress changed with aging (TBARS, MDA, F2-isoprostanes, etc.), the most significant change that correlated with aging was the DNA damage marker, pH2AX, which showed a significant increase with age in both males and females (p < 0.003). This suggests that the most important feature of cellular aging is DNA damage, not lipid oxidation or oxidative stress, per se.   Along with this increase in DNA damage was a dramatic increase in PARP activity (10-fold) in males.  PARP enzymes are NAD-consuming enzymes that sense and help repair single stranded DNA breaks via the base-excision repair (BER) pathway.  Paradoxically, the increase in PARP activity  was not statistically significant in the female cohort.  Even more surprising was the fact that SIRT1 activity did now show a statistically significant change with aging in either males or females, however.  Again, this is puzzling, since NAD levels declined so much.

References: 

C,  Studies that showed how nuclear levels of NAD decline with aging – Studies of Wallerian degeneration in the brain and mitochondrial biogenesis in muscles linked NAD deficiency in the nuclear subcellular compartment to the occurrence of Wallerian degeneration, and the “mitochondrial failure” seen with aging. 

Long ago, there was circumstantial evidence that NAD levels may be regulated on a subcellular compartmental level, the significance of this was unknown, since no one had measured NAD levels in various sub cellular compartments.  For instance, it was well-known that three isoforms of NMNAT existed [NMNAT-1 in nuclear compartment, NMNAT-2   in the Golgi complex, and NMNAT-3 in the mitochondria], the significance of this was not understood.  NMNAT is a key enzyme since it is the only enzyme shared by both pathways for NAD synthesis, the NAD biosynthesis de novo pathway  and the NAD Salvage cycle pathway.

One clue to this significance was the discovery of a mutant mouse model of  Wallerian degeneration called the “Wlds mouse“,  which was protected from developing Wallerian degeneration following axonal injury.  It was discovered that the Wlds mouse  had an 3 extra copies of a 85 kb tandem triplication on the end of chromosome 4 that contained two protein-coding genes for UCH-L1 (UPS gene) and NMNAT-1 (NAD synthesis  gene for the nuclear isoform of NMNAT).  These extra copies of the NMNAT-1 gene in the Wlds mouse resulted in a 3-fold higher NMNAT activity in the brain, but whole brain NAD+ levels were not increased.  This Wlds mouse study was published by Wang and He from Boston in 2009, but they did not show that nuclear NAD levels were actually reduced with aging or Wallerian degeneration.

More recently, in a December 2013 paper Gomes and colleagues from Sinclair’s lab in Boston showed that in mice, declining NAD levels in the nucleus of  muscle cells induced a pseudohypoxic state, disrupting nuclear-to-mitochondrial communication with aging.  In 3 separate experiments, he “knocked down” NMNAT-1, NMNAT-2   and NMNAT-3.  Only NMNAT-1 knock-down mimicked aging and the mitochondrial dysfunction seen with aging.  Although not published, Sinclair has measured NAD levels in the nuclear subcellular compartment and has showed that nuclear NAD levels decline with aging in mice.  In his key 2013 paper, he did publish evidence that IP supplementation with 400 mg/kg of NMN for one week reversed this “pseudohypoxic state” by promoting Tfam-dependent transcription of mitochondrially-encoded OXPHOS genes.

In summary, the indirect evidence about nuclear NAD levels from Wang and He’s work with the Wlds mice with 3 extra copies of the nuclear-specific isoform of NMNAT (NMNAT-1) as well as the more direct work on NMNAT-1 knockdown by Gomes and colleagues in Sinclair’s laboratory have provided tantalizing clues to a major cause of a “Universal phenotype of Aging:”   that of the decline in mitochondrial-encoded OXOPHOS genes, which includes increased ROS generation, Warbug-type metabolism, oxidative stress, NAD depletion, and eventually   ATP depletion in cells.  By turning on the Tfam gene via a SIRT1-mediated mechanism, induced by intraperitoneal high-dose NMN supplementation, Gomes and colleagues   increased expression of mitochondrial DNA encoded genes, thereby increasing the expression of mitochondrially-encoded OXPHOS genes.

Caveat:  The above three paragraphs make a strong case that one major cause of aging is a decrease in the nuclear levels of NAD co-enzyme, required for so many nuclear proteins involving DNA repair, epigenetic gene regulation, and apoptosis.  Unfortunately, no one has yet pin-pointed the cause of this “nuclear NAD decline” or demonstrated  that it can be reversed for more than one week.  The rest of this blog entry goes over 29 possible reasons why nuclear levels of NAD decline with aging.  Until someone demonstrates that they can permanently restore nuclear NAD levels, the exact cause of this aging phenomena must still be considered speculative.  Koch’s postulates must be proven.

2.  NAD/NADH ratio regulates aging independently of NAD content

-The longevity gene, NQO1, regulates aging by altering the NAD/NADH ratio in cells.   NQO1 does this by oxidizing NADH to NAD.   Beta-lapachone increases NQO1 enzyme activity and quercetin increases Nrf2-mediated gene expression of NQO1. 

Not only is the NAD content in the nucleus important for delaying/preventing aging, the redox ratio of NAD/NADH is also very important for delaying/preventing aging independently of the total NAD found in the cell.  Many genetic studies in model organisms have searched for “longevity genes” that regulate lifespan.  One of the curious findings from these studies is the gene that codes for the protein “NADH-quinone oxidoreductase 1″, or NQO1.  NQO1 oxidizes NADH to NAD, thereby increasing the NAD/NADH ratio.   Interestingly, Lee and colleagues from Korea recently showed that feeding animals beta-lapachone (aka Beta-L), an exogenous NQO1 co-substrate, prevented the age-dependent decline of motor and cognitive function in aged mice.  Beta-lapchone is a compound originally obtained from the Lapcho tree and has been used for medical purposes for many years.  Beta-L fed mice did not alter their food intake or locomotor activity, but did increase their energy expenditure as measured by VO2max and by heat generation.  The Beta-L fed mice developed changes in gene expression that mimicked 30% caloric restricted diets.  Another molecular effect of beta-Lapachone is that it induces apoptosis in breast and prostate cancer cells.

Gene polymorphisms in the NQO1 gene are strong prognostic indicators for breast cancer.  For instance, the NQO1 2 genotype (P187S) predicts poor survival from breast cancer(ref).  The relative risk for breast cancer in this with the P187S genotype is 6.15, when compared to control groups.  The P187S genotype does not affect local recurrence, but affects survival.

Interestingly, benzene poisoning is associated with the mutation of the NQO1 gene at codon 187, which creates the 609C-T mutation of the NQO1 gene.  This results in complete loss of the enzymatic activity of NQO1 protein.  By this mechanism, benzene produces a NOA1 “loss-of-function” mutation and induces hematological malignancies. This appears to be a major mechanism for chemotherapy-induced secondary malignancies, which are called “therapy-related malignancies”.  Two diseases that benzene induces are “therapy-related  leukemia” and “therapy-related myelodysplastic syndrome“.  The NQO1 gene can also be transcriptionally unregulated by a polyphenol called quercetin.  Specifically, quercetin increases gene expression of the NQO1 gene via an Nrf2 transcription factor mediated pathway(ref)(ref)(ref).  Specfically, quercetin enhances the binding of Nrf2 to the NRF-ARE binding site on the NQO1 gene promoter.   Quercetin also increases Nrf2-mediated transcriptional activity by up regulation gut e expression of Nrf2 mRNA and Nrf2 protein.  Quercetin also reduces the level of Keap1 protein, the binding partner of Nrf2, which prevents Nrf2 nuclear translocation.  Quercetin reduces Keap-1in a post-translational mechanism, thereby reducing Nrf2 ubiquitination and proteasomal degradation.  Another unusual up regulator of NQO1 is the toxin, dioxin.

The NAD World Part 4 blog enry contains additional discussion related to NQ01 and how it is egulated, beta lapachone and other topics mentioned in this item

References:

3.  Clock/BMAL1

CLOCK and BMAL1 regulate the circadian expression of the SIRT1 gene.  Day/night cycles are thus the #1 factor that determines SIRT1 expression.SIRT1 regulates circadian gene expression by deacetylating PER2

With long lists like those in this blog entry, it is easy to throw up your hands and say “its too complicated!”  Well it isn’t!  If you want to skip the list and just ask “What is the most important regulator of SIRT1 expression,” I do not think anyone would argue with the statement that CLOCK/BMAL1 bind to the gene promoter for SIRT1 and regulate the diurnal change in SIRT1 gene expression. (see references).

For example, it has been well-documented that liver insulin sensitivity correlates with the two circadian transcription factors CLOCK and BMAL1.  BMAL1, CLOCK, and SIRT1 all must work together to “turn on” and “turn off” 15% of the genome in human cells every day.  Unless the expression of these three proteins is coordinated, hepatic insulin resistance develops.   Constant darkness “dysregulates” the coordinated timing of BMAL1 and SIRT1.  As a result, BMAL1 and SIRT1 expression decreases with constant darkness and hepatic insulin resistance is induced.  Interestingly resveratrol can dramatically reverse the “dysregulation” of SIRT1-dependent circadian genes by increasing SIRT1 activity.  SIRT1 regulates circadian gene expression by PER2 deacetylation.

References:

4.  Long non coding RNAs 

The long non-coding RNA transcribed from the anti-sense strand of the SIRT1 gene regulates SIRT1 gene expression via a “trans-regulatory” mechaism.   Long non-coding RNAs also appear to regulate cellular senescence, metabolism and many other cellular functions.  

Introduction/Background

Recently, there has been dramatic shifts in the thinking of geneticists about the role of “junk DNA” in human disease, aging, and normal development.  Specifically, over 56,000 unique RNA transcripts have been identified via next generation sequencing (also called “deep sequencing” or RNAseq).  Of these, over 9,000 long non-coding RNA “genes” have been identified that make many more than 9,000 different RNA transcripts.  Although there are many other types of non coding RNA besides long non-coding RNA, these RNA sequences that are > 200 base pairs in length have garnered the most attention since they seem to have such powerful regulatory functions over and above even epigenetic gene regulatory mechanisms.

Some recent papers have suggested that of the 6,000+ gene polymorphisms (SNPs) that have been linked to disease by GWAS studies, as many as 93% of these SNPs are not due to protein-coding regions of the human genome, but instead are in regulatory areas.  Another surprising finding was that at least 5,000 (of the more than 9,000 DNA sequences that encode for long non-coding RNA) are not evolutionarily conserved.  What does this mean?  It means that these long non-coding RNA may be the “youngest” forms of gene regulation and may account for the unique characteristics of homo sapiens, such as our ability to make tools, form language, develop written communication, music, art, religion, socialization, etc.  In short, long non-coding RNA may be why we are “human”, rather than looking and acting more like our nearest cousins, the chimpanzees and bonabos.

SIRT1 gene-specific lncRNA

It is not surprising then that a long non-coding RNA has been discovered that regulates SIRT1 gene expression.  (see reference below).  This long non-coding RNA is transcribed from the anti-sense strand of the SIRT1 gene.  This lncRNA is called “SIRT1 antisense long non coding RNA” or SIRT1AS lncRNA for short.  Wang and colleagues from Shanghai, China discovered this and published their finding in April, 2014.  They were able to show that SIRT1 AS lncRNA expression results in an increase in expression of the SIRT1 gene.  They isolated SIRT1 AS lncRNA from differentiating myotubes from developing skeletal muscle, as well as from the spleen.  It appears that the SIRT1 AS lncRNA expression is both temporal and tissue-specific.  For instance, higher levels of SIRT1 AS lncRNA were expressed in undifferentiated, younger tissues,   Likewise, SIRT1 AS lncRNA was expressed in a tissue-specific fashion.  In the spleen, SIRT1 AS lncRNA levels were higher than in skeletal muscle.

SIRT1 AS lncRNA may counteract microRNA that inhibit SIRT1

miRNA that down regulate SIRT1 gene expression appear to be blocked or their effect attenuated by the SIRT1 AS lncRNA.  Thus, the function of SIRT1 AS lncRNA may be to counteract the effects of miR-34a, miR-217, miR-181a, and the other microRNA that increase SIRT1 mRNA degradation and thereby reduce SIRT1 protein expression.

Long non coding RNAs and cellular senescence

Gene-specific lncRNAs can regulated only one specific gene, like the SIRT1 AS lncRNA described above.  However, many more lncRNAs regulate many genes rather than one specific gene.  Gene-specific lncRNAs typically regulate nearby genes, which is a method called “regulation in-cis”.   Since SIRT1 plays a role in cellular senescence, it is likely that the “Anti-sense” senescence-associated lncRNAs play an role in regulating genes that SIRT1also regulates.  A list of the top 12 up-regulated Antisense lncRNAs with cellular senescence along with a list of the top 15 Anti-sense  lncRNAs that are down regulated with cellular senescence are listed below.

In addition to the Anti-sense lncRNAs described above, a number of lncRNAs have been found that originate in pseudogenes, genes that no longer code for proteins, but are still transcribed from their sense or anti-sense strand.   lncRNAs can regulate a single gene or regulate hundreds of genes as well. lncRNAs that regulate many genes typically do so via a method called “regulation in-trans”.  These lncRNAs are not located near by the genes that they regulate, but instead, are typically located long distances away, even on other chromosomes.  Many of these long non-coding RNAs are found in areas with no nearby protein-coding genes.  For this reason, they are called “Long intergenic non coding RNAs” or lincRNAs.

Several lincRNAs have been discovered that regulate cellular senescence via “trans regulatory” methods.  These lncRNAs appear to be “novel” and not within or associated with a particular protein-coding gene or a pseudogene.

Long non coding RNAs and metabolism

Since lncRNAs have been discovered that regulate cellular senescence, it is no surprise to find out that lncRNAs regulate metabolism as well.  There is strong evidence that insulin resistance may be mediated in part by lncRNAs.  This includes tissue-specifc lncRNAs and generalized lncRNAs.  For instance, the long non coding RNA called “H19″ may be involved in the intergenerational transmission of diabetes mellitus.  In a large next-generation RNA sequencing study of pancreatic RNA transcripts, over 1,000 lncRNAs were discovered in pancreatic islet beta cells.  Of these, 40% were long intergenic non coding RNAs (lincRNAs) and 55% were Anti-sense strand long non-coding RNAs (AS lncRNAs).  Interestingly, the non-coding RNA sequences found via this next generation sequencing study were more “tissue-specific” than the mRNA for protein-coding genes in the pancreatic tissue examined.  In other words, non-protein coding RNAs had a more “tissue specific signature” than the protein-coding mRNAs that were sequenced.  This is quite remarkable.

References:

Antisence Long Non-coding RNAs that are Differentially  Regulated with the induction of Cellular Senescence

Image may be NSFW.
Clik here to view.
NAD3-15n

Summary:  It is likely that much of the regulation of protein-coding genes and the unique aspects of humans, human aging, and human disease may be due to the “invisible human genome”, which is the large number of non-coding RNAs.  This field is exploding, with new RNA sequences being discovered every day.  Already, an Antisense strand long noncoding RNA has been discovered at the SIRT1 gene, which increases SIRT1 gene expression by a yet unknown mechanism.  One possibility is that this lncRNA prevents or inhibits the functions of miRNAs which increase SIRT! mRNA degradation.   Other lncRNAs have been found that regulate cellular senescence, metabolism, etc. via “trans regulatory” or “cis regulatory” methods.

5.  Nicotinamide (Nam)

Nicotinamide is a direct inhibitor of both the SIRT enzymes and the PARP enzymes.

The accumulation of excess nicotinamide in cells is probably a major cause of aging.  Whereas we typically associate “NAD deficiency” with aging, “Nam excess” may have a similar effect.  To no one’s surprise, the levels of the two compounds are inversely related in aging.

Nam plays a role in both aging and in disease.   In hypertension and in aging individuals with normal blood pressure, Nam inhibits the methylation-mediated degradation of catecholamines.  Thus Nam excess plays a role in hypertension (see references below).

Nicotinamide also has an epigenetic effect. When SIRT1 is inhibited, cells age and cancer oncogenes are re-activated.  SIRT1 silences these genes  by histone deacetylation of H3K9 and H4K16 residues on the histones of these oncogenes.

A recent article showed that in rats, nicotinamide supplementation during pregnancy causes global DNA hypomethylation in rat fetuses.  Nicotinamide has detrimental effects in development, detrimental metabolic effects, and detrimental epigenetic effects when given to young rats.  Low dose nicotinamide increased weight gain in developing rats.  High dose nicotinamide did not, however.  The livers of nicotinamide-fed young rats had more DNA damage (8oxoG), impaired glucose tolerance, and increased insulin resistance.  Nicotinamide increased the levels of N-methylnicotinamide in the blood and decreased betaine levels in the blood.  This resulted in a global hypomethylation of DNA in the rat genome.  Nicotinamide also had “gene-specific effects” on CpG islands within the promoters of the following genes:

  1. NNMT gene – this was down-regulated
  2. DNMT genes – these were down-regulated
  3. Homocysteine metabolism genes – these were down-regulated
  4. Antioxidant genes and oxidative stress protection genes – these were down-regulated

Since niacin is converted into nicotinamide in human tissues, high dose niacin probably produces all of the above effects.  A recent paper called niacin and nicotinic acid “methyl consumers” and strongly suggested that high niacin/nicotinic acid intake is bad.

Excess nicotinamide has also been shown to increase plasma serotonin and histamine levels in humans, due to disrupting the metabolism of these neurotransmitters.  This is probably due to the fact that methyl donors and methylation enzymes are needed for serotonin/histamine metabolism.   Most importantly, nicotinamide is a direct inhibitor of the Sirtuin enzymes (SIRT1-7) and the PARP enzymes (all 17 of the PARPs).

The molecular mechanism by which Nam works is very straightforward. Nam acts as a direct inhibitor of the SIRT1 enzyme pocket where NAD binds.  Thus Nam is a “competitive inhibitor” of NAD and is “bad” when it comes to most cancers, aging, and most diseases.

On the other hand, inhibition of SIRT1 by Nicotinamide may be a “good thing” in the brain, where it may prevent NAD+ depletion and thereby protect neurons against excitotoxicity and neuronal cell death induced by PARP1.

As the cell consumes NAD (by SIRT1-7, PARP1, PARP2, Tankyrases, CD38, CD157, ARTs, and other enzymes), the NAD is consumed, leaving the by-product, Nam.   There are two primary ways  of “disposing of Nam”.  They are methylation/excretion or recycling of Nam into NMN (and subsequently NAD) via the “NAD salvage cycle”.  

Here are the problems with both of these methods of reducing Nam levels in the cell.  (see #2 and #3 below).

References:

Conclusion:  It is now clear that high concentrations nicotinamide are harmful to health.  HIgh doses of dietary niacin probably produce the same effects, despite the many benefits of high dose niacin.  With aging, nicotinamide levels already go up.  Adding more nicotinamide is probably not going to “cure” aging.  Adding a methyl donor to eliminate nicotinamide (such as betaine) may be a good thing.

6.  NAMPT

-NAMPT is the rate-limiting step in the NAD Salvage Cycle, and is regulated in a circadian fashion.

The enzyme that converts Nam back into NMN in the “NAD salvage cycle” is Nicotinamide phosphoribosyl transferase, or NAMPT.  Unfortunately, NAMPT is regulated by circadian rhythms and is primarily up-regulated at night.  It is inhibited by not sleeping, however.  It is also down-regulated by eating and sedentary lifestyle.  Fasting and exercise dramatically up-regulate NAMPT.   I really do not see how NMN or NR will really change the gene expression of NAMPT.  If anything, since NMN is the “product” of the NAMPT enzyme, high levels of NMN may actually have a “feedback inhibition effect” on NAMPT, just like Nictoinamide has a “feedback inhibition effect” on SIRTs and PARPs.

Paradoxically, in a recent study in zebrafish, resveratrol actually DECREASES the expression of NAMPT.  This may be via a “feedback inhibition effect”, since SIRT1 “auto regulates” its own gene expession (see references).   Another interesting “twist” is that Angiotensin II receptor blockers (ATR type 1 blockers) actually increase NAMPT gene expression.  This may be the molecular mechanism behind the longevity effects of ATR1 blocker medications like Telmisartan.

References:

 7.  NNMT – Methylation of Nicotinamide – Nam)

Methylnicotinamide is a “mitohormetic compound” that regulates longevity

Of all of the unusual aspects of Sirtuins and NAD metabolism, N-methylnicotinamide is probably the hardest one to understand.  Recent evidence has shown that for the longevity effects of NAD metabolism to occur in nematodes (C. elegans), NAM must be methylated and then used by the gene, GAD-3, to produce low levels of hydrogen peroxide, thereby acting as a “mitohormetic compound”.  This low level of hydrogen peroxide induces mitochondrial biogenesis and is necessary for nematode lifespan extension.

Reference:  2013 Role of sirtuins in lifespan regulation is linked to methylation of nicotinamide

This article came out last year and one of the co-authors is David Sinclair.

However, that is not the entire story.  There is much more to the story of the methylation of nicotinamide.  Most of this has to do with stopping the toxic effects of nicotinamide from occurring, due to the inhibitory effects of Nam on both the Sirtuin enzymes (SIRT1-7) and the PARPs (1-17).

Over 85% of transmethylation reactions occur in the liver, including the methylation of nicotinamide.  With the oral intake of nicotinamide, the liver could either methylate the nicotinamide or convert it to NAD.  From many studies, it is clear that the liver preferentially methylates nicotinamide, rather than converting it to NAD.   The reason why the liver methylates nicotinamide is that high concentrations of nicotinamide cause cell injury and cell death, since nicotinamide inhibits all 7 of the Sirtuins and also inhibits the PARP enzymes (PARP1,PARP2, etc).

For this reason, with oral intake of Nam, serum levels of N-methylnicotinamide increase.  Only 15% of nicotinamide methylation occurs outside of the liver.  Nicotinamide methylation by NNMT also requires a methyl donor, such as SAMe or trimethylglycine, which is also called betaine.  When nicotinamide is methylated, it is then excreted, thereby reducing Nam levels in the body and preventing SIRT/PARP inhibition.

GWAS studies of polymorphisms in the NNMT gene have revealed an amazing association with Non-alcoholic steatohepatitis (NASH).  The NNMT gene SNP, rs694539, is a SNP found in the regulatory portion of NNMT gene.  The “GG” genotype protects against NASH, with an OR of 0.58.  The “AA” genotype increases the risk of NASH with an OR of 7.3.   This suggests that methylation of nicotinamide is an important factor in preventing NASH (see references below).   This same polymorphism (rs694539) has been linked to bipolar disorder recently.  The association was “female gender-specific” and did not influence male bipolar risk.

A recent novel theory discussing how “too much NNMT” and “too little NNMT” may both play a role in aging and disease has been proposed. This theory suggests that excess dietary nicotinic acid consumption results in molecular/cellular  “methyl consumption” and plays a role in disease. This new theory has been published in Nature and is being taken seriously.  The main hypothesis is the increase in “methyl consuming compounds” in our diet contributes to metabolic syndrome and many other “man-made diseases”.  Another aspect of this new theory is that NNMT is a “fat accumulation gene”  (see references below), since the expression of NNMT is unregulated with increased dietary intake of food, especially foods that are rich in niacin and nicotinic acid.   Specifically, the expression of the NNMT gene correlates with the percentage of fat in 20 different mouse strains.  The main cause of the up regulation of the NNMT gene is overeating/overfeeding.   In fact, Kraus and colleagues recently showed that the administration of methylnicotinamide inhibited NNMT and this increased NAD levels and SAM-dependent gene expression.

References:

This theory has been proposed because of recent studies which show a paradoxical effect occurs when NNMT is over-expressed.  When this occurs, the NNMT over-expression results in diet-induced obesity.  This has been shown in humans and in animal models.  For instance, the NNMT gene is unregulated in fat cells with obesity and T2DM. When the NNMT gene is “knocked down”, it protects against diet-induced obesity.

Other references for nicotinamide methylation:

Here is the recent (2014)article on NNMT knock-down and the protection of diet-induced obesity: Nicotinamide N-methyltransferase knockdown protects against diet-induced obesity

8.   PARP-1 and PARP-2

PARPs are the #1 Intracellular “NAD consumers” .  PARP-2 is also a direct inhibitor of SIRT1.

  • The Poly-ADP-ribose polymerases (PARPs) are a large family of enzymes involved with DNA damage detection, DNA damage repair, and also cellular apoptosis.  They are voracious “NAD consumers” and use as much as 100-150 molecules of NAD when activated by one DNA break.   As a result, cells can become NAD depleted in the nucleus, where the PARPs reside.  They are also voracious “ATP consumers” and use up as much as 100-150 molecules of ATP when activated by one DNA break.  As a result, cells can become ATP depleted, which then induces cellular death.  Thus PARPs may be an important way of killing a cell by “suicide,” if there is too much DNA damage.
  • PARP-1 is not a direct inhibitor of SIRT1, but because it consumes so much more NAD than Sirtuins do, PARP1 inhibitors or PARP-1 “knock down” have been shown to increase SIRT1activity in cells.
  • PARP-2, on the other hand, is a direct negative regulator of SIRT1, independent of NAD activity. When PARP-2 activity increases, which it does with aging (by 10-fold), SIRT1 is inhibited, regardless of NAD levels.  However, the deletion of the PARP-2 gene results in hepatic cholesterol accumulation and decreased HDL lipoproteins.

References:

Conclusion: There is probably an “antagonistic cross talk” between SIRT1, PARP-1, and PARP-2 due to their mutual demand/need for NAD.  With aging, there is a “sterile inflammation” that occurs, often referred to as “inflammaging”.  Inflammaging appears to be directly under the control of the NF-kB transcription factor with antagonistic crosstalk between SIRT1, PARP1, and PARP2 signaling pathways.  There may be a role for a PARP inhibitor for health.  Pharmacological inhibition of PARPs has already been shown to improve skeletal muscle fitness and mitochondrial function in rodent models. In Part 4 of this NAD World series, we will discuss inflammationaging and the roles of NF-kB, NAD and SIRT1 in much further detail

9.  CD38 

CD38 is probably the #1 Extracellular “NAD consumer” (whereas PARPs are the #1 intracellular consumer)

CD38 is one of several “ectoenzymes” found outside the cell that are “NAD consumers”.  (The others are CD157, ART1, ART2, ART3, and ART4).  CD38 is a multifunctional membrane-bound extracellular enzyme that plays a key role in immunity, autoimmunity, and calcium signaling.  CD38 consumes NAD and makes cyclic-ADP ribose (cADPR).  Unfortunately, CD38 is a very inefficient enzyme and consumes as many as 100 NADs for every one cyclic-ADP-ribose that it makes.  For this reason, some experts on CD38 feel that the #1 function of CD38 is to regulate cellular NAD levels.  A strong argument for this theory is the recent discovery that CD38 is found inside the cell as well, bound to membranes on the inner portion of the cell nucleus.  Here it could deplete nuclear NAD.  Interestingly, the apple skin-derived flavanoid, apigenin, is a powerful inhibitor of CD38.  Treatment of cell cultures with apigenin increased NAD levels in the cells, reduced global acetylation of proteins, and reduced the acetylation of p53 and RelA-p65 subunits of NF-kB.

Reference: 2012 Flavonoid apigenin is an inhibitor of the NAD+ ase CD38: implications for cellular NAD+ metabolism, protein acetylation, and treatment of metabolic syndrome.

The classic description of CD38 has not been that of an “intracellular NAD level regulator”, but part of a signaling system involving cyclic ADP-ribose and calcium. Cyclic-ADP-ribose (cADPR) functions as a second messenger in the cell to trigger calcium release from the sarcoplasmic reticulum. CD38 is a very important membrane-bound enzyme found on the surface of many cells, but the highest density of CD38 are on the surface of immune cells such as monocytes/macrophages.

In the brain, CD38 is very important for the secretion of oxytocin from oxytocin-producing cells in the hypothalamus. Oxytocin has traditionally been thought of as the “maternal milk/nurturing hormone”, but in the brain it functions as a neurotransmitter.  In the brain, there are many locations for oxytocin type 1 (OTR1) and oxytocin type 2 (OTR2) receptors, located mostly in the telencephalon.  Oxytocin appears to be the “Peptide that binds our hearts in love”.  It has clearly been linked to maternal love, brotherly love, spousal/opposite sex affection, and community spirit.  It may be the peptide that is secreted in response to religious experiences of love for God as well.

References:

Here is a diagram that illustrates the possible way that CD induces NAD depletion and therefore causes metabolic syndrome:

Image may be NSFW.
Clik here to view.
An external file that holds a picture, illustration, etc.<br /><br /><br /><br /><br /><br /><br /><br /><br />
Object name is nihms193403f2.jpg

Ref for diagram:  CD38 as a regulator of cellular NAD: a novel potential pharmacological target for metabolic conditions

” Possible mechanism of regulation of SIRT1 and AMPK pathway by CD38 inhibition.

10.  MicroRNAs

16 microRNA have been found to regulate SIRT1 expression.  These miRNA are mostly negative regulators of SIRT1 expression by their binding to the 3′ UTR of SIRT1 mRNA, increasing SIRT1 mRNA degradation before they can be transcribed.  Different microRNA are expressed by different triggers, such as EtOH, p53, and Diabetes type II.

16 different micrRNAs have been found that regulate SIRT1 expression (see table below).   Different triggers induce the expression of each miRNA.   These microRNA all down-regulate SIRT1 expression.  This occurs because microRNA bind to a region in the 3′ untranslated region (3′ UTR) in the SIRT1 mRNA,  thereby increasing the degradation of SIRT1 mRNA.  Thus microRNA are a “post-transcriptional regulators” of SIRT1 gene expression.  This miR-mediated effect is likely the mechanism by which cancer increases the expression of SIRT1 and also the mechanism by which aging decreases the expression of SIRT1.

miR-217 - an miR that is activated by drinking EtOH

Ethanol also activates miR-217 gene expression and is one of the primary mechanisms responsible for alcoholic fatty liver disease and NASH (which is the clinically symptomatic form of alcoholic fatty liver disease).  NASH can lead to alcoholic cirrhosis, liver failure, ascites, and death.  miR-217 is also the mechanism by which HIV infections shorten lifespan, since tat-activated LTR expression induces miR–217.

miR-34a – an miR that is activated by p53

miR-34a has been the most studied microRNA when it comes to SIRT1 expression. It is involved in pancreatic cancer, colorectal cancer, prostate cancer, brain cancer, liver cancer, normal neural differentiation, liver metabolism, endothelial cell senescence, and endothelial progenitor cell senescence.

Ectopic miR-34a reduces SIRT1 expression. The gene for miR-34a is “turned on” by p53 protein.   miR-34a has been shown to induce cancer cell apoptosis in colon cancer cells.  miR-34a also promotes endothelial cell senescence in atherosclerosis.

miR-181a – an miR that is increased in diabetes type II

miR-181a binds to a region in the 3′ untranslated region (3′ UTR) in the SIRT1 mRNA, thereby increasing the degradation of SIRT1 mRNA.  Thus miR-181a is a “post-transcriptional regulator” of SIRT1 gene expression.   Over-expression of miR-181a results in insulin resistance.  Studies of the serum (plasma) of diabetics has shown that miR-181a is increased in the serum.  Studies of diabetics has also shown that miR-181a is increased in hepatocytes.  There is hope that inhibiting miR-181a may be a strategy for treating diabetes type II.

There are many other miRNAs that regulate SIRT1, listed below.

Image may be NSFW.
Clik here to view.
NAD3-15o

Table reference

References:

11.  p53

There are two binding sites for p53 on the promoter of SIRT1. They are located at positions 168 and 178 upstream from the TSS.  p53 binding to the SIRT1 promoter prevents gene expression of SIRT1, except with starvation. With starvation stress, p53 dissociates from the SIRT1 promoter and FoxO3a can “knock p53 off these two binding sites (168 and 178), thereby removing the repressive effects of p53 from the SIRT1 promoter, thereby resulting in SIRT1 gene expression.

References:

12.  FoxO3a and Eating (especially sugar):

Glucose induced Insulin signaling activates the Insulin/IR/IRS-1/PIP3K/Akt pathway which prevents Foxo3a from migrating into the cell nucleus and activating the SIRT1 gene. Fasting does the opposite. FoxO3a also enters the nucleus with fasting and “bumps” the two p53s off the two binding sites on the SIRT1 promoter, thereby abolishing the repression of SIRT1 by p53.

Reference:   2004 Stress-Dependent Regulation of FOXO Transcription Factors by the SIRT1 Deacetylase

13.  E2F1

The cell cycle and apoptosis regulator.

In actively growing cells, E2F1 is the transcription factor which controls cell-cycle fluctuations in SIRT1 levels. E2F1 induces SIRT1 gene expression in response to other factors also, such as cellular oxidative stress from exercise, low dose ETOH, chemo, XRT, and maybe your “oxidative stress water.” If this water would work as a “controllable timeable ROS dose,” this is the molecular mechanism by which it would work. OBTW, SIRT1 also has a negative feedback loop, inhibiting E2F1.

References:

14.  HIC1:CtBP co-repressor complex

The SIRT1 promoter has a binding site for a co-repressor complex called “HIC:CtBP”, which decreases SIRT1 gene expression. With CR and fasting or “fasting Mimetics like 2-DG”, the affinity of CtBP for HIC goes down, thereby increasing SIRT1 gene expression several fold. This is one of the primary molecular mechanisms of fasting.

References:

15.  ChREBP

 The carbohydrate response element binding protein.

ChREBP, is up-regulated with the dietary intake of carbohydrates. ChREBP is the “molecular link” between carbohydrate ingestion and high triglycerides in the blood.  (i.e. the glucose-induction of triglyceride synthesis.)   How does this occur?  Well, ChREBP represses the transcription of SIRT1.

ChREBP may play a major role in alcoholism and alcohol-induced fatty liver disease.  In a mouse model of binge drinking, ChREBP acetylation was increased dramatically and was recruited to gene promoters in mice.  The acetylation of ChREBP was dependent on alcohol metabolism rate.  In mice with mutant forms of ChREBP that could not be acetylated, the ChREBP-dependent genes could not be “turned on”.  ChREBP silencing in mice that were fed alcohol prevented the increase in triglycerides that normally occurs with binge drinking.  In addition, SIRT1 was down-regulated in these mouse models of EtOH binge drinking, due to the direct inhibitory effect of ChREBP on SIRT1 gene expression.

References:

Conclusions:  ChREBP is a “glucose sensor”.   ChREBP is the direct molecular link between high fructose or high glucose intake and the hepatic formation of triglycerides.  ChREBP is also a major inhibitor of SIRT1 gene transcription.  More importantly, ChREBP is the “binge drinking gene.”

16.  CREB

The cyclic-AMP response element binding protein,

CREB, activates SIRT1 gene expression. This is activated by low glucose levels, which happens with fasting.  CREB may also be the transcription factor that explains some of the paradoxical effects of SIRT1 over-expression.  In mice that over-express SIRT1, an atherogenic diet does not worsen glucose metabolism.  Instead, SIRT1 over-expression protects these mice fed an atherogenic diet from glucose dysregulation (i.e. insulin resistance).

However, in these SIRT1 over-expressed mice on an atherogenic diet, their atherosclerotic lesions actually get much worse than controls.   The reason for this is that SIRT1 deacetylates CREB, preventing its cyclic-AMP phosphorylation.  Thus SIRT1 inhibits CREB from activating gluconeogenic genes and inhibits CREB from activating hepatic lipid metabolism and excretion. In summary, CREB activates SIRT1 gene expression, and SIRT1 has a negative feedback effect on CREB function.  This explains how SIRT1-mediated CREB deacetylation regulates the balance between glucose and lipid metabolism.

ReferenceS:


Conclusion:  CREB is a “glucose and lipid sensor” with reciprocal interactions with SIRT1.  CREB activates SIRT1, which is the opposite of ChREBP.  Fasting activates CREB, whereas fasting inhibits ChREBP.  Moreover, when there is too much fat, but SIRT1 is over-expressed, CREB cannot prevent atherosclerosis and atherosclerosis worsens.

17.  TLX

TLX is one of the “orphan nuclear receptors”.

TLX binds to a TLX-response element in the SIRT1 promoter.  TLX is short for “Tailess.”

TLX is a very important transcriptional repressor in the brain, especially in neural stem cells and is vital to normal growth and development. As of now, no endogenous ligand for these ligand-dependent transcription factors has been identified.  It is a “druggable” target, however.

So far, only three compounds have been found out of a 20,000 compound high-throughput screen that bind to TLX (ccrp1, ccrp2, and ccrp3).  Although many functions for TLX have been discovered, the main cellular function of TLX appears to be keeping neural stem cells in their undifferentiated, proliferative state.  TLX regulates the expression of another nuclear receptor, the “retinoic acid receptor” or RAR.  Thus TLX is an important receptor. TLX is an oncogene-induced senescence suppressor inside and outside of the brain.  It has been shown to be effective in the prosate.

TLX  co-regulates the cyclin-D kinase inhibitor, CDKN1A (aka p21WAF/CIP1) with SIRT.  Very little is known about this orphan nuclear receptor other than the fact that it activates SIRT1 gene expression.

References:

18.  C/EBP-alpha and beta

C/EBP-alpha and C/EBP-beta – the two hepatic CCAAT/enhancer binding proteins with opposite effects on SIRT1/

In the liver, there are two opposing transcription factors that play a major role in liver biology, glucose metabolism, and fat metabolism: CCAAT/enhancer binding proteins alpha and beta.  These two transcription factors are also expressed elsewhere, outside of the liver, but the general role of the two appear to be similar – they have opposing roles on gene expression.

  •  The CCAAT/enhancer-binding protein alpha (C/EBP-alpha) is a transcription factor that represses many genes and activates many genes.  The most important 3 are SIRT1, p53, and PGC-1a.
  • There is also a C/EBP-beta that has the opposite effects on these genes.

For instance C/EBP-alpha represses the hTERT gene, thereby preventing cancer induction of telomerase.   C/EBP-beta, on the other hand increases the expression of the hTERT gene, thereby increasing telomerase enzymes.

C/EBP-alpha activates SIRT1 gene expression via binding to the promoter region of SIRT1.  The opposite is true about C/EBP-beta.  It represses SIRT1 gene expression.

In old age, SIRT1 cannot be up-regulated very well due to the repressor effects of the C/EBP-beta/HDAC1 complex, which both work together to suppress SIRT1 gene expression.

Interestingly, pomegranate seed oil has 3 ingredients in it (xanthigen, fucoxanthin, and punicic acid) that appear to down regulate C/EBP-beta and thus prevent fat accumulation.  Xanthigen up regulates SIRT1 and AMPK signaling in differentiated fat cells also.

References:

Conclusion: The two CCAAT/enhancer-binding proteins alpha and beta have important opposing effects on tissue regeneration, glucose metabolism and fat metabolism.  In general, C/EBP-alpha prevents fat accumulation and promotes liver regeneration, whereas C/EBP-beta has the opposite effect.  C/EBP-alpha increases SIRT1 gene expression, whereas C/EBP-beta and HDAC-1 combine to repress the promoter of SIRT1.

19.  BRCA1

BRCA1 increases the expression of NAMPT, PARP1 and SIRT1, whereas BRCA1 mutation, promoter methylation, or knockdown decreases NAMPT, PARP1, and SIRT1 gene expression, but paradoxically increases NAD levels, which then increase SIRT1 activity (but not SIRT1 gene expression).  Thus BRCA1 may be a “balancer” between SIRT1 gene expression and SIRT1 protein activity

Two decades ago, the first breast cancer susceptibility gene was discovered and called “BRCA1″.  Now we know the BRCA1 protein (which is involved in double stranded DNA repair), is mutated in hereditary forms of breast and ovarian cancer.  Inherited BRCA1 mutations can lead to cancers of the breast, ovary, and many other organs.  For breast cancer, the risk due to the mutation is increased to 56-80%.  For ovarian cancer, the risk is increased to 15-60%.   BRCA1 regulates the expression of 7% of the mRNA in cancer cells.  This is probably why it is so important and should therefore be called a “transcriptional regulator”.

Although a lot of research was being done about BRCA1 and cancer, no one had linked BRCA1 to Sirtuins or NAD until very recently.  Recently, the BRCA1 protein was found to control NAMPT-mediated NAD synthesis, which was a surprise.  Another surprise was that NAD levels could have a “feedback activation” of BRCA1 expression.  Moreover, it has been shown that BRCA1 is a positive regulator of PARP1 levels and NAD-dependent PARP1 activity.  Most recently, BRCA1 was found to also positively regulate SIRT1 expresión. BRCA1 binds to the SIRT1 promoter and activates SIRT1 gene expression. SIRT1 then inhibits the expression of Survin by deacetylating the H3 histones of the Survivin gene. BRCA1 also inhibits Survivin. Without SIRT1 or BRCA1, Survivin levels increase and Cancer develops.

BRCA1 may also play a role in preventing hypertension.  One of the major pathways in spontaneous hypertension is the Angiotensin II pathway and the activation of the ATR1 and ATR2 receptor by Angiotensin II.  ATR1 receptor activation induces NAD(P)H oxidase-induced free radical formation and the vasoconstriction of blood vessels due to reduced NO production.  A recent article showed that BRCA1 limits Angiotensin II ATR1-mediated redox signaling, thereby improving vascular reactivity and reduces blood pressure in spontaneously hypertensive mice.

References:

Image may be NSFW.
Clik here to view.
NAD3-15p
Illustration Reference:  2015 Linking BRCA1 to NAD World  “Figure 1. Proposed model of crosstalk among BRCA1, SIRT1 and PARP1. A, BRCA1 inactivation may regulate SIRT1 and PARP1 levels, and induce an increase in NAD-mediated SIRT1 and PARP1 activity. B, the model shows a significant effect of BRCA1 in the maintenance of SIRT1-related biological processes. C, a proposed model to maintain stable BRCA1 and PARP1-related DNA repair ability.”

20.  SNPs in the SIRT1 promoter

Evolution and the “Feast or Famine” SNP in the SIRT1 promoter region in Northern India. rs12778366 is a single nucleotide polymorphism (SNP) found 1.46 kb upstream from the TSS in the SIRT1 promoter that predisposes N Indians to type II diabetes. > 80% of N. Indians have this SNP and have a 6-9 fold higher risk of T2DM. This SNP was probably “selected by famines” that often occurred in N India for 1,000s of years. Now it is a liability, since famines no longer occur

21.  EGR1 

Mechanical stretching of muscles:

The SIRT1 gene is upregulated by the stretching of muscle fibers via the transcription factor “Early Growth Response Factor 1″, or EGR1. Mechanical stretching of muscles increases mRNA for SIRT1 by 2.2 fold and SIRT1 protein by 100%! This is why stretching before and after exercise is so important, since SIRT1 expression causes FoxO3a deacetylation (and thereby induction of the mitochondrial SOD gene) as well as Nrf2 Deacetylation (and thereby induction of many antioxidant genes).

22.  DBC1 (aka CCAR2)

“Deleted in Breast Cancer 1″ is probably a bad name for this protein, since it may not even be deleted in most breast cancers.

For this reason, the new name for DBC1 is “Cell cycle activator and apoptosis regulator 2″, or CCAR2. DBC1 directly interacts with SIRT1 by forming a stable complex with DBC1, thereby preventing the activity of SIRT1 in vitro and in vivo.  Interestingly, SIRT1 and DBC1 protein levels are higher in breast cancer tissues, compared to age-matched controls, but not at the transcriptional level.  At the transcriptional level, there does not appear to be up regulation of SIRT1 and DBC1.  This up regulation of SIRT1 and DBC1 is therefore at the “postranscriptional level” (i.e. via microRNA or microRNA sinks).  In gastric adenocarcinoma, overexpression of SIRT1 and DBC1 are actually associated with a better prognosis.

Reference:

23.  c-Myc

There is now evidence that the SIRT1 gene expression is “downstream” from the oncogene, c-Myc.  In cancer, there is a “positive feedback loop” that occurs, which results in contributes to the development of cancer.  Specifically, c-Myc activates SIRT1, which in turn promotes SIRT1 function.   Likewise, SIRT1 promotes c-Myc function.  Here is the article on this.  This “mutual positive feedback” between SIRT1 and c-Myc is why there is so much confusion as to whether SIRT1 is a tumor suppressor or a tumor enhancer.

Reference:  2011 The c-MYC oncoprotein, the NAMPT enzyme, the SIRT1-inhibitor DBC1, and the SIRT1 deacetylase form a positive feedback loop

“Silent information regulator 1 (SIRT1) represents an NAD+-dependent deacetylase that inhibits proapoptotic factors including p53. Here we determined whether SIRT1 is downstream of the prototypic c-MYConcogene, which is activated in the majority of tumors. Elevated expression of c-MYC in human colorectal cancer correlated with increased SIRT1 protein levels. Activation of a conditional c-MYC allele induced increased levels of SIRT1 protein, NAD+, and nicotinamide-phosphoribosyltransferase (NAMPT) mRNA in several cell types. This increase in SIRT1 required the induction of the NAMPT gene by c-MYC. NAMPT is the rate-limiting enzyme of the NAD+ salvage pathway and enhances SIRT1 activity by increasing the amount of NAD+. c-MYC also contributed to SIRT1 activation by sequestering the SIRT1 inhibitor deleted in breast cancer 1 (DBC1) from the SIRT1 protein. In primary human fibroblasts previously immortalized by introduction of c-MYC, down-regulation of SIRT1 induced senescence and apoptosis. In various cell lines inactivation of SIRT1 by RNA interference, chemical inhibitors, or ectopic DBC1 enhanced c-MYC-induced apoptosis. Furthermore, SIRT1 directly bound to and deacetylated c-MYC. Enforced SIRT1 expression increased and depletion/inhibition of SIRT1 reduced c-MYC stability. Depletion/inhibition of SIRT1 correlated with reduced lysine 63-linked polyubiquitination of c-Myc, which presumably destabilizes c-MYC by supporting degradative lysine 48-linked polyubiquitination. Moreover, SIRT1 enhanced the transcriptional activity of c-MYC. Taken together, these results show that c-MYC activates SIRT1, which in turn promotes c-MYC function. Furthermore, SIRT1 suppressed cellular senescence in cells with deregulated c-MYC expression and also inhibited c-MYC–induced apoptosis. Constitutive activation of this positive feedback loop may contribute to the development and maintenance of tumors in the context of deregulated c-MYC.

24.  AROS

Active Regulator of SIRT1

AROS is an endogenous activator of SIRT1.  AROS may bind to the site where resveratrol and other STAC activators bind to SIRT1, but this is still unclear.  What is clear is that AROS increases SIRT1 activity and works with SIRT1 to suppress p53 activity.  Specifically AROS works with SIRT1 to deacetylate p53, thereby reducing p53-mediated transcriptional activity (gene expression of genes dependent on p53).  Thus SIRT1 and AROS are negative feedback regulators of p53.

Reference: 2007 Active Regulator of SIRT1 Cooperates with SIRT1 and Facilitates Suppression of p53 Activity

25.  HuR

The Hu protein called HuR is an RNA binding protein that stabilizes the SIRT1 mRNA, preventing its degradation

Many RNA binding proteins have been recently discovered that degrade or stabilize messenger RNA (mRNA).  This includes the mRNA degrading RNA-binding proteins, AUF1, BRF1, TTP, and KSRP. The mRNA-stabilizing RNA binding proteins include the elav/Hu proteins, of which HuR is one.  HuR is probably the most well-known RNA-binding protein that reduces mRNA degradation.  It binds to the SIRT1 mRNA in the cytoplasm to prevent the SIRT1 mRNA from being degraded. Whereas the 16 different miRNA that bind to SIRT1 mRNA all promote its degradation, HuR binds to the same 3′ UTR region on the SIRT1 mRNA, thereby preventing the miRNA-mediated degradation of the SIRT1 mRNA.  The net result of HuR is that there is more SIRT1 protein as a result of the same level of SIRT1 gene transcription.

Reference: 2007 Phosphorylation of HuR by Chk2 Regulates SIRT1 Expression

26.  JNK2

The c-Jun Kinase, JNK2 phosphorylates the SIRT1 protein, thereby stabilizes the SIRT1 protein 

The SIRT1 protein has several phosphorylation sites on Serine amino acid side chains.  Ser27 is one of these sites that gets phosphorylated indirectly by JNK2 activation.  When the Ser27 site on SIRT1 is phosphorylated, the SIRT1 protein becomes much more resistant to proteasome-mediated degradation.  Thus it increases the half life of the SIRT1 protein from < 2 hrs to > 9 hours.  This is a very important part of maintaining SIRT1 protein levels within the cell.

Reference: 2008 JNK2-dependent regulation of SIRT1 protein stability

27.  Resveratrol, SRT1720, SRT2104, EX527

Resveratrol is a natural STAC activator.  Synthetic STAC activators such as SRT1720 have also been synthesize

The initial excitement about Sirtuins was primarily directed towards the natural compound, reseveratrol, found in red grape skins, Japanese knotweed, and many other plants.   Resveratrol and other STAC activators only activate SIRT1 and not SIRT2-7 or the PARP enzymes.  For this reason, resveratrol may hold certain advantages over NAD therapy or NAD precursor therapy such as NR or NMN.  The STAC-activating site on SIRT1 is near amino acid E320.  This site is not present on the other 6 isoforms of mammalian SIRT (SIRT2-7).

References:

28.  Lamin A

Lamin A is part of the nuclear cytoskeleton and may bind to the C-terminus of SIRT1.   Resveratrol may activate SIRT1 in a Lamin A-dependent manner.

There is a link between accelerated aging and the Laminopathies.  The most well-known laminopathies is Hutchinson-Gilford Progeria Syndrome, or HGPS.  In HGPS, a mutation in the Lamin A gene produces a mutant protein called “progerin”, which results in a breakdown of the cytoskeleton of the nuclear matrix.  This results in premature aging and usually death due to an MI or stroke during teenage years.  Recently, Gosh and colleagues from China have linked Lamin A and SIRT1.  According to their work, the C-terminal tail of SIRT1 binds to Lamin-A.  Thus lamina A may serve as a “SIRT1 anchor” in the cell nucleus.

Gosh and colleagues also showed that reseveratrol activates SIRT1 in a Lamin A-dependent manner.  Specifically, they showed that resveratrol increased the binding of SIRT1 to Lamin A and also down-regulated FoxO3 acetylation (SIRT1 is a known FoxO3 deacetylator).  Not all experts agree with this mechanism of action.  It has not been verified by a 2nd research laboratory.   However, this is very intriguing that reseveratrol may be a compound that could help treat HGPS.

Reference: 2013 Resveratrol activates SIRT1 in a Lamin A-dependent manner

Aging 

Aging lowers SIRT1 activity by multiple mechanisms.   The primary mechanism was once thought to be due to decreased gene expression of the SIRT1 gene, but this may not be true in the majority of cases.  Instead, age-induced reduction in SIRT1 activity is probably due to declining levels of NAD, increasing levels of Nicotinamide, and increasing levels of DBC1.

Reference: 2011 Age Related Changes in NAD+ Metabolism Oxidative Stress and Sirt1 Activity in Wistar Rats

Coming”  Part 4 of the NAD world (comment by Vince Giuliano)

This has been another Chapter in the extended NAD story.  But, as usual there is much more to tell.  Jim Watson will explain some of that in the forthcoming NAD World Part 4 blog entry,  For one matter, there will be a substantial discussion there of the relationship of SIRT1 to inflammation,  Also, what might be of prime importance for health and longevity may not be the actual concentration of NAD+ in cells or cell nucli, but rather the NAD+/NAD ratio which may not be affected by NAD precursor supplements and rather driven by other matters such as expression of the NQ01 gene.  The forthcoming blog entry will also look into the much-discussed Warburg effect, which appears to be driven by far more than scarcity of NAD+. Jim Watson will discuss factors that can possibly drive the tendency to Warburg-like metabolism with aging, including the expression of three long non-coding RNAs that promote it via three different mechanisms. Also, Jim will touch upon some additional NAD-related intervention strategies that go beyond those normally discussed in the longevity literature. ,uvlong non-coding RNAs.

Part 4 of the NAD world: the NQ01 gene, the Warburg effect, SIRT 1 and inflammation, and possible interventions

By James P Watson with contributions and editorial assistance by Vince Giuliano

This Part 4 blog entry goes even further into the extended NAD story, examining important subtopics:

  1. The ratio NAD+/NADH in cells and the body, which may be as or more important than absolute levels of NAD+ for driving health.
  2. The NQ01 gene which drives the NAD+/NADH ratio, and factors related to its activation and expression: BET proteins, the 20S proteasome, BET inhibitors, NQ01 regulation of PGV-1alpha, Nrf2 regulation, etc
  3. The Warburg effect, changes in cell metabolism characteristic of cancers and aging, its causes, effects and how NAD+ level is only one of several factors affecting it. Why the view that “The Warburg effect is caused by a nuclear state of pseudohypoxia which is caused by insufficient NAD+” is incomplete.
  4. Reversing Warburg metabolism – known approaches and the possible use of phytosubstances; possible limits of reversal.
  5. SIRT1 and inflammation, and why control of inflammation has such paramount importance
  6. In the course of these discussions, a review of possible intervention approaches. ones not commonly discussed in the longevity litterture.

Image may be NSFW.
Clik here to view.
NAD+ kinase Image source

The  Part 1 blog entry in the NAD World series provided an overview treatment of the NAD World and its nuances: to identify the major molecular entities involved, their roles, health and longevity ramifications, the reasons for the current excitement, and to begin to clarify what is actually known and what the remaining uncertainties are. 

The Part 2 blog entry in the NAD World series concentrates on the reasons for focusing on NAD+, particularly with respect to interventions that are seriously likely to lead to longer healthier lives.  It discusses molecular processes in the NAD salvage cycle that are responsible for the health-inducing and life-extending properties of calorie restriction, and further discuss the key roles of Sirtuins, SIRT1, SIRT6 and SIRT7 in particular.

The Part 3 blog entry in the NAD World series identifies 30 Major Factors that Control SIRT1 Expression, SIRT1 Activity, and SIRT1-mediated Aging.I.  The NAD+/NADH ratio and what affects it. The NQ01 gene.

   I.  The NAD+/NADH ratio and what affects it. The NQ01 gene

 What is of prime importance for health and longevity may not be the actual concentration of NAD+ in cells or cell nucli, but rather the NAD+/NAD ratio which may not be affected by NAD precursor supplements and rather be driven by other matters such as expression of the NQ01 gene,

In the Part 1 blog entry, we characterized the NAD Salvage Cycle by which NAD+ and NADH (the oxidized and reduced forms of NAD) are cycled back into each other and the de-novo pathway  via which new NAD is introduced into the body and cells.  And. in Parts 1,2 and 3 we discussed how various factors affect the cycling process such as circadian clock gene control.  In Part 3 we introduced and initially discussed the NQO1 gene which is a point of departure for the current discussion. “The longevity gene, NQO1, regulates aging by altering the NAD/NADH ratio in cells.   NQO1 does this by oxidizing NADH to NAD.   Beta-lapachone increases NQO1 enzyme activity and quercetin increases Nrf2-mediated gene expression of NQO1.”

I am now confidence that supplementation with a NAD+ precursor like NMN or NR transiently increased the ratio of NAD+  to NADH (NAD/NADH), but the ratio returns to normal in the course of continued supplementation.  This is because there is an enzyme that regulates the NAD/NADH ratio.  The ratio is NOT determined by dietary intake or IV intake of any compound.  It is enzymatically controlled. That enzyme is called  “NAD(P)H dehydrogenase, quinone 1″, or NQO1 for short.  NQO1 is an unusual gene in that it requires NADH as a co-factor but does not convert the NADH into nicotinamide, like the Sirtuins or PARPs.  Instead, it converts NADH to NAD+.  (i.e. it only oxidizes NADH to NAD+).

The oxidation of NADH increases NAD+ levels  within the cell and at the same time, decreases NADH levels within the cell.  As a result, the NAD+/NADH ratio  increases (or the NADH/NAD+ ratio decreases).

Why is NQO1 such an important gene?  Well here are the “Top 10 Reasons”.

1,  NQO1 regulates the intracellular redox state of the cell and thus, the ratio of NAD/NADH in the cell.

This is the main reason why I now think that NQO1 is so important.  Mice that are homozygous negative (both genes knocked out) for NQO1 have an increase in the NADH/NAD ratio (and an increase in the NADPH/NADP ratio).  NQO1 knockout mice strangely enough have lower blood glucose levels, less abdominal fat.  However, they have higher levels of triglycerides, beta-hydroxybutyrate, pyruvate, and lactate.   They also have higher levels of glucagon.   More importantly, the NQO1 “knock out” mice have lowered rates of pyridine nucleotide synthesis,  reduced glucose metabolism, and reduced fatty acid metabolism.  This is not surprising since NQO1 is the controller of the 20S PC mediated degradation of PGC-1alpha.

Unfortunately, cancer cells have also discovered this wonderful property of NQO1.  Many cancers unregulate NQO1 either via Nrf2 pathways or by other methods, such as the loss of miR suppression of mRNA for NQO1.  A recent study shows that higher levels of the NQO1 protein predict poor prognosis in non-small cell lung cancer.  This is a sobering thought – cancer cells up-regulate antioxidant genes!  This does not mean that we should avoid phytosubstances that up-regulate NQO1, it just means that “cancer cells are smart”.

Introducing:  BET proteins

The opposite problem occurs in aging cells.  Aging cells have lower levels of expression of the gene NQO1.  This is not just due to a “lack of broccoli” or a “lack of exercise”.   Instead, the gene NQO1 is down-regulated by proteins called “epigenetic readers”.  The two “epigenetic readers” that suppress the Nrf2-induction of the NQO1 gene are called “Bromodomain and Extraterminal Proteins” (or BET proteins).  Specifically, Brd2 and Brd4 proteins “sit on top” of the histone protein acetylated lysines at the promoters of the Nrf2-dependent genes.  As a consequence, Nrf2 and the other transcription factors that “turn on” NQO1 gene cannot turn the gene on.  (This is why BET inhibitors like JQ1 are so exciting).

Summary:  NQO1 regulates the ratio of NAD/NADH and the ratio of NADP/NADPH by oxidizing NADH to NAD+.   Warburg-type metabolism ensures that most of the NAD(H) within the cell is in the reduced form (NADH).  NQO1 is one of the few genes that oxidizes NADH to NAD+.  When both genes for NQO1 are  “knocked out”, there is even more NADH in the reduced state.  This results in a lower NAD/NADH ratio (or higher NADH/NAD ratio).  Thus, NQO1 is the “anti-Warburg gene”.   This is why NQO1 is so important.

References:

2001 In Vivo Role of NAD(P)H:Quinone Oxidoreductase 1 (NQO1) in the Regulation of Intracellular Redox State and Accumulation of Abdominal Adipose Tissue

2015 NQO1 protein expression predicts poor prognosis of non-small cell lung cancers

2013 Bromodomain and extra-terminal (BET) proteins regulate antioxidant gene expression

2.  NQO1 regulates the level of the co-activator, PGC-1a,within the cell by controlling degradation rate via the 20S proteasome.

PGC-1a is my “favorite co-activator” because it is so important in mitochondrial biogenesis.  I always thought that exercise activated PGC-1a gene via the “exercise kinase” called AMPK. (See he blog enry PGC-1-alpha and exercise).   This is why I was shocked to find out that NQO1 actually regulates PGC-1a, not by the increase in expression of the NQO1 gene, but the the rate that PGC-1a is degraded.  Expression of NQ01 keeps PGC-1a from being degraded.  What I found out is that the level of PGC-1a protein in a cell is primarily determined by its degradation rate, not its synthesis rate.

Like many regulatory factors, PGC-1a has an extremely short half life.  All of these extremely short-lived proteins are regulated by degradation rates, not synthesis rates.  In the past, it was thought that PGC-1a degradation was only regulated by the ubiquitin-proteasome system (UPS).  The UPS method involves a “protein tagger” that goes around putting a ubiquitin “tag” on the protein to be degraded.

Introduce: the 20S proteasome

However, recently a new process of proteasomal degradation has been discovered that does NOT involve any ubiquitination.  Specifically, this proteasome does NOT require ubiquitination of the protein and this proteasome system is called the “20S proteasome catalytic particle”  (aka 20S PC).  Unlike the ubiquitin-dependent, 26S proteasome system (UPS), the 20S proteasome does not require protein unfolding to degrade the protein.  (i.e. it can degrade proteins even without unfolding them).  Moreover, the 20S proteasome can handle oxidized proteins much better than the UPS 26S proteasome.  As a consequence, the 20S proteasome is the “oxidized protein degrader in stressed cells”.  For instance, it takes 4 times as much hydrogen peroxide to inhibit the 20S proteasome as it does to inhibit the 26S proteasome of the UPS.

Introducing: intrinsically disordered proteins (IDPs)

Not all proteins are degraded by the 20S proteasome, however. The main type of proteins degraded by the 20S PC system are called “intrinsically disordered proteins” (or IDPs).  Interestingly, the 20S proteasome system seems to be regulated by oxidative stress, via the glutathionylation of cysteine residues in the alph-rings of the 20S proteasome.

In conclusion, PGC-1a is a “intrinsically disordered protein” (IDP) that is regulated by its degradation rate.  When PGC-1a is damaged by oxidation or when the cell is under oxidative stress (like with aging), the 20S proteasome controls its degradation rate and thus the levels of PGC-1a within the cell.   Other IDPs besides PGC-1a include p53, c-fos, C/EBPa, p63, p33, p73a, and ornithine decarboxylase (ODC).

Interestingly, the 20S PC system has a “gate keeper” that inhibits the IDPs from being degraded.  Guess who the “gatekeeper” is for 20S PC? Yes, it is NQO1. That is how NQO1 expression keeps PGC-1a around.

 Summary:

There is strong evidence now that the levels of PGC-1a in cells is regulated primarily by the degradation rate of PGC-1a, and only secondarily by the gene expression of the PGC-1a gene.  There are two degradation pathways for PGC-1a.  The two pathways are the Ubiquitin Proteasome system (UPS) and the ubiquitin-independent proteasome system called 20S PC..

Under conditions of no oxidative stress, the UPS system may regulate PGC-1a levels within the cell.  However when the cell is under cellular stress and the PGC-1a protein is damaged by ROS-induced oxidation, the 20S proteasome controls the degradation rate of PGC-1a. NQO1 is the “gate-keeper” for this 20S PC system that prevents PGC-1a from being degraded during periods of cellular oxidative stress.  Thus with aging, the 20S PC system is more important than the26S proteasome  (i.e. the UPS) and thus the 20S proteasome degrades PGC-1a in the cell, unless NQO1 protects it from degradation. Thus it appears that under conditions of oxidative stress, such as with aging, NQO1 may be a major factor that controls the concentration of PGC-1a in the cell. 

References:

 2013 The Protein Level of PGC-1α, a Key Metabolic Regulator, Is Controlled by NADH-NQO1

2001 Degradation of oxidized proteins by the 20S proteasome

2014 Regulating the 20S Proteasome Ubiquitin-Independent Degradation Pathway

1998 Comparative resistance of the 20S and 26S proteasome to oxidative stress

2013 The Protein Level of PGC-1α, a Key Metabolic Regulator, Is Controlled by NADH-NQO1

2006 20S proteasomes and protein degradation “by default”

1996 Degradation of oxidized proteins in K562 human hematopoietic cells by proteasome

2013 Redox regulation of the proteasome via S-glutathionylation

3.  Lower levels of NQO1 leads to increased sensitivity to chemical-induced skin carcinogens.

A very interesting study was done looking at skin-induced cancer from carcinogens.  This study looked at NQO1-null mice and found that their levels of NADH was higher (as expected).

Normally, when skin is exposed to chemical carcinogens, p53 is rapidly unregulated.  In the NQO1-null mice, exposure to chemical carcinogens did not induce p53 and as a result, the cells did not undergo apoptosis.  Instead, they underwent transformation to cancer cells.  This is an amazing and very important finding.  One  feature of p53 induction in the skin is an increase in the appearance of melanin in the skin.  This is normally called a “tan” by most people, but on a molecular level, a “tan” is actually p53 induction.  This is why people with dark skin have a lower incidence of skin cancer (it is not all to do with the sun block effect of melanin.  It is all about p53).

In a study of various mutations in the NQO1 gene in human basal cell carcinomas, 3.1% of 457 cases were found to have “loss-of-function” mutations in the NQO1 gene.  Those “NQO1 loss-of-function” individuals were found to have more skin cancers than those with other mutations, but this was not statistically significant.  The authors concluded that NQO1 mutations were clearly associated with skin cancer risk, but that these mutations only accounted for a minority of skin cancers.

Summary:  NQO1 stabilizes p53 and prevents its degradation. p53 levels in the cell is tightly regulated by two separate degradation pathways – a ubiquitin-dependent pathway that is dependent on the p53 binding partner, Mdm2;  or the ubiquitin-independent pathway that is dependent on NQO1.   It appears that the NQO1-dependent (ubiquitin-independent) pathway is the most important pathway for regulating p53 levels within the cell.

In the experiment above, NQO1-null mice did not induce p53 in response to carcinogens and the damaged skin cells would not undergo apoptosis, as they should to prevent cancer formation.  As a result, the NQO1-null mouse skin cells developed cancer.  These effects were thought to be directly due to the lack of binding of NQO1 to p53, which would preven the 20S PC degradation of p53 in the cell.  This means that p53 induction and cell apoptosis is dependent on NQO1-mediated stabilization of p53, preventing the 20S PC degradation of p53.  This is another reason why HQO1 is so important.   However in humans, loss-of-function mutations in the NQO1 gene only account for 3.1% of human skin cancers.

References:

 2005  Lower Induction of p53 and Decreased Apoptosis in NQO1-Null Mice Lead to Increased Sensitivity to Chemical-Induced Skin Carcinogenesis

2003 p53 hot-spot mutants are resistant to ubiquitin-independent degradation by increased binding to NAD(P)H:quinone oxidoreductase 1

1999 Association of NAD(P)H:quinone oxidoreductase (NQO1) null with numbers of basal cell carcinomas: use of a multivariate model to rank the relative importance of this polymorphism and those at other relevant loci

4.  NQO1 regulates blood pressureby eNOS, ACE, and an LKB1/AMPK-mediated preservation in GTPCH-1

Another fascinating study showed that activation of NQO1 ameliorates spontaneous hypertension in a rat model.  As you may know, spontaneous hypertension does not normally occur in rodents.  But in certain strains of inbred rats, bred to develop spontaneous hypertension, high BP does occur and is thought to be mediated by a decline in nitric oxide production by endothelial cells.  In this rat model of spontaneous hypertension, activation of NQO1 by beta-lapachone relieved the hypertension in these rats. The positive effects of beta-lapachone were thought to be mediated by NQO1-induction of endothelial nitric oxide (eNOS).

Another study showed that the effect of NQO1 was to regulate the acetylation of eNOS.  When an eNOS inhibitor was used, the positive effects of beta-lapachone was completely blocked.

In a separate study, beta-lapachone was used to study the effects of the shedding of the enzyme angiotensin converting enzyme (ACE), which converts Angiotensin I to Angiotensin II in the blood stream.  This study showed that beta-lapachone increased NQO1 activity which resulted in reduced cleavage and secretion of ACE into the extracellular space surrounding the cells that synthesized ACE.

In the most recent study, further elucidation of the eNOS mediated mechanism was analyzed and figured out. In this study, they showed that the increase in NAD+ levels in the aortic endothelial cells resulted in an increase in LKBA deacetylation, and AMPK phosphorylation.  This was followed by an increase in GTP-cyclohydrolase-1 preservation and tetrahydrobiopterin/dihydrobiopterin ratio.  This explained the rest of the story on how beta-lapachone reduced blood pressure.

Both beta-lapachone and the polyphenol, epicatechin, have the effect of reducing blood pressure.  Beta-lapachone does this via the direct activation of NQO1, whereas epicatechin does this by activating Nrf2.   Nrf2 is the transcription factor that turns on the NQO1 gene.

Summary:  NQO1 elevated the ratio of NAD/NADH in the endothelial cells and increases eNOS activity via an AMPK-dependent mechanism.  The increase in AMPK phosphorylation resulted in a preservation of the GTP cyclohydrolase-1 (GTPCH-1), which resulted in a lowering of blood pressure. The elevation in the NAD/NADH ratio also results in a reduced cleavage and secretion of ACE into the bloodstream, thereby reducing Angiotensin II formation.  As a result of the eNOS-mediated method and the ACE-reduction mediated molecular mechanism, the hypertension in rats resolved.   As a result of all this research, NQO1 activation has been recently proposed as a strategy for controlling hypertension (see lst reference below).

References:

2011  Activation of NAD(P)H:quinone oxidoreductase ameliorates spontaneous hypertension in an animal model via modulation of eNOS activity

2013 NQO1 Activation Reduces Blood Pressure via Regulation of eNOS Acetylation in Spontaneously Hypertensive Rats

2013 NQO1 Activation Regulates Angiotensin–Converting Enzyme Shedding in Spontaneously Hypertensive Rats

2014 Enhanced activation of NAD(P)H: quinone oxidoreductase 1 attenuates spontaneous hypertension by improvement of endothelial nitric oxide synthase coupling via tumor suppressor kinase liver kinase B1/adenosine 5′-monophosphate-activated protein kinase-mediated guanosine 5′-triphosphate cyclohydrolase 1 preservation

2012 Epicatechin lowers blood pressure, restores endothelial function, and decreases oxidative stress and endothelin-1 and NADPH oxidase activity in DOCA-salt hypertension

2014 NQO1 activation: a novel antihypertensive treatment strategy?

5.  “Loss of function” Polymorphisms in the NQO1 gene are associated with carotid artery atherosclerosis/plaques and stroke risk

This was the most amazing study.  There is a well-known polymorphism in the NQO1 gene called the “C609T variant.”  The C609T polymorphism results in a complete loss of enzymatic activity of NQO1 due to protein instability.  The C609T SNP is very common in Asia and has been well-described in Japanese, Korean, and Chinese ethnic groups.  Individuals with the “C allele” have a lower risk of carotid plaque disease, whereas individuals with the “T allele” have a higher risk of carotid atherosclerotic disease (OR = 1.65).  In Korea, 42% of the population have one “T allele” and 1% of the population have two copies of the “T allele”.  16% of Caucasians have one or two copies of the C609T variant, whereas 49% of Chinese have one or two copies of this SNP.

Another common polymorphism in the NQO1 gene is the C465T mutation.  This SNP results in a reduction in enzyme activity, but not a complete loss of function like the C609T SNP.   The incidence of this SNP is very low in all populations, varying from 0-5% (see reference below).

References:

2009  The C609T variant of NQO1 is associated with carotid artery plaques in patients with type 2 diabetes

2009 An Association between 609 C → T Polymorphism in NAD(P)H: Quinone Oxidoreductase 1 (NQO1) Gene and Blood Glucose Levels in Korean Population

6.   Bromodomain and Extraterminal Proteins (BET) supppress Nrf2-mediated gene expression (including NQO1)

Introducing:  BET protein inhibitors

We mentioned Bromodomain proteins in Item 1 above.  As you may recall, these are “epigenetic readers” that “read” the post-translational modifications of histone proteins.  The BET proteins (Brd2, Brd3, Brd4, and BrdT) bind to acetylated lysine residues on histone and non-histone proteins.  As a result, they either INCREASE or DECREASE the transcription of the genes associated with these acetylated lysine histones.  As it turns out, the Nrf2 genes are regulated by Brd2 and Brd4 proteins.  These complex with the acetylated lysine residues on histones located at the promoters of Nrf2-regulated genes.  As a result, Nrf2 either cannot increase or decrease the expression of these target genes.  When they gave the cells a BET protein inhibitor called JQ1, it increased the expression of Nrf2-genes including HO-1, NQO1, and GCLC, all of which are important in anti-oxidant defense and regulation of intracellular redox state. JQ1 administration resulted in a 10-fold increase in HO-1messenger RNA and a 3-fold increase in HO-1 protein levels.  JQ1 administration resulted in a 3-fold increase in NQO1 mRNA expression and a 3-fold change in NQO1 protein expression.  JQ1 also increased mRNA expression for GCLC by 2-4 fold and GCLC protein expression by 3-4 fold.

Interestingly, JQ1 also inhibited the expression of the ROS-producing protein, Nox.  As a result of this down-regulation of Nox, there was less free radicals in the cell (less H2O2).  This resulted in less oxidative stress in the cell due to both a reduced ROS production and increased anti-oxidant enzymes.

This page lists 14 other BET inhibutors,  And this 2011 paper discusses the discovery and characterization of small-molecule BET inhibitors

Conclusion: Bromodomain “epigenetic readers” can “shut off” the expression of Nrf2 genes and increase the expression of free-radical producing genes (Nox).  Inhibition of BET proteins with JQ1 has the effect of increasing the expression of Nrf2 genes and decreasing the expression of free radical-producing genes (Nox).  This may be a key discovery as one of the major causes of oxidative stress-induced aging may be BET proteins.)  And may also be why eating Broccoli and exercising have failed to lengthen life span.  JQ1, the most well-studied BET inhibitor, suffers from poor pharmacokinetics with a high clearance and low oral biovailabillity in animal studies.  This is why a lot of work is going into developing better BET inhibitors.

References:

2014 Bromodomain and Extra-Terminal (BET) proteins suppress nuclear factor E2-related factor 2 (Nrf2) -mediated antioxidant gene expression

2014  Bromodomain and Extraterminal Proteins Suppress NF-E2–Related Factor 2–Mediated Antioxidant Gene Expression

2014 Bromodomain and Extra-Terminal (BET) proteins suppress nuclear factor E2-related factor 2 (Nrf2) -mediated antioxidant gene expression

2013 Bromodomain and extra-terminal (BET) proteins regulate antioxidant gene expression

2014  Bromodomain and Extraterminal Proteins Suppress NF-E2–Related Factor 2–Mediated Antioxidant Gene Expression

2014 Bumping into BET inhibitors

2014 New benzazepine BET-inhibitors with improved oral bioavailability 

7.  The NQO1 gene is regulated by other factors besides Nrf2 – c-Jun, Nrf1, Jun-B, Jun-D, etc.

Quercetin “turns on” the NQO1 gene via Nrf2.   Dioxin “turns on” the NQO1 gene via both AhR, Arnt, and Nrf2.  Luteolin inhibits expression of NQO1 and drug-metabolizing enzymes via AhR and Nrf2 pathways.

As you may know, the levels of Nrf2 and the location of Nrf2 proteins within the cell is primarily regulated by the binding partner of Nrf2, aka Keap1.  There is a new name for Keap1, called INNrf2, but this new name is having trouble getting any attention in the scientific literature  This Important transcription factor and its binding protein havr been often discussed in this blog.  A comprehensive  series of entries on Nrf2 was published in this blog in 2012: Part1, Part2 and Part3.

An older article from 2000 showed that the NQO1 gene is regulated by several factors other than Nrf2 binding to the ARE segment of the NQO1 promoter.  They showed the transcription factor, c-Jun, can also bind to the ARE promoter sites on Nrf2-dependent genes.  So do the transcription factors Nrf1, Jun-B, and Jun-D.  Polyphenols can “turn on” NQO1 via Nrf2.  Toxins like dioxin can also ‘turn on” Nrf2, but require the assistance of the aryl hydrocarbon receptor, AhR, and the the aryl hydrocarbon receptor nuclear translocator, Arnt.

References:

2000 Regulation of genes encoding NAD(P)H:quinone oxidoreductases

2001 Induction of human NAD(P)H:quinone oxidoreductase (NQO1) gene expression by the flavonol quercetin

1991 Human NAD(P)H:quinone oxidoreductase (NQO1) gene structure and induction by dioxin

2000 NAD(P)H:quinone oxidoreductase 1 (NQO1): chemoprotection, bioactivation, gene regulation and genetic polymorphisms

2015 Constitutive expression of the AHR signaling pathway in a bovine mammary epithelial cell line and modulation by dioxin-like PCB and other AHR ligands

  2014 Luteolin modulates expression of drug-metabolizing enzymes through the AhR and Nrf2 pathways in hepatic cells

8.  The Asian vegetable, “pak choi,” reduces colon inflammation and colon cancer even better than broccoli sulforaphanes

In Asia, there is a very popular type of green, leafy vegetable called “pak choi”.  As a child, I ate this frequently as part of our regular diet in Thailand.  It is not a particularly “tasty” vegetable and reminds me of a cross between spinach and cabbage, but when boiled or steamed, it is a common vegetable eaten with rice.

A recent study showed that pak choi and brassica vegetables both activated cytoprotective genes, but the sets of genes that were activated were different.  Specifically, pak choi, broccoli, brussel sprouts, and other brassica vegetables all activated the typical Nrf2-target genes (NQO1, GSTM1, SRXN1, GPX2), whereas pak choi alone activated the AhR target gene,CYP1A1.  The relevance in the current context is that NQO1 belongs to a group of the aryl hydrocarbon receptor (AhR) battery of drug-metabolizing enzymes that are characteristically induced by both AhR agonists and Nrf2 activators(ref).               r

More importantly, in the studied mouse models of colitis and colon cancer, the glucosinolate-rich pak choi drastically reduced colitis and colon tumor number, whereas the broccoli-diet did not reduce colitis or colon tumor number in mice.

Conclusion:  The presence of glucosinolates (sulphoraphanes, etc.) in food does not necessarily reduce colon inflammation,  and colon cancer.  It appears that certain foods may have more stable or different glucosinolates that are more effective than others at preventing cancer and inflammation.  The Asian vegetable, pak choi,  appears to be more effective than broccoli and other brassica vegetables in down-regulating inflammation and preventing colon cancer.  (This study was done in Germany, by the way, and was not sponsored by the pak choi industry).

Reference:  2014  Glucosinolates from pak choi and broccoli induce enzymes and inhibit inflammation and colon cancer differently

9.  Physical methods and many readily available drugs and phytosubstances increase NQO1 expression or increase NQO1 activity

Including hyperthermia, heat shock, photodynamic herapy, sulindac, dimethylfumarate, taxifolin, sulforaphane,  resveratrol, and cisplatin.

A recent discovery that an old, common, generic NSAID that is still available at the drug store also activates the NQO1 gene.  Sulindac, a long neglected compound used to treat arthritis, activates the NQO1 gene.  Also, previous work has shown that several other compounds up-regulate the NQO1 gene or increase the activity of NQO1.   This includes cisplatin, resveratrol, dimethyl fumarate, taxifolin, sulforaphane, and the glucosinolates in pak choi.  Since the cancer-killing effects of beta-lapachone are dependent on the levels of NQO1, all of the above compounds work synergistically to kill cancer with beta-lapachone.

Several physical methods have been shown to increase NQO1 gene or protein activity.  This includes hyperthermia, heat shock, and photodynamic therapy.  This may be how photodynamic therapy works in cancer cells.  Interestingly, beta-lapachone works synergistically with these physical methods as well.

References:

2014 Sulindac Compounds Facilitate the Cytotoxicity of β-Lapachone by Up-Regulation of NAD(P)H Quinone Oxidoreductase in Human Lung Cancer Cells

2015 NQO1 protein expression predicts poor prognosis of non-small cell lung cancers

2014 The Chemotherapeutic Effects of Lapacho Tree Extract: β-Lapachone

2013 Preventive Effects of NSAIDs, NO-NSAIDs, and NSAIDs Plus Difluoromethylornithine in a Chemically Induced Urinary Bladder Cancer Model

  2015 Effect of glycosylation patterns of Chinese eggplant anthocyanins and other derivatives on antioxidant effectiveness in human colon cell lines

10.  Beta-lapachone, a compound found in the bark of the South American Lapacho tree, is a potent activator of the NQO1 protein and produces ROS in cancer cells, but reduces ROS in non-cancer cells.  It also inhibits pathological retinal neovascularization, but does not inhibit physiological neovascularization. 

The most exciting thing about NQO1 is that there is a natural, cheap, compound found in the tree bark of a South American tree.  The compound is called beta-Lapachone and is a NQO1 activator.  Specifically, NQO1 is a “two-electron transfer” enzyme that can extinguish free radicals in normal cells, but produces free radicals in cancer cells.  It has been shown to be a very effective compound for treating lung cancer.  Here is how it works:

  • Beta-lapachone undergoes a redox cycle by NQO1, which reduces beta-lapachone to an unstable semiquinone.  The semiquinone then rapidly undergoes a two-step oxidation back to the parent stable compound, beta-lapachone.  This produces what is called a “perpetuating futile redox cycle”.  This results in an unbalance of intracellular reactive oxygen species in cancer cells, resulting in the cell death of the cancer cells.  This “perpetual futile redox cycle” is totally dependent on the concentration of NQO1 within cells. Here is a diagram of the reaction:

Image may be NSFW.
Clik here to view.
PT4-a

Illustration reference:   2014 The Chemotherapeutic Effects of Lapacho Tree Extract: β-Lapachone

The downstream effects of perpetual futile redox cycling include 4 apoptotic pathways and one necroptotic pathway:

  1. Mitochondrial-induced apoptosis – The induction of ROS in mitochondria opens the MPTP pores and results in PARP activation and caspace activation.  This induces apoptosis.  
  2. ER-induced apoptosis - The induction of ER stress induces sarcoplasmic release of calcium which induces high levels of cytoplasmic Ca++.  This also induces apoptosis via the ER.
  3. DNA-damage mediated apoptosis – beta-lapachone also induces Topoisomerase I and II.  The activation of topoisomerases  induces DNA breaks, which induces PARPs.  This PARP hyper-activation induces apoptosis independently from mitochondrial ROS or ER stress.
  4. Cell cycle arrest-induced apoptosis - The futile redox cycling of beta-lapachone also induces cycle cycle arrest via the activation of p21, p27, and the phosphorylation of JNK, PI3K, and Akt.  This induces cancer cell apoptosis as well.
  5. Calpain-induced cell necrosis – Unlike the 4 pathways above, futile redox cycling also induces calcium influx into the cells independently of ER stress.  This calcium influx into the cell activates Calpain, which induces cell death by the necrosis pathway, not the apoptosis pathway.

Conclusion:  beta-lapachone induces cancer cell death by five different pathways, all dependent on perpetual futile redox cycling which is dependent on NQO1 expression.   Here is a diagram that illustrates these 5 pathways:

Image may be NSFW.
Clik here to view.
PT4-b

Illustration reference:   2014 The Chemotherapeutic Effects of Lapacho Tree Extract: β-Lapachone

Interestingly, Sulindac, the old generic FDA-approved non-steroidal anti-inflammatory drug, augments the cytotoxicity of beta-lapachone in lung cancer cells.  This appears to be due to its effect of up regulating expression of the NQO1 gene.  Cancer cells with higher levels of NQO1 actually are more sensitive to beta-lapachone than cancer cells with lower expressions

of NQO1.  This may be an “Achilles heel” discovery for cancer cells, allowing us to exploit one of the vulnerable points of cancer cells that have unregulated their anti-oxidant capacity (Many cancers have unregulated Nrf2).

Beta-lapachone shows a lot of promise in treating the most common cause of blindness – neovasculariation of the retina. In the retina, beta-lapachone inhibited pathological retinal neovascularization induced by HIF-1alpha.    Unlike VEGF inhibitors that are currently being used for inhibiting retinal neovascularization, beta-Lapachone does not inhibit physiologic angiogenesis…..only pathologic angiogenesis.

References:

2014 Mechanistic studies of cancer cell mitochondria- and NQO1-mediated redox activation of beta-lapachone, a potentially novel anticancer agent

2014 Beta-lapachone inhibits pathological retinal neovascularization in oxygen-induced retinopathy via regulation of HIF-1α

2014 Sulindac Compounds Facilitate the Cytotoxicity of β-Lapachone by Up-Regulation of NAD(P)H Quinone Oxidoreductase in Human Lung Cancer Cells

2014 The Chemotherapeutic Effects of Lapacho Tree Extract: β-Lapachone

II.  The Warburg effects; its causes and consequences and roles in aging in the NAD World

Image may be NSFW.
Clik here to view.
WAARBURG

Image source video

The Warburg effect is an important phenomenon characteristic of aging.  It is best known for its existence in cancer cells as well as in aging, and for having several negative biological consequences, though there can be a positive side to it too. The essence of the Warburg effect is a metabolic transformation from energy production  from oxidative phosphorylationin the mitochondria to glycolosis.  The effect was originally seen in cancer cells. ” Warburg’s hypothesis was postulated by the Nobel laureate Otto Heinrich Warburg in 1924.[3] He hypothesized that cancer, malignant growth, and tumor growth are caused by the fact that tumor cells mainly generate energy (as e.g. adenosine triphosphate / ATP) by non-oxidative breakdown of glucose (a process called glycolysis). This is in contrast to “healthy” cells which mainly generate energy from oxidative breakdown of pyruvate. Pyruvate is an end-product of glycolysis, and is oxidized within the mitochondria. Hence, according to Warburg, the driver of cancer cells should be interpreted as stemming from a lowering of mitochondrial respiration. Warburg reported a fundamental difference between normal and cancerous cells to be the ratio of glycolysis to respiration; this observation is also known as the Warburg effect(ref).”  Although much of the research literature related to the Warburg effect is cancer-related, in recent years it is being seen to be very important in aging as well.  Specifically, I think there is strong evidence that Warburg metabolism reduces the NAD/NADH ratio in the nucleus, the cytoplasm, and the mitochondria.  And, the Warburg effect may be the main reason why that decline is observed in aging.

The Warburg effect and cancers

I don’t think I understood Warburg metabolism until I read the following articles.

2009 Understanding the Warburg Effect: The Metabolic Requirements of Cell Proliferation

Wikipedia: Warburg hypothesis

2006  Cancer’s Molecular Sweet Tooth and the Warburg Effect

2008 Cellular life span and the Warburg effect

2004 Glycolytic Enzymes Can Modulate Cellular Life Span

2009 Nutrient transporters in cancer: Relevance to Warburg hypothesis and beyond

2006 Cancer’s Molecular Sweet Tooth and the Warburg Effect

2007 Protection from oxidative stress by enhanced glycolysis; a possible mechanism of cellular immortalization

2007A High Glycolytic Flux Supports the Proliferative Potential of Murine Embryonic Stem Cells

2009 Understanding the Warburg Effect: The Metabolic Requirements of Cell Proliferation

2013 Oncogene-induced cellular senescence elicits an anti-Warburg effect

Conclusions:

1. Precancerous cells shift to Warburg type metabolism to achieve immortality. The cost of this shift is a decrease In the NAD+/NADH ratio, which inhibits DNA repair by DNA repair enzymes that are dependent on NAD (PARP, SIRT1, SIRT6) and epigenetic histone modifiers that are dependent on NAD (ARTDs, SIRTs).   Also, the previously discussed costs in mitochondrial metabolism which leads to further the Warburg effect.

The poor (slow) DNA repair -allows for DNA mutations to occur at much more rapid rates than what is seen with normal evolution (I.e. Stochastic mutation rates), allowing tumor suppressor genes to be mutated and oncogenes to loose their regulation. The epigenetic dysfunction induced by the change in NAD+/NADH ratios also allow for gene activation or gene silencing to occur by Bromidomain (BET) proteins, histones, DNA methylation, miRNA, and lncRNA over expression. Thus, both DNA mutations and Epigenetic changes occur as a result of the Change in DNA repair that occur with precancerous stages of Cancer.

2. Warburg type metabolism makes precancerous and Cancer cells resistant to oxidative stress because  they upregulate gene expression of antioxidant enzymes via Nrf2, Nrf1, c-Jun, FoxO3a, Jun-B, Jun-C, etc. They accomplish this by activating Nrf2 with endogenously produced ROS, which is a potent activator of Nrf2 nuclear localization, as well as Nrf1, FoxO3a, c-Jun, Jun-B, and Jun-C.

3. Warburg type metabolic shifts activate the  telomerase gene and  cell cycle genes needed for cellular proliferation and survival. This has been well documented in stem cell research. Lowering Oxygen levels in cell culture activates telomerase and cell cycle genes very potently, without the need for TA-65 or any other supplement.

4. An unbiased screen of gene expression in Warburg metabolism cells showed that the “driver” of the Warburg metabolism phenotype is the expression of phosphoglycerate mutase (PGM) and phosphoglycerate isomerase (PGI). SiRNA knockdown of these glycolytic genes induced Cancer cell cycle arrest and cell senescence. Because p53 down-regulates PGM, Cancer cells that survive are the ones that either epigenetically “turn off” p53 or p53 is mutated due to poor DNA repair (see #1 above)

Reference:  2005 Glycolytic Enzymes Can Modulate Cellular Life Span 

5.  Eating sugar is NOT the cause of Cancer. This is a common fallacy in layperson circles, such as Mercolas Website, etc. Sugar may help spur cancer growth, but the primary contribution of sugar to Cancer cells is that sugar enables mTOR signaling,

6. The last and most important reason that Cancer cells “actively induce the shutting off of mitochondrial function” is that mitochondria are the subcellular organs that induce apoptosis (I.e. Cellular suicide). When mitochondria are “shut off”, you effectively shut off all of the intrinsic suicide pathways in one “fell swoop”!  The Caspace and Caspace-independent pathways are all inactivated! Cancer cells call this “A genius maneuver”. We humans call this “Cancer chemotherapy and Radiation resistance” (Cancer cells have a different point of view than we humans do!).  Thus the ultimate weapon of the Warburg effect is to inactivate apoptosis!

7. We can possibly counteract the Warburg effect and decline of the NAD/NADH ratio. We can start out to do this by activating NQO1. It will take more than one serving of Broccoli, however.  We must address the epigenetic reader problem (Bromidomain proteins 2 and 4 that prevent Nrf2 activation of NQO1 gene expression). See the above discussion in Section I on Brd2 and Brd4. Here are some ideas: In addition to

  • upregulating the NQO1 gene by inhibiting Brd2 and Brd4 Bromidomain proteins with BET inhibitors,
  • activating perpetual redox cycling with beta-lapachone, and
  • inducing Nrf2 with exercise, broccoli, and Pak choi;

there may be some value to trying metabolic inhibitors of Warburg-type metabolism to restore the NAD/NADH ratio to normal. The best established metabolic inhibitors are DCA, 3-BrOP, and 2-DG. These all restore mitochondrial respiration and mitochondrial-mediated apoptosis, thereby stopping cancer cell proliferation and inducing cancer cell apoptosis.  There might be equally effective phytosubstance inhibitors.  See Section IIIB below, Countering the Warburg Effect with Phytosubstances.

Aging and the Warburg effect

While the Warburg effect has primarily been studied in the context of cancers, it can arise powerfullyin the context of aging.  We note first that the effect is not necessarily all-or-none (mitochondrial vs, glycolic metabolism).  It can arise gradually over time in the process of aging.  Indeed David Sinclair et al’s paper Declining NAD+ Induces a Pseudohypoxic State Disrupting Nuclear-Mitochondrial Communication during Aging identifies a mechanism by which age-related decline of NAD+ leads to mitochondrial dysfunction which leads to the Warburg effect.

In a cell affliced by the Warburg effect, the cell converts most of the NAD+ into NADH with aerobic glycolysis.  Two molecules of NAD+ are consumed for every  glucose molecule that is oxidized in aerobic glycolysis.  Thus you loose two moles of NAD+ for every mole of glucose you consume via the Warburg effect! 

The Warburg effect is the use of the glycolytic pathway in the presence of oxygen, whereas anaerobic glycolysis is the glycolytic pathway in the absence of oxygen. Either way, all of the NAD gets converted into NADH with the Warburg effect. Here is a diagram of how/why the Warburg effect lowers NAD+ levels in the cell:


Image may be NSFW.
Clik here to view.
GLpath1

Image may be NSFW.
Clik here to view.
GLpath2

Diagram reference:  Glycolysis, Krebs Cycle, and other Energy-Releasing Pathways

Normally, the NADH produced is converted into ATP in the mitochondria.  However, when mitochondria do not work properly in aging and with age-related diseases, more and more NADH accumulates within the cell.  Some of the NADH is converted to NAD+ when the pyruvate is converted into lactate and then exported to the liver (i.e. the Cori cycle), but the Cori cycle does not keep NAD+ levels high.

Conclusion:  Warburg metabolism associated with aging results in low levels of NAD+ within the cell…….this is the culprit!  It is also the cause of itself in an unvirtuous cycle

Note that there is a positive feedback loop at work here lowering NAD+:  1.  An insufficient level of nulear NAD+ leads to expression of HIF-1alpha. 2.  This leads to a pseudohypoxic state that disrupts nuclear-mitochondrial communication leading to  deficiency in mitochondrially-encoded proteings resulting into dysfunctional mitochondria. 3.  This leads to metabolic reprogramming of the cell to support glycolosis and a Warburg-type metabolism, 4.  The Warburg metabolism converts NAD+ into NADH as illustrated in the diagram above.  Thus, this cycle of events reinforces itself.

Long non-coding RNAs can induce Warburg-type metabolism

Other actors can promote the Warburg effect.  I have now found 3 lncRNAs that induce Warburg-type metabolism as follows:

1. UCA1 (uroepithelial cancer-associated 1) – this is a lncRNA that was discovered in bladder Cancer cells, but appears to be Ubiquitously expressed in other types of cancers and oncancerous cells as well. It upregulates the TOR/STAT3/microRNA-143 pathway, which upregulates the First enzyme in glycolysis, hexokinase 2 (HK2).

Reference:  2014 Long non-coding RNA UCA1 promotes glycolysis by upregulating hexokinase 2 through the mTOR–STAT3/microRNA143 pathway

2. LncRNA p21 – this lncRNA also   Induces Warburg-type metabolism by a completely different molecular mechanism. LncRNA p21 interferes with the binding of VHL to HIF-1a.   As a result, HIF-1a is not degraded and HIF-1a turns on many glycolytic enzymes, even though there is plenty of oxygen present.

Long noncoding RNA may be the missing “dark matter” that explains the unaccounted for risk of developing cancer, disease, and even aging itself.  There appears to be almost 60,000 of these “genes” hidden in the noncoding portion of the human genome, which accounts for 98% of our DNA.  LncRNA-p21 is one of the few that has been characterized and may be the “unexplained dark matter” of the Warburg effect in cancer and in aging.

Until recently, long noncoding RNA were not recognized as being major regulators of gene expression.  With the recent advent of next generation RNA sequencing (RNA-seq), almost 60,000 long noncoding “genes” have been found in the human genome. As of yet, only a handful of these have been characterized for their functional significance, such as HOTAIR, MALAT1, H19, KCNQOT1, ANRIL, etc.

One of these is “Long noncoding RNA at the p21 locus”, or lncRNA-p21, which is an independent gene downstream from the protein-coding gene, CDKN1A, or p21. When the CDKN1A gene is transcribed, the lncRNA-p21 is also transcribed.  Thus although this gene is a separate gene, it is co-expressed with its protein-coding gene.

The lncRNA-p21 does not appear to regulate the CDKN1a gene, however.  Instead, it appears to be a lncRNA with wide-ranging effects, regulating distant genes via “trans-regulatory” mechanisms.  LncRNA-p21 is a hypoxia-inducible gene.  More-over, HIF-1a is responsible for the hypoxia-inducible expression of lncRNA-p21.

In addition, lncRNA-p21 then stabilizes HIF-1a by disrupting the binding of HIF-1a to VHL.  The net effect is a “positive feedback cycle“, where HIF-1a induces lncRNA-p21, which then prevents the degradation of HIF-1a by VHL.  This “positive feedback cycle” may be the greatest factor that determines cancer formation.

Image may be NSFW.
Clik here to view.
Hypoxiapq1

Image source

References:

2014  Reciprocal Regulation of HIF-1α and LincRNA-p21 Modulates the Warburg Effect (agstract)

2013 Differential Expression of Long Noncoding RNAs in the Livers of Female B6C3F1 Mice Exposed to the Carcinogen Furan

3. CRNDE – this lncRNA name is an Acronym for “Colorectal neoplasia differentially expressed” lncRNA.  As expected, it was discovered in colon cancer cells, but like UCA1 and lncRNA p21, appears to be universally expressed in many cancers and noncancerous tissues.  There are many splice variants of the CRNDE lncRNA, but the key splice variants include a specific sequence in intron 4 called the “gVC-ln4″ sequence. gVC-ln4 copies of CRNDE induce Warburg type metabolism. Interestingly, CRNDE is regulated by insulin signaling. Thus, CRNDE may be the molecular mediator of why the Insulin/IGF-1 pathway causes aging (as opposed to sugar being the cause of aging).

Reference: 2014 CRNDE, a long non-coding RNA responsive to insulin/IGF signaling, regulates genes involved in central metabolism 

Conclusions: At least 3 lncRNAs have now been discovered that explain why both aging and Cancer exhibit Warburg-type metabolism. There may well be more such, given that the “Wild West” of long non-coding RNAs is only now being explored. The evolutionary selection pressure for the development of UCA1, lncRNA p21, and CRNDE all are probably for cellular survival or organismal survival. These lncRNAs are one of the farthest “upstream “causes” of aging and cancer that I have seen.

About HOTAIR

Can we identify interventions which can affect the expression of such IncRNAs?  I think the answer is Yes.  At least this is the case for one non-coding RNA for which expression can be altered by curcumin.  This lncRNA is called “HOTAIR and is a critical regulator of cancer metastasis and cancer survival. HOTAIR is over-expressed by 100-fold in breast cancer cells and the level of its over-expression correlates with both metastasis and survival in breast cancer.  Although work in this area has just begun, one report already shows that the metastasis-preventing effects of curcumin in renal cell carcinoma (RCC) may be mediated via HOTAIR.  No other lncRNA has been linked to polyphenol mechanism of action to date, however.  Because knowledge of what IncRNAs do is unfolding so rapidly now, we will not be surprised to hear soon of other examples.

Reference:   Influence of Curcumin on HOTAIR-Mediated Migration of Human Renal Cell Carcinoma Cells

III Metabolic reprogramming from the Warburg Effect

A.  Cells can be weaned off from Warburg metabolism back to mitochondrial respiration via DCA  and TMZ.  (and off Glutaminolysis with Arsenic Trioxide)

I am fascinated with the idea of using safe, nontoxic compounds for reprogramming our cells to be “weaned off” of aerobic glycolysis and to switch them back to glucose oxidation.  I am now convinced this can be done with plant polyphenols, assuming they are effectively delivered tp cells.  First, I focus focus on two drugs that are well known to do this,  DCA and TMZ.  Then I discuss the potential use of plant polyphenols in Subsection B to follow.

DCA and TMZ have been shown to have amazing effects on the heart, especially for heart failure with preserved ejection fraction (HFPEF).  However, in addition to treating HFPEF, these compounds appear to have great potential for treating or preventing cancer. Here is what I have learned so far about them.

1. Systemic Factors that “drive” the development of the heart’s dependence on free fatty acids (paradoxic effect….opposite of a ketogenic diet)

Cardiac-intrinsic causes of HFPEF

With diabetes, there is a 2-fold higher risk of heart failure in men and a 5 fold higher risk of heart failure in women.  This cannot be explained by advanced glycation end products, coronary artery disease (and MI), and hypertension alone.  There are also “cardiac intrinsic mechanisms” that are at work which are responsible for this dramatic increase in HF in diabetics.  In addition, non-diabetics develop a type of heart failure where there is no pre-existing heart attack and even in some cases, no hypertension.  This is called “normal ejection fraction heart failure”, or HFPEF.

An article on this is: 2003 Heart Failure – The frequent, forgotten, and often fatal complication of diabetes

Metabolic Reprogrammiong in the Heart – “mhs isoform switching”

With HFPEF in diabetes and with aging, there appears to be a metabolic energy substrate switching in the heart from the use of glucose as fuel to the use of free fatty acids as fuel.  This gene expression change is referred to as “mhc isoform switching”.  Here there is an increase in myosin V3 gene expression and the sarcoplasmic reticulum Ca++ pump ATPase genes.  This results in cardiac hypertrophy and metabolic reprogramming.  In addition the decreased glucose availability in the heart that occurs with insulin resistance and a high fat diet in diabetes drives this process.  As a result, gfat2 is expressed instead of gfat1.  Another systemic factor besides glucose and high free fatty acids is the stress hormones produced from the HPA axis and the sympathetic nervous system (SNS).  Specifically,  the epinephrine  (from the adrenal gland) and norepinephrine (from the sympathetic nervous system) that is produced when we are psychologically stressed, and with normal everyday waking hours (i.e. HPA axis hormones  and SNS stimulation).  In addition to triggering genes that switch fuel use (metabolic reprogramming), the SNS and HPA axis triggers gene expression of “fetal gene programs”.    Interestingly, dietary medium chain triglycerides (MCT oil) can prevent this occurrence.

Here are some articles on this:

2007 Proposed Regulation of Gene Expression by Glucose in Rodent Heart

1986 Diabetes mellitus and hypothyroidism induce changes in myosin isoenzyme distribution in the rat heart–do alterations in fuel flux mediate these changes?

1994 Modification of myosin isozymes and SR Ca(2+)-pump ATPase of the diabetic rat heart by lipid-lowering interventions

1995 Dietary medium-chain triglycerides can prevent changes in myosin and SR due to CPT-1 inhibition by etomoxir

1982 Cardiac alpha- and beta-adrenergic receptor alterations in diabetic cardiomyopathy

2.  Systemic Factors that “drive” cardiac fibrosis, cardiac remodeling, and age-related heart failure with preserved ejection fraction (HFPEF)

With diabetes and with aging, there is a second factor that is responsible for the cardiac remodeling that occurs with HFPEF.   This is the renin-angiotensin system (RAS), which triggers the expression of extracellular matrix genes (collagen genes and MMP genes), which cause the stiffness of the heart with this disease.  Fortunately, there is evidence that this cardiac remodeling is reversible.  Ironically, the extract from broccoli, brussel sprouts, cabbage, and cauliflower,  Indole-3-carbinol, can trigger this cardiac remodeling!   In the study below, withdrawal of I3C reversed the effects of the cardiac remodeling caused by the RAS system.  This is very puzzling.

Here are some articles on this:

htt2013 Cardiac remodeling during and after renin–angiotensin system stimulation in Cyp1a1-Ren2 transgenic rats

2007 The Renin-Angiotensin Aldosterone System: Pathophysiological Role and Pharmacologic Inhibition2012 Reversible cardiac remodeling after renin-angiotensin system stimulation in CYP1A1-Ren2 transgenic rats

3.  Once cardiac remodeling induces heart failure,   ACE inhibitors, beta-blockers, and Angiotensin II receptor blockers do not reverse the heart failure.

Here are some articles on this:

2003 Effects of candesartan in patients with chronic heart failure and preserved left-ventricular ejection fraction: the CHARM-Preserved Trial

2008 Advances in the treatment of heart failure with a preserved ejection fraction

2014 Association Between Use of β-Blockers and Outcomes in Patients With Heart Failure and Preserved Ejection Fraction

2014 Searching for Treatments of Heart Failure With Preserved Ejection Fraction – Matching the Data to the Question

2011 Treatment of Heart Failure With Preserved Ejection Fraction: Have We Been Pursuing the Wrong Paradigm?

4.  Even after heart failure has occurred with HFPEF, Cardiac Metabolic Reprogramming with DCA or TMZ can dramatically improve cardiac index and improve mechanical efficiency of the heart

Dichloroactetic acid, a simple, cheap compound that is well absorbed orally, induces a “metabolic switching” of cardiomyocytes from the utilization of fatty acids to the utilization of glucose.  This glucose utilization is NOT aerobic glycolysis (i.e. the Warburg effect), but instead is true “glucose oxidation” in the mitochondria. This increases the amount of ATP that can be generated and reduces the workload of the heart to generate ATP.   The dose is relatively high (50 mg/kg body weight in humans). This means for an average person, they would need to take 3-4 grams of DCA.

Here are some articles on sodium dichloroacetate. References:

1994 Improved hemodynamic function and mechanical efficiency in congestive heart failure with sodium dichloroacetate

2010 Sodium dichloroacetate selectively targets cells with defects in the mitochondrial ETC

There is a second compound that is a drug widely available in Europe (and Canada) but not in the US.  In fact, it is widely available in over 80 countries.  This drug is called “trimetazidine”, or TMZ, an is another “metabolic reprogrammer” for the heart.  It also makes the heart switch from utilizing free fatty acids to utilizing glucose.  DCA and TMZ do not carry out “metabolic reprograming” the same way, however.  TMZ does this by inhibiting long chain 3-ketoacyl coenzyme A thiolase, whereas DCA targets Pyruvate dehydrogenase kinase (PDK) by acting as a “pyruvate mimetic”.  PDK is an inhibitor of Pyruvate dehydrogenase (PDH). By inhibiting PDK, PDH is maintained in its active catalytic form and mitochondrial pyruvate consumption is increased.  Whereas DCA has to be taken in large doses,  TMZ is only a 20 mg three times per day dosage and has been used in Europe for over 40 years.  It does have one significant rare side effect of causing drug-induced Parkinsonism.

Reference: 2006 Clinical Trial of Trimetazidine , a Partial Free Fatty Acid Oxidation Inhibitor, in Patients With Heart Failure

5.  Metabolic reprogramming can also have wonderful anticancer effects by inhibitingWarburg metabolism, inducing differential apoptosis in cancer cells vs normal cells (preserved)

Warburg metabolism is seen in about 90% of cancers.  The remaining ones either utilize the glutaminlytic pathway to generate ATP, or still use free fatty acids or glucose oxidation.   However, it is thought that more than 99% of cancer cells either use Warburg type metabolism or Glutaminolytic metabolism.  There is strong evidence that DCA alone or DCA in combination with genotoxic drugs can make a huge difference in cancer  cells that are dependent on aerobic glycolysis.  Because cancer cells have been “hardwired” to undergo aerobic glycolysis (Warburg metabolism), it is very difficult to get them to  change their metabolism.  There are several reasons for this metabolic “hardwiring” in cancer cells.  The obvious one is that cancer  cells have lots of mitochondrial mutations so they cannot generate the components of electron transport/oxidative phosphorylation that are expressed only in mitochondrial encoded genes (mtDNA).  A second reason is that cancer cells have unregulated or stabilized HIF-1a, which encodes for all of the glycolytic enymes.  This up regulation of HIF-1a is due to the Insulin/IGF/PI3K/Akt/mTOR pathway being unregulated, the C-myc pathway being unregulated, and the ROS oncogenic pathway being unregulated.  The third reason is the loss of p53 gene expression, either due to mutations or due to epigenetic silencing in the p53 gene promoter by CpG methylation and histone-based silencing.

In summary, there are so many overlapping reasons why cancer cells display “Warburg Metabolism” that this form of metabolism appears to be “hardwired” and not changeable by dietary factors, oxygen, fasting, drugs, exercise, or stress reduction.  In other words, when it comes to cancer cell metabolism, if they have Warburg-like metabolism, they are stuck with it.  And the good news is that this is not necessarily so for normal cells.

DCA has been shown to act as a “pyruvate mimicker” and targets pyruvate dehydrogenase kinase (PDK).  PDK normally inhibits PDH.  When DCA inhibits PDK, PDH continues to consume mitochondrial pyruvate, which then metabolically reprograms” the mitochondria to utilize glucose for generating ATP, rather than utilizing free fatty acids for generating ATP (i.e. beta fatty acid oxidation).  This results in a reduction in serum lactate.  This is why DCA is used to treat congenital lactic acidosis.   Interestingly, DCA induces apoptosis in cancer cells but does not induce apoptosis in normal cells.

There are now numerous reports from cancer laboratories that show amazing benefits of DCA in experimental models.  There is also anecdotal evidence from patients who have self-medicated themselves with DCA and had long term survival associated with with daily use of DCA.  The main side effect of DCA is peripheral neuropathy.  This side effect can be prevented by keeping the dose below 10 mg/kg/day and by taking oral Thiamine, NAC, and CLA.

References:

2008 Dichloroacetate (DCA) as a potential metabolic-targeting therapy for cancer

Sodium dichloroacetate selectively targets cells with defects in the mitochondrial ETC

2012 Novel molecular mechanisms of antitumor action of dichloroacetate against T cell lymphoma: Implication of altered glucose metabolism, pH homeostasis and cell survival regulation

2011 Dichloroacetate induces apoptosis of epithelial ovarian cancer cells through a mechanism involving modulation of oxidative stress

DCA Site: Cancer papers by Archer and Michelakis

Dichloroacetate (DCA) Sensitizes BothWild-Type and Over Expressing Bcl-2Prostate Cancer Cells InVitroto Radiation

2008 Pyruvate kinase M2 is a phosphotyrosinebinding protein

2008 The M2 splice isoform of pyruvate kinase is important for cancer metabolism and tumour growth

2011 In vitro effects of an in silico-modelled 17β-estradiol derivative in combination with dichloroacetic acid on MCF-7 and MCF-12A cells

2011 Targeting metabolism with arsenic trioxide and dichloroacetate in breast cancer cells

6.  Glutaminolysis – the “black sheep” metabolic pathway of cancer cells that is often forgotten.

Anther key metabolic dysfunction in cancer cells is the utilization of glutamate as an alternative energy source.  Although this does not occur in all cancer cells, it occurs in chemotherapy-resistant tumors.  For instance, promyeloid leukemia and certain subsets of pancreatic cancer utilize the glutaminolytic pathway to generate ATP.   There is a very old “metabolic inhibitor” of the cancer cell’s glutaminolytic pathway of generating ATP – Arsenic Trioxide (ATO).  ATO is very cheap but hard to get.  Alone, it has amazing but toxic effects on certain cancers.  When used in combination with DCA, it has a synergistic effect, inhibiting cancer even more than DCA or ATO can do alone.

References:

2011 Targeting metabolism with arsenic trioxide and dichloroacetate in breast cancer cells

2002 Molecular targets of arsenic trioxide in malignant cells

2002 Mechanisms of action of arsenic trioxide

2011 Combination of Poly I:C and arsenic trioxide triggers apoptosis synergistically via activation of TLR3 and mitochondrial pathways in hepatocellular carcinoma cells

2010 Genistein synergizes with arsenic trioxide to suppress human hepatocellular carcinoma

2009 A novel combination therapy with arsenic trioxide and parthenolide against pancreatic cancer cell

Conclusions:   Forced metabolic reprogramming may be a novel strategy for cancer cell apoptosis and for age-related heart failure with preserved ejection fraction. Although little has been done in this arena, I believe that this would be a huge opportunity to explore new ways of attacking aging phenotypes in many organs – heart, skeletal muscle, liver, etc.  Unfortunately, little has been done in this area in the anti-aging research field.

B  Countering the Warburg Effect with Phytosubstances

Here are some natural compounds I have found that may inhibit aerobic glycolysis:

  1. Green tea (EGCG) inhibits glycolysis – Inhibits the 6th step of glycolysis at the enzyme Glyceraldehyde-3-phosphate dehydrogenase (GAPDH). EGCG from green tea undergoes “auto-oxidation”, forming “electrophilic quinones” inside cells.  This EGCG-quinone fits into the active enzyme pocket of the 6th enzyme in glycolysis, called Glyceraldehyde-3-phosphate dehydrogenase (GAPDH).  In the enzyme pocket of GAPDH, the EGCG-quinone then forms a covalent bond with a cysteine thiol amino acid on GAPDH.  Mutatgenesis studies that substituted this cysteine with another amino acid eliminated the inhibitory effect of EGCG on GAPDH enzyme activity.

The inhibition of GAPDH by the EGCG-quinone is irreversible, which means that the cell has to synthesize more GAPDH to continue with aerobic glycolysis activity (i.e. Warburg-type metabolism).

Reference:  2008 Covalent modification of proteins by green tea polyphenol (-)-epigallocatechin-3-gallate through autoxidation

Conclusion:  Oxidized EGCG, referrred to as “EGCG-quinone”, forms a covalent bond with a cysteine amino acid side chain in the active enzyme pocket of GAPDH, an important enzyme in the glycolytic pathway.  Because this covalent bond formation results in irreversible inhibition of the GAPDH enzyme, this is one molecular mechanism by which green tea can reduce or reverse Warburg-type metabolsim.

  1. Green tea (EGCG) inhibits the conversion of pyruvate to lactate – the conversion of pyruvate to lactate by LDH and the export of lactate to the plasma for hepatic conversion to glucose are key metabolic alterations that allows cells to survive Warburg-type metabolism.  EGCG from green tea undergoes “auto-oxidation” and then inhibits another key enzyme in Aerobic glycolysis – LDHA. Lactate dehydrogenase (LDH) has two isoforms, LDHA and LDHB.   LDHA is not under the transcriptional control of HIF-1a.  LDHA can be inhibited by oxamate, a specific inhibitor of this isoenzyme.  As a result, less lactate is produced and the Warburg-type metabolism is disrupted in cancer cells.  As a consequence, pyruvate accumulates in the cancer cells and can induce cancer cell death or inhibit cancer cell growth. In the study quoted below, EGCG was found to have the same inhibitory effect on LDHA that oxamate produces.

Reference:  2014 Metabolic consequences of LDHA inhibition by epigallocatechin gallate and oxamate in MIA PaCa-2 pancreatic cancer cells

Conclusion:  The inhibition of LDHA is a second molecular mechanism by which oxidized EGCG can inhibit Warburg-type metabolism.

  1. Green tea (EGCG) inhibits HIF-1a, which would decrease Warburg-type metabolism- Although there are a few studies (two of them) which suggest that catechins from green tea increase HIF-1a stability, most studies have come to the opposite conclusions.  Below are some of them:
  • EGCG has been shown to inhibit hepatocellular carcinoma by inhibiting VEGF/VEGFR axis (see below).
  • EGCG has been shown to inhibit colorectal cancer by inhibiting the VEGF/VEGFR axis (see below)
  • ECGC has been shown to inhibit HIF-1a and VEGF in human cervical cancer cells and in human hepatoma cells.
  • EGCG from green tea was studied to see what effects the EGCG polyphenol would have on HPV-infected cells.  Cells infected with HPV produce oncoproteins E6 and E7, which induce Warburg-type metabolism and cancer formation.  This is one of the molecular mechanisms by which HPV infection can cause cancer – by activating Warburg-type metabolism and angiogenesis.
  • They found that EGCG inhibited angiogenesis in these HPV cells, both in vitro and in vivo, and also inhibited HIF-1a protein expression in HPV cells.
  • EGCG also reduced the secretion of VEGF and IL-8 from these HPV-infected cells.  In this same study, however, EGCG had no effect on inhibiting HIF-1a expression.

Several similar studies are listed below. References:

2006 Green tea extract and (-)-epigallocatechin-3-gallate inhibit hypoxia- and serum-induced HIF-1alpha protein accumulation and VEGF expression in human cervical carcinoma and hepatoma cells.

2013 (-)-Epigallocatechin-3-gallate inhibits human papillomavirus (HPV)-16 oncoprotein-induced angiogenesis in non-small cell lung cancer cells by targeting HIF-1α.

2009 (-)-Epigallocatechin gallat`e suppresses the growth of human hepatocellular carcinoma cells by inhibiting activation of the vascular endothelial growth factor-vascular endothelial growth factor receptor axis

2010 (-)-Epigallocatechin gallate inhibits growth and activation of the VEGF/VEGFR axis in human colorectal cancer cells

2009 (-)-Epigallocatechin gallate suppresses the growth of human hepatocellular carcinoma cells by inhibiting activation of the vascular endothelial growth factor-vascular endothelial growth factor receptor axis

Conclusions: EGCG inhibits HIF-1a, VEGF, and IL-8 production.  And oh yes, in addition to all of the above, lets not lose sight of the fact that EGCC promotes the expression of Nrf2 which is going to activate the NQ01 gene which will tend to normalize the NAD+/NADH ratio which, as pointed out earlier, will work against the Warburg effect.  .

  1. Resveratrol inhibits HIF-1a and VEGF expression-here is an example of another natural compound that inhibits Warburg-type metabolism via HIF-1a.  Resveratrol is a stilbene found in red wine, red grape skins, Itadori tea, and many other natural compounds.  Resveratrol was shown in this study to have major effects on both baseline HIF-1a protein accumulation as well as hypoxia-inducible HIF-1a protein expression.  Unlike some of the other compounds listed here, the molecular mechanism for resveratrol-induced decrease in HIF-1a protein appears to be due to an increase in the degradation rate of HIF-1a by the 26S proteasomal unit,  not a decrease in the gene  expression of HIF-1a.  Thus, there should be a synergistic effect of combining a compound like resveratrol with some of the other compounds that inhibit gene expression of HIF-1a

References:

2006 Resveratrol inhibits hypoxia-induced accumulation of hypoxia-inducible factor-1alpha and VEGF expression in human tongue squamous cell carcinoma and hepatoma cells

2004 trans-3,4,5′-Trihydroxystibene inhibits hypoxia-inducible factor 1alpha and vascular endothelial growth factor expression in human ovarian cancer cells

Conclusion:  Resveratrol reduces HIF-1a by increasing its degradation rate of HIF-1a by the ubiquitin proteasomal system (UPS), not by down regulating its gene expression.

  1. Curcumin directly inhibits HIF-1a and VEGF by down regulating their gene expression

There are clearly multiple mechanisms of action for natural products.  Curcumin, the active ingredient in turmeric, derived from the roots of the turmeric plant is the main active ingredient in curry spice.  Here is the first of two mechanisms that may have anti-Warburg metabolism effects in human cells:

Curcumin has been shown to have major effects on tumor suppression, but all of the mechanisms have not been fully elucidated.  In the study below, curcumin was shown to have a direct effect on down-regulating gene expression for HIF-1a.  Curcumin also down-regulated gene expression for Vascular endothelial growth factor, VEGF, the downstream target gene of HIF-1a.  This effect occurred both under hypoxic conditions (normal anaerobic glycolysis) and under normoxic conditions (Warburg metabolism).

Reference: 2oo6 Curcumin inhibits hypoxia-induced angiogenesis via down-regulation of HIF-1

Conclusions:  Curcumin shouild have major direct effects in inhibiting or reversing Warburg-type metabolism, both under hypoxic and normoxic conditions

  1. Curcumin indirectly inhibits HIF-1a by inhibiting STAT3- Although curcumin has major anti-inflammatory effects due to its ability to inhibit NF-kB signaling, not as much is known about its ability to inhibit Warburg-type metabolism.  However, it may do this via STAT3. Curcumin is an inhibitor of the pro-inflammatory transcription factor,Signal transducer and activator of transcription 3, aka STAT3/ STAT3 is a central regulatory of tumor metastasis, but plays an integral role in inducing Warburg metabolism due to its effects on activating HIF-1a.  Curcumin inhibits STAT3, which then inhibits HIF-1a, which is a down stream target gene of STAT3.  Thus, curcumin indirectly affects aerobic glycolysis or Warburg-type metabolism via STAT3 inhibition.

Reference:  2009 STAT3 as a Central Regulator of Tumor Metastases

Conclusions:  Curcumin should have major indirect effects on Warburg-type metabolism via STAT3 inhibition.

  1. Vitexin directly inhibits HIF-1a protein and also down regulates HIF-1a and VEGF gene expression- this interesting natural flavanoid has a dual mechanism of action on reducing HIF-1a activity.  Vitexin is a flavanoid found in many different plants, including Anthurium versicolor(Aquino et al., 2001), Ficaria verna Huds. (Ranuncu- laceae)       (Tomczyk et al., 2002), and Cucumis sativus L. (Cu- curbitaceae) (McNally et al., 2003).  It has also been shown to be present in Kombucha tea.  It was shown to be a potent inhibitor of HIF-1a protein activity in phenochromcytoma cells.  Others showed it to be a potent inhibitor of hepatocellular cancer cells via HIF-1a.

References:

2006 Vitexin, an HIF-1α Inhibitor, Has Anti-metastatic Potential in PC12 Cells (abstract)

2006 Vitexin, an HIF-1α Inhibitor, Has Anti-metastatic Potential in PC12 Cells (PDF full text)

2007 Hypoxia and hepatocellular carcinoma: The therapeutic target for hepatocellular carcinoma

2011 Effect of solvent fractions of kombucha tea on viability and invasiveness of cancer cells—Characterization of dimethyl 2-(2-hydroxy-2-methoxypropylidine) malonate and vitexin

 IV.  SIRT1 and inflammation

NAD+ and SIRT1 availaility play key roles in both acute and chronic inflammation.  The 2013 publication Deacetylation by SIRT1 Reprograms Inflammation and Cancer summarizes key issues in the SIRT1-inflammation story.  The abstract reports: “NAD+-dependent deacetylase SIRT1 is a master regulator of nucleosome positioning and chromatin structure, thereby reprogramming gene expression. In acute inflammation, chromatin departs from, and returns to, homeostasis in an orderly sequence. This sequence depends on shifts in NAD+ availability for SIRT1 activation and deacetylation of signaling proteins, which support orderly gene reprogramming during acute inflammation by switching between euchromatin and heterochromatin. In contrast, in chronic inflammation and cancer, limited availability of NAD+ and reduced expression of SIRT1 may sustain aberrant chromatin structure and functions. SIRT1 also influences inflammation and cancer by directly deacetylating targets like NFκB p65 and p53. Here, we review SIRT1 in the context of inflammation and cancer.”  Five diagrams in that publication lay out the story.

  1. There are Two Types of Inflammation: Acute and Chronic

According to the article, chronic infections contribute up to 20% to cancer, inflammatory diseases contribute up to 20% of cancer causation, and obesity contributes up to 20% of cancer causation.

  • Chronic infection, inflammatory disease, and obesity all produce extracellular signaling compounds that are Toll-like receptor activators, or cytokines, or ROS, or RNS.
  • Whereas infections and obesity have other signaling mechanisms, TLR and cytokine signaling are the principle mediators of inflammation and trigger inflammation via three pathways:
  1. STAT1- This pathway is activated by the IFN family of cytokines. IFN induces STAT1phosphorylation, which results in cytoplasmic-to-nuclear translocation of STAT1, where STAT1 binds to and turns on inflammatory genes.  Unlike acetylation of NF-kB,  the acetylation of STAT1 inactivates the transcription factor, whereas HDAC3s (not SIRT1) deacetylate STAT1 and thereby allows for phosphorylation and inflammatory gene activation.  This process has nothing to do with NAD or SIRT1

Reference:  A phosphorylation-acetylation switch regulates STAT1 signaling

How to “fix” this problem:  take a polyphenol that is an HDAC inhibitor (Ex: EGCG), also take a STAT1 inhibitor,  and reduce IFN signaling

  1. STAT3- This pathway is activated by the IL-6 family of cytokines (IL-6, IL-10, etc.)   IL-6 induces the Janus kinase, called JAK in the cytoplasm, which then phosphorylates  STAT3.(This is why it is called the “JAK/STAT3 pathway”).  Phosphorylation of STAT3 by JAK results in cytoplasmic-to-nuclear translocation of STAT3, where STAT3 can bind to gene promoters to produce a transient activation of inflammatory genes.  IL-10 also activates STAT3, but paradoxically seems to have opposite effects.   IL-10 activation of STAT3 produces a sustained expression of genes that are mostly anti-inflammatory.  Thus STAT3 signaling can be pro or anti-inflammatory.

HDACs deacetylate STAT3 and disrupt the JAK/STAT3 signaling pathway.  These are not NAD-dependent deacetylases, however.

References:

STAT3 activation in response to IL-6 is prolonged by the binding of IL-6 receptor to EGF receptor

Activation of STAT3 by IL-6 and IL-10 in primary human macrophages is differentially modulated by suppressor of cytokine signaling 3

Cytokine response is determined by duration of receptor and STAT3 activation

Stat3/Socs3 Activation by IL-6 Transsignaling Promotes Progression of Pancreatic Intraepithelial Neoplasia and Development of Pancreatic Cancer

How to “fix” this problem:  take a polyphenol that is an HDAC inhibitor (Ex: EGCG), also take a STAT3 inhibitor, and reduce IL-6 signaling

  1. NF-kB- This pathway is activated by TLR signaling (double stranded RNA, single stranded RNA, bacterial flagellin, bacterial and viral CpG motifs, malarial pigment hemozoin, lipopeptides, lipoproteins, hyaluronan breakdown products such as short hyaluronic acid chains, endotoxin (LPS), amyloid-beta 42, viral proteins, and many other extracellular proteins).  TLR signaling phosphorylates the binding partner of NF-kB, called IKB-alpha.

The phosphorylation of IKBa results in the degradation of IKBa, which leaves NF-kB free to translocate into the cell nucleus.  NF-kb then binds to gene promoters of the inflammatory gene network.  Part of this includes the activation of the NAMPT gene, which increases NAD levels in the acute phase of inflammation.  The NAD stabilizes SIRT1a nd activates SIRT1.  Thus there is an increase in SIRT1 activity with acute inflammation.

Reference:  2010 TLR-signaling Networks: An Integration of Adaptor Molecules, Kinases, and Cross-talk

SIRT1 activity increases as acute inflammation evolves. The following diagram illustrates the cascade of events that occurs with TLR signaling:

Image may be NSFW.
Clik here to view.
SIRTINFLAMM1

   Reference for diagram:  Deacetylation by SIRT1 Reprograms Inflammation and Cancer

“Gain of SIRT1 functions during acute inflammation. TLR responses increase NAMPT-dependent NAD+ regeneration and activate SIRT1, which represses inflammation, glycolysis, and apoptosis and increases lipolysis, mitochondrial biogenesis, autophagy, and antioxidants. This sequential process restores homeostasis.”

Whereas bacterial infections, viral infections, surgery, accidents, and other triggers induce acute inflammation, chronic inflammation is typically triggered by disease and aging. For instance, obesity induces chronic inflammation which induces a number of inflammatory diseases, including HTN, type II diabetes, cancer, and atherosclerosis.

Chronic Inflammation produces a different form of gene expression than acute inflammation, however.  The differences in acute vs chronic inflammation includes different forms of chromatin (euchromatin vs heterochromatin).  The different “chromatin signatures” for each type of inflammation are shown below:

Image may be NSFW.
Clik here to view.
SIRTINFLAMM2

Illustration Reference:  Figure 2.  Deacetylation by SIRT1 Reprograms Inflammation and Cancer

“Inflammation phenotypes. Acute inflammation modifies the chromatin structure to switch from initiation to adaptation and resolution. Chronic inflammation sustains proinflammatory chromatin.”

With chronic inflammation, several things occur connected with SIRT1.  First of all, a high fat diet cleaves SIRT1 and low NAD levels reduce SIRT1 synthesis (see diagram below and article reference for diagram for more info on this).The net result of a high fat diet and lower NAD levels is a loss of SIRT1 function.  This results in hyperacetylation of the p65 subunit of NF-kB, which produces pro-inflammatory products.  These proinflammatory mediators have a “positive feedback” on the formation of obesity, diabetes, and aging.

The direct downstream effects of reduced SIRT1 include an increase in adiponectin, a decrease in PPARalpha, an increase in insulin and a lowering of UCP2, as well as an increase in telomerase expression, a decrease in UCP2 expression, and a decrease in FoxO1 and FoxO3 mediated pro-survival gene expression.

Reference for diagram below:  Deacetylation by SIRT1 Reprograms Inflammation and Cancer

Image may be NSFW.
Clik here to view.
SIRTINFLAMM3

Figure 4.

“Loss of SIRT1 functions during chronic inflammation. High fat diet reduces NAD+ availability and deactivates SIRT1, which promotes inflammation, lipogenesis, insulin resistance, and DNA damage. This unadaptive process prevents a return to homeostasis.”

When it comes to Cancer, SIRT1 has been a major puzzle.  Well the puzzle has now been solved – SIRT1 is both a tumor suppressor and a tumor activator.  Here is a diagram that illustrates that:

Image may be NSFW.
Clik here to view.
SIRTINFLAMM4

Diagram reference:  Figure 5.  Deacetylation by SIRT1 Reprograms Inflammation and Cancer  “Dual effects of SIRT1 on cancer: (A) inflammation and (B) modifying specific proteins.”

There is a diagram (below) that summarizes the factors that affect SIRT1 gene expression.

Image may be NSFW.
Clik here to view.
SIRTINFLAMM6

Diagram reference:  Deacetylation by SIRT1 Reprograms Inflammation and Cancer  Figure 1.

“SIRT1: (A) structure and (B) functions and regulation.”

Digital Health Part 4: Heart rate stress biomarkers derivable from smart watch data


By Vince Giuliano

This blog entry focuses deeper on personal research I have been doing on specific constitutional stress biomarkers derivable from measurements by a smart watch, a Basic Peak in my case.  I described the stress biomarkers and the first 30 days of experience with them in the January 2015 blog entry Digital health – health and fitness Wearables , Part 2: looking for practical stress biomarkers.   As off the present date, a)  I have more than 156 days of experience of measuring those biomarkers and correlating them with my personal stress events and stress interventions, b) With the assistance of Jim Watson, have further explored research related to the physiological events and processes underlying the biomarkers,  and c) as a result, have significantly enhanced confidence that the biomarkers are meaningful, actually work,  and are worth pursuing further.

In this blog entry a) I review what the stress biomarkers are and  how they are derivable from measurements that are made automatically by certain smartwatches and other wearable devices, b) discuss  how the biomarkers have behaved for me personally in the face of stress events and health interventions over the initial 146 days of measurement, and c) discuss why these measurements could be of significance from a health and longevity viewpoint for tens of millions of people who will soon be carrying Wearables  that measure heart rate.

RECAP AND SUMMARY

For an individual, resting heart rate if measured under consistent conditions can be a good relative indicator of day-to-day and longer-term constitutional stress. However, heart rate is notoriously variable depending on recent activity history, instantaneous stress factors, and such considerations as what you ate recently and when, whether you are standing, sitting or lying down and whether somebody is hollering at you. It can vary by several beats per minute (BPM) in the course of a given minute.   Measurement consistency can therefore best be achieved by measuring during sleep each day during similar segments in the sleep cycle. I use two biomarker indicators for resting heart rate:  MRHR representing morning resting heart rate measured shortly before waking up, and evening resting heart rate ERHR which is measured shortly after falling asleep. These measurements can be based on data from a smart watch which has a good heart rate monitor and a capability of discerning when sleep takes place.  During those particular times, heart rate tends to be relatively stable.  I also use a third metric,  which is the difference ERHR-MRHR for a given night of sleep.  I hypothesize that MRHR is a good surrogate for my constitutional stress level for facing the world that I have upon waking up in a typical morning. I also hypothesize that ERHR-MRHR represents overnight stress response recovery during sleep.

Here, I report on how these metrics correspond to known stress situations as well as health and longevity interventions for me personally during 146 day period of initial observations.  These time correlations between known stress and health interventions on the one hand and the stress biomarkers and the other hand tend to confirm my hypotheses as to the meanings of the biomarkers. They seem to work  I conclude this blog entry with more general comments about how these biomarkers require further validation, and why they could turn out to be quite valuable.

The central purpose of this blog entry is reporting my personal empirical results.  I have saved a further discussion of the science behind the measurements and additional complementary stress measurements for a subsequent Part 5 blog entry on Wearables  and personal biomarkers.

WHAT ARE THE BIOMARKERS?

Heart rate, sleep and measurements

First, I comment on why the biomarkers must be based on measurements during sleep and exactly how they are computed.    The Basis Peak you may recall detects sleep in three categories: REM, Deep Sleep and Light Sleep. The following chart shows my record for the evening of March 1

Image may be NSFW.
Clik here to view.
Peaksleep1Mar

These numbers are all derived from overnight monitoring of my heart rate, skin temperature, skin conductivity and movement. The Sleep Score is a number computed by the Peak software which I note but do not use so far.

The Peak also produces activity displays for both night and day. Following are my daily activity displays for March 1 and March 2.  The dotted red line shows heart rate with scale on the left as averaged about every 10 minutes, and the yellow line below shows being awake when yellow and sleep when blue.  Tall orange bars show periods of treadmill exercise.  I comment on some important recurring features, ones that show up on virtually all days.

Image may be NSFW.
Clik here to view.
Mar1activiy

Chart 1, March 1 activity record

To the right on the March 1 chart looking above the blue sleep indicator below, you can see a rapid heart rate drop going to bed and just before going to sleep.  This drop can range from 15 to 30BPM and corresponds to autonomic nervous system control balance being handed from the sympathetic system to the parasympathetic system.  Such a drop is typical and shows up for every night of normal sleep.

The March 1 chart shows a plateau of heart rates that are fairly constant just after falling to sleep. This is also typical and the place where I measure ERHR. I take the average of the first four of these for the first hour of sleep to define ERHR.  For March 1 these are 66, 66, 67 and 65 BPM for an average of 66 BPM.

Passing to the early morning of the March 2 activity chart below, paying attention to the blue sleep line below, you can see that the heart rate is quite constant while sleeping compared to its variations when awake.  Again, this is very typical.  During the nights there are periods of REM, deep and light sleep as shown for the night in question in the sleep chart above.

Image may be NSFW.
Clik here to view.
Mar2activiy

Chart 2 March 2 activity record

The March 2 chart shows a sleep plateau in the hour before waking up, also very typical and the basis for measuring MRHR.  I take the average of the last 4 values before starting to wake up to define MRHR, in this case the average of 62, 62, 62 and 63 BPM or 62.25BPM for the morning of March 2.

Both charts show the heart rate spiking up again after awaking, again very typical.  On the average HR  spikes up 15-25BPM after awakening.   So, you can see from the diagram that meaningfully stable heart rates that can reflect constitutional states can best be measured while asleep, not while awake. and not dropping or spiking up before or after sleeping.  My Peak smartwatch gathers its most valuable information while I am sleeping. To my friends planning to put their apple watches on the charger daily while sleeping – you may be passing up your most relevant health-related heart rate measurements.

SSR = ERHR- MRHR (Overnight sleep-related stress readiness recovery) for the night in question is  66-62.25= 3.75BPM.  This is a relatively low number, the average for me over the entire period being 6.86BPM.  SSR is almost always positive ranging from 0 to 17.  Only very rarely and in special situations does it go slightly negative – like during a night of being awake constantly going to the bathroom preparing for a colonoscopy the next morning,

Heart rate is constantly varying even during sleep, and not all plateaus are as nice and level as those illustrated above.  For example, here is the Image may be NSFW.
Clik here to view.
bMar5activiy
March 5 heart rate record during sleep:


Chart 3 March 5 activity record

The four scores averaged just before waking are 59, 59, 55. 55 BPM for a MRHR of 57.  Some of the start-sleep and end-sleep plateaus are of this varying nature whereas the majority reflected internal variations of only one or two BPM.

The biomarkers are:

MRHR (Morning resting heart rate), which I assert is a good measurement of overall body stress readiness.  I believe it is an indicator of the body’s ability to coordinate multiple systems (including cardiovascular, nervous, pulmonary and digestive) to handle stress situations and life situations in general.  The lower MRHR the better.   Again, this is defined as the average heart rate during what is generally a heart rate “plateau” that occurs in the morning during the hour just before waking up.  Measured in beats per minute (BPM)

ERHR (Evening resting heart rate).  The counterpart of MRHR after a day of activity, defined as the average heart rate during another heart rate “plateau” that occurs just after falling asleep.

SSR = ERHR- MRHR (Overnight sleep-related stress readiness recovery). Measures how much the multiple body systems that collectively determine heart rate have readjusted themselves during sleep to a lower heart rate, reflecting a lower rate of constitutional stress.

MRHR-RA, ERHR-RA and SSR-RA are 5 day rolling averages for each of the above, for the day concerned and for the four previous days. These measurements in part wash out day-to-day variations and are intended to make it easier to discern longer-term trends.

The units for each measurement ate beats per minute (BPM).

Importance of sleep and measurements

I need to emphasize that these measurements must be made while sleeping, so up until a few months ago they would have to be made wearing chest straps or in specifically-instrumented sleep-in environments like sleep labs.  That is because as shown above heart rate almost invariably changes very rapidly just before going to sleep or just after waking up and it is virtually impossible to capture stable values during those times. Now a number of smart watches and related Wearables  are capable of recording heart rates 24-7, detecting sleep by lack of motion as well as other parameters, and transmitting this information to the cloud where it can be analyzed.  My experience reported here is based on using a Basis Peak smart watch  which seems to capture the data well and display it coherently on my Android smartphone and online.

I need to point out that many of the generalizations I offer here are based on personal experience – N=1.  I have good reasons to believe these generalizations are valid for everyone, but they require further experimental validation by a larger group of subjects.

146 DAYS OF EXPERIENCE WITH THE BIOMARKERS

Summary

I have computed the biomarkers on a daily basis, recording them along with a number of other baseline measurements provided by the Basic Peak on a spreadsheet   I have been doing this on a continuing basis for 156 days now updating the spreadsheet daily and intend to continue doing so for a full year.  I have also made note of what seem to be unusual stresses as well as changes in my health interventions.  I have been paying attention to these biomarkers and what they mean on a daily basis.  Both to assist me in my personal health decisions and help me evaluate the usefulness of the biomarkers.  So much so, that my wife has described herself as “a Basis Peak widow.”  Here, I report on what I did and on some of the main observations that can be derived from the data for the first 146 days, a period with cutoff date 10 days that allowed me to prepare the graphs for this blog entry.

Capture and analysis of the smart watch data

Here is a screenshot of a small segment of the spreadsheet showing the inputs and some of the derived measures for a randomly selected period, days 72 through 85 of measurement:

Image may be NSFW.
Clik here to view.
Spreadsheet1

Chart 4: portion of spreadsheet

Rows 5 through 7 show hours and minutes of REM, light, and deep sleep for the preceding night as reported by the Peak. Reported time asleep is shown in row 14. Reported ratios of minutes asleep for the different categories of sleep are shown in rows 19 through 21, and corresponding minutes spent in the different categories of sleep are shown in rows 15 through 17. Rows 10 to 13 show other sleep data gathered by the Peak.

Row 22 shows MRHR for the evening of sleep before.  This is manually computed based on the four values in the before-waking sleep heart rate plateau

Row 23 shows ERHR for the evening of sleep before.  This is manually computed based on the four values in the after-going-to-sleep heart rate plateau.

Row 25 shows the derived measure SSR = ERHR- MRHR

Rows 26, 26,30 and 33 show additional daily data as reported by the Peak and the other rows at the bottom of the chart show derived measurements.

Additional rows of the spreadsheet for the same days can be seen here, showing more derived measurements:

Image may be NSFW.
Clik here to view.
Spreadsheet2

Chart 5: another part of spreadsheet

Row 35 shows backwards-looking 5 day rolling average SSR-RA = ERHR- MRHR, an important metric.

Row 36 shows backwards-looking 5 day rolling average MRHR-RA, also important.

The initial columns of the spreadsheet show average values over the entire period of measurement and standard deviations in those values.

Image may be NSFW.
Clik here to view.
Spreadsheet4


Chart 6: portion of spreadsheet showing averages for 146 days and standard deviations for the measurements.

Initial Overall observations

Over the entire period of observation, I have observed:

Image may be NSFW.
Clik here to view.
Spreadsheet5


I believe these numbers are generally indicative of someone in a state of good health, as I believe myself to be.  Later on, I explained how I see the large standard deviations to represent heart rate variability, also a good thing.

  1. All the numbers in the overall table have relatively large standard deviations for these day- to-day figures. This is not surprising for the heart rate measurements which may vary by several BPM from minute to minute let alone from day to day.  Also, given the rather consistent lifestyle which I lead, it is interesting to see the relatively large standard deviations in the amounts of different kinds of sleep.  The challenge, given this large variability, is to determine whether these measurements can produce useful insight.  I believe the answer is yes.
  2. Over the entire period of observation, ERHR-MRHR was positive except in a very few special instances when it dropped to zero or even to slightly negative values.  In those cases there is usually an explanation in terms of daytime events or disturbed nature of sleep.  ERHR-MRHR tends to be largest when there is a good night of sleep not preceded by stressful events the day before. This is consistent with the notion that this measurement represents overnight recovery of ability to handle constitutional stress.   However, it can depend on multiple factors reflecting a form of heart rate variability.
  3. There is a rich set of possible correlations among these measurements and I am still investigating some of them. For example there seems to be a strong negative correlation between ERHR-MRHR measured over a several day period and MRHR.  That is, several days of strong overnight stress response recovery leads to a lower level of MRHR which means they lead to higher constitutional level of ability to handle stress.  I am continuing to generate these measurements and likely will report additional observations in subsequent blog entries.

The biomarkers, stress events and health interventions

In the earlier blog entry on these measurements, I reported on the first 30 days of experience looking mainly at day to day  variations in MRHR and ERHR-MRHR.  Here, I focus on a somewhat  longer term perspective.  To see what is going on beyond the day-to-day variations, I have found it useful to wash those partially out,   For this purpose I focus here on the five day rolling averages MRHR-RA, ERHR-RA and SSR-RA.

Here are charts for ERHR-MRHR -RA (top) and MRHR-RA (bottom), for the period of observation. Notice the number of days reported is 5 less than the total number of days of observation because the rolling average calculation only started on day five. So, day 1 on these charts is actually day 5 of actual measurements. Image may be NSFW.
Clik here to view.
Spreadsheet66

Chart 7: Rolling averages for overnight stress recovery as measured by ERHR-MRHR -RA (top chart) and general constitutional stress level as measured by MRHR -RA (bottom chart).

Both of the charts list rolling average values for the day of concern and the four previous dayA.  They do not show the sharp peaks and valleys shown in the daily records.  It is useful to mention what was going on for me during the various periods covered by these charts.

Stress scores during the first month of measurement

Days one through 26 as numbered above correspond to the first 30 days of measurement. I reported on the correlations between the biomarkers and a certain number of stress events in the prior blog entry where events during  this interval are covered in more detail.  Starting on about day 4, I experienced stress associated with Christmas and associated birthdays, a number of parties, disrupted sleep schedules, late meals, consuming alcohol and the like. This corresponds to the first dip in the top chart starting about day 5.  The second and bigger dip in the top graph starting on about day 10 is associated with a colonoscopy leading to heart rate on the lower graph spiking up and maxing at about 62.5 on day 17.   After that the top graph shows fairly good stress recovery took about day 28 accompanied with generally lower values of MRHR shown in the lower graph. The slight downward on the top graph shown on about day 20 corresponds to mourning associated with the death of my first wife and the start upwards of the lower graph from day 28 to where it peaks on day 45.  Paradoxically this interval was one of the relatively high ERHR-MRHR -RA but still rising MRHR.

Stress scores and a West Coast trip

The sharp downwards spike in the top chart bottoming on day 64 corresponds to a trip to LA with disturbed circadian sleep timing, a strange uncomfortable bed and poor sleep, large late meals and active stressful days.   Overnight stress response recovery went way down. This trip started out when my MRHR-measured state  MMMmmstate of stress as shown on the lower  chart was fortunately low – about 58 BPM.  That is, I was prepared to handle the extra stress.  So I did not get sick as sometimes happened to me in the course of similar trips in past years.  However as you can see from the lower chart my MRHR trended up from about day 66 to day 81 in response to the accumulated stress, from around 58BPM to 62 BPM.

The scores and an NMN intervention

Around day 74 I realized I did not feel in a good energy state and I was unsatisfied with the relatively poor and worsening MRHR scores I was showing.  So I decided to pursue a temporary health intervention, which is to start consuming a limited supply of a NAD solution which was gifted to me when I was in LA.  I started consuming NMN in a liquid solution at the rate of about 1.2mg every morning.  This seemed at first to work very well.  I felt much better in a few days and you can see in the top chart that ERHR-MRHR –RA was great and shot up to over 10 by day 89 and MRHR improved during the same period, dropping to about 59.  I felt great by then, alert, super-productive, and capable of taking on serious new challenges.  (Faster than a speeding lawnmower and capable of jumping over large doghouses.)  But then the party seemed to end.  Between days 89 and 98, ERHR-MRHR –RA had crashed down from daily scores of over 10 BPM to scores of 3.5 BPM.  And as shown in the lower chart, MRHR was back up to 62 BPM again.  And this happened while I was continuing to supplement with NMN.  In fact I continued to supplement with NMN until my supply ran out on day 114.  But beyond day 98 it seemed to make no difference whatever.

What happened in this period?  Jim Watson had seen a similar pattern of improving and then worsening stress and biomarker scores (using a panel of conventional blood biomarkers, not these biomarkers) in someone else who was taking NMN.  They improved for a short period and then came back to where they started – despite continuation of NMN supplementation at a considerably higher level than I was doing.  Our tentative conclusion is that NMN supplementation as a general health intervention did not work because of body feedback inhibition loops related to NAD+ and SIRT1 which take a couple of weeks to kick in but then restore metabolic homeostasis to what it was before the intervention.  Probably it is a re-tuning of the NAD salvage cycle.   If this result is generalizable it could be highly relevant for the researchers and commercial companies setting out to enhance NAD+ levels by supplementation with NMN or NR.  See the extensive discussion in the recent blog entries in the series related to an NAD+ Part 1, Part 2, and Part 3.

 Final period  – systematic attention to sleep, diet and exercise and regular consumption of a liposomal anti-inflammatory preparation

 Around day 98 it was evident to me that the NMN was not a panacea, and I had to emphasize other known health interventions if I wanted to experience consistently feeling good and consistent high work energy and productivity.  Remember, I will be 86 in November so my needs for maintaining full health and functionality are more extensive than those of a normal 55 year-old.  I think of myself as being like an ancient  Mercedes car – capable of working very well but requiring careful and consistent attention to preventative maintenance.  I saw these measurements as somewhat more refined than a “check engine” light but performing a somewhat similar function.   For the first time I set goals of consistent values of ERHR-MRHR -RA (over 5.5 BPM and consistent values of MRHR of less than 60 BPM. Among the things I decided to do are:

  • Pay a lot more attention to sleep, establishing a consistent bedtime, avoiding early awakenings when possible, allowing plenty of time
  • Avoid late or heavy meals, drinking more than a small glass of wine at dinner, and avoiding sweet deserts
  • Avoid stimulants like coffee or chocolate afternoons or evenings
  • Start regular twice-a-day consumption of 4H-Lipo, an experimental liposomal preparation of four powerful anti-inflammatory herbs.  My colleagues and I had been making and I had been consuming this substance for over a year – another important story to be told in a different blog entry.  The key point is that only at this point in history did I start religiously taking a heaping teaspoon-full of it twice instead of once a day.
  • More careful monitoring and fill-in of exercise.  I have been monitoring steps for over a year, at first with my FitBit and later with my Peak smartwatch.  My daily goal is a minimum of 6,200 steps per day – about 3 miles of walking.  I became more rigorous of filling in exercise on the treadmill in the early evening to consistently meet this goal.
  • Respecting a balanced lifestyle and allocation of personal energies. I remain tremendously excited by my research related to this blog and two new longevity related research projects started only recently. (One of these is the anti-inflammatory liposome 4H-Lipo project referred to above; the other is the Wearables  measurement project reported in this and previous blog entries.) It is easy for me to immerse myself in this work and there is always much more to do in a given day then there is time for. So, I can  lose perspective as to the other important priorities in my life: being with other members of my large family and attending to constantly emerging needs of family members, leading a rich social life, handling financial issues, maintaining the infrastructure of my large house, keeping a half-dozen computers working well, and for half the year maintaining a summerhouse in New Hampshire.  While I focus intellectually on my personal needs for health and write about them as I am doing now, I could give short shrift to things I need to do such as get up from the computer and move around every hour or so.
  • Continuing experimental innovating with health interventions.  For example, up to this point I have not tried regular meditating, but plan to.

While I have striven to respect these and similar intentions with a little more focus since about day 98, I have not been strict in doing so. For example, I was willing to consume some cake and ice cream at my grandson’s birthday party and occasionally have been out for a late evening. Nonetheless, you can see that the general trend of ERHR-MRHR -RA has been upwards from day 98 to day 142, going from 3.5 BPM to about eight BPM, and the general trend of MRHR -RA has been downward from day 13 to day 142 from about 62 BPM to 58 BPM, so the above resolutions seem generally to be working. During this period, I should mention, I have experience some minor stresses corresponding to the minor valleys in ERHR-MRHR -RA, but no major stresses. It will be interesting to see as time progresses whether I can maintain levels of MRHR -RA significantly below 60 BPM. My next stress intervention will be an experimental program of mindful meditation.   My cutoff dates for the charts in this blog entry was day 146, e but now on the day of publication, I have gathered  156 days of data and my MRHR -RA has remained below 60 since day 135.  It now stands at 56.5.

My personal observations as reported in the previous blog entry and here support the hypotheses that for both day-to-day and longer term periods, ERHR-MRHR and MRHHR indeed are useful constitutional stress measurements that actually reflect the effects of known stresses and major health interventions.

I expect to carry out this measurement process for a full year and examine the possible impacts of a number of additional health interventions.

Again, at this point this hypothesis is based on observational correlations as well as on a body of theory related to heart rate measurements.   Other events may have played important roles as well. Also the data is only for one person up to this point, myself.  I believe it will be worthwhile for others to conduct similar measurements for themselves, however. For this purpose I  invite  my readers to  check out these biomarkers  for themselves and share their data with me.  I am willing to provide interested parties with a template for the spreadsheet I have been using.  Please write me if you would like such.

DISCUSSION

Applications of the biomarkers

Here is a few basic of questions that I believe the suggested biomarkers can help answer

  1.  How stressed out am I? –basically as a a guide to action decisions?  I want to push myself but not go over the edge so I get sick.   That is, given my state can I safely take on a new basic stress  — like a very long mountain hike in the cold, or an elective surgical operation or a quick-turnaround trip to China.  Should I go ahead with my planned trip to St Paul tomorrow morning to talk to the Kiwanis Club, given that I have a slight sore throat and I have to take a 4:30 AM plane?   Should I take on such a new stress or would it be better for me to take it easy for a while?  I think a low MRHR-RA (60BPM or less for me over a several day previous.) shows low stress and a high SSR-RA (8BPM or more for me) shows strong stress recovery capability and ability to handle a stress without getting sick.  On the other hand, MRHR-RA of 64BPM or more and/or SSR-RA of 3 or less will lead me to postpone the stress if I can. — In my 156 days of measurement experience, these RA measurements show strong patterns of variation.  They also tend to correlate well with how well and raring-to-go or how crummy I feel.  I am gradually developing trust in the measurements for these kinds of questions and action decisions.
  2. Is a new health intervention I am pursuing actually doing anything?  And. what would be the impact of discontinuing an existing health intervention or pattern?  Possibilities are multifold including adapting any of countless diets, changing my exercise pattern or the forms of exercise, altering my sleep rhythms or altering timing of meals, or meditating. And how about taking on a stressful new activity because of expected hormetic health benefits, like systematically exposing myself to cold?  I could sniff hydrogen sulfide or carbon monoxide.  On the other hand, I could quit doing something.   I have been consuming a large number of different dietary supplements at quite considerable cost. Could I save money by discontinuing some of these? And if so, which ones are superfluous? — I have been looking to the longer-term –MRHR-RA and SSR-RA measures to address such questions as these.
  3. How bad are the consequences of specific stress events?  Here is where the bioindicators definitely seem to work well.  As a busy professional sometimes I have to do things like fly back from California on overnight “red eye” flights or attend late-evening dinners, on occasion get only 3-4 hours sleep at night.  I participate in many socially-expected behaviors I know are not good for me such as going to late parties, drinking to many gin and tonics, consuming big heavy meals late at night or eating cake and ice cream at a family birthday parties,  and missing regular exercise for a day or two during travel or intense periods of work activity.  Such events definitely tend to be reflected in my daily MRHR and SSR measurements as you can see from the readings I have described below, and often it may take several days to recover from them.

Personal instrumentation – practical importance of the personal stress biomarkers biomarkers

The basic issue of concern here is personal health instrumentation.  How comfortable would you be flying in a plane which you knew had no flight instruments?  No way?  That is what we have been doing with our day-to-day health.   In the earliest days of aviation, airplanes had no instruments,  You flew strictly by “feel,” feel of how smoothly the engine is running, whether the plane was flying level, feel for where you are even though you can’t see the land below due to cloud cover. Further, feel for what is happening with the weather, feel for what is left of your fuel supply, feel for whether your flight controls like your wing and tail  tabs are working well.  That is largely how we run our health today – by feel.  I have an emotional crises or a surgical procedure and get little sleep.  How do I feel the next day, the next week?   I take a new supplement that is supposed to reduce my inflammatory status.  How do I feel the next day, the next week?  Is my pain less?   My medical blood tests like the cholesterol  levels and CRP and X-rays provide valuable data feedback, but these are periodic or event-driven and offer me no clues to day-to-day responses to day-to-day events.

In fact, I think such personal feelings about health status are extremely relevant.  But I badly want personal health instrumentation too.  That is what health Wearables  and the biomarkers proposed here are about.  Gradually over the years instruments were added to airplanes leading to the dozens of sophisticated instruments now expected and required to be in every cockpit.   My first personal health  instrument was a FitBit 1 which I started using over 15 months ago. It measured steps and flights of stairs climbed and provided an estimate of daily calorie expenditure. This was valuable information, but only a starter.  Five months ago I added a Basis Peak smart watch which captures 24-7 heart rate, perspiration and skin temperature in addition to movement.  That watch is capable of telling when I go to sleep and when I wake up, and of showing how my sleep breaks down into periods of REM sleep, light sleep and deep sleep, and it the Peak software displays how sleep correlates with heart rate and the other measurements it makes. I expect to continue with this process of improving my personal health instrumentation as long as I am functional.  We will discuss additional instrumentation in the following blog entry, including the use of  alternative Wearables  and several more measurements complementary to those described here.

The biomarkers and health Wearables

The good news is that health Wearables  are now being adopted by tens of millions of people – and some of these may, like the Basis Peak, be capable of recording the continuous heart rate measurements and other measurements enabling  computation  of the MRHR and SRR biomarkers identified here.  I am thinking of ones like the Jawbone UP3 and the Fitbit Charge HR and the Fitbit Surge.  And the most hyped and anticipated Apple Watch which may be worn by as many as 15 million people before the end of this year.  All are reputed to be capable of 24-7 heart rate monitoring.  Here is a recent review of Best heart rate monitor and HRM watches.

Except for the Peak, I do not know from direct experience how good these Wearables  are for continuous heart rate monitoring and reporting, and for correlating heart rate with sleep. The Basis Peak is a second-generation device embodying an improved set of sensors involving two constantly blinking LEDs.  The company designed the product based on its experience with its first generation wearable that was supposed to do more or less the same things – the Basis B1.  As to my friends  expecting that the Apple watch it will be their main health wearable, there appears to be both good news and bad news. The good news is that the watch seems to do a very good job and measuring heart rate.  The bad news is its poor suitability to do the job when needed, that is, during sleep.  The watch was designed to do so many things that it must be charged daily.  The general suggestion is to wear it during the day and put it in the charger at night.  Since the biomarkers described here must be based on measurements during sleep, this makes the Apple watch a possibly poor choice.  I typically recharge my Basis Peak every 2-3 days for 1-2 hours during periods of relative daytime inactivity.

This Part 1 blog entry provided a snapshot of what was happening in personal health instrumentation as of four months ago, and this Part Three blog entry discusses another well established but more-difficult to measure stress biomarker, heart rate variability, HRV.  I anticipate that a Part 5 entry will describe some additional health measuring Wearables  that have just come on the market

Comment on the science behind the biomarkers

The Wearables  part three blog entry examines heart rate variability (HRV), the physical factors which impact on HRV , and why HRV is a good indicator of constitutional stress state.  The timing of each beat of the heart is determined by constant real-time coordination between parasympathetic and sympathetic nervous systems, the pulmonary, endocrine and digestive systems, in part by the action of the vagus nerve.   How well this coordination is done is measurable by heart rate variability, the greater the heart rate variability the more the body is able quickly to accommodate to stresses.  It is generally recognized that conditions of poor stress responsiveness are reflected by low heart rate variability and high resting heart rate. Heart rate variability is normally measured by looking at what goes on in the time frame of a small number of heartbeats, analyzing the timing of individual heartbeat events in milliseconds, R to R intervals, and event frequencies spectra.  The biomarkers discussed in this blog entry are also measures of heart rate variability, but taken over much longer time frames, minutes hours and days.  So, for example, the measure ERHR-MRHR measures the body’s ability to readjust to a lower heart rate overnight, and the variance in MRHR is also a measure of day to day HRV.

Going back to my personal situation, recall that my mean ERHR-MRHR over the period of observation is 6.31 with a standard deviation of 3.97 which initially impressed me as being a very large standard deviation. One way of looking at this is to think of it as possibly reflecting inconsistent or poor sleep or possibly systematic measurement errors.  I now believe the large variation is simply a reflection of healthy macroscopic HRV.  What is important as reflective of health is that the mean values of these measurements remain within reasonable boundaries, not at all necessarily what goes on in an individual day. And this observation applies as well for the large standard deviations in all the other heart rate measurements I have documented as above.

I expect that the Part 5 blog entry in this Wearables  series will be authored by Jim Watson and myself and will explore the science behind these biomarkers in additional depth.  That blog entry will be concerned with the physiologic phenomenon reflected by the various biomarkers and their relationship to body stress, stress responses, and constitutional preparedness to handle stresses.  It will proposes additional measurement strategies and the use of alternative Wearables.  Specifically, it will look at the practicality of combining these biomarkers with more traditional HRV biomarkers.

The top 21Benefits of Meditation

By James P Watson, with editorial assistance and comments by Vince Giuliano and Melody Winnig

Initial  comments – by Vince Giuliano

This blog entry is about thoroughly documented health and possible longevity benefits of meditation, quite apart from possible spiritual benefits and largely independent of the various disciplinary approaches to meditation.  The content is supported by many studies with over 130 research citations listed here.  The content is also very closely related to the topics treated in of a number of other recent blog entries.  These together begin to piece together both a theoretical basis for health and longevity and a highly practical agenda for achieving it.  Namely:

  1. 1. Management of constitutional stress is one of the primary aspects of health that meditation is good for. A number of recent blog entries have focused on the use of wearable techology for day-to-day monitoring of constitutional stress and identifying what personal lifestyle patterns are most and least helpful in this regard.  See the blog entries in the Digital Health series:  Part 1 Digital health – health and fitness wearables, apps and platforms – implications for assessing health and longevity interventions,  Part 2: looking for practical stress biomarkers, Part 3: Heart Rate Variability: Principles and Science and Practical Measuring Devices and Part 4: Heart rate stress biomarkers derivable from smart watch dataCombining meditation and personal stress monitoring could be a powerful personal approach to health.
  2. Management of key metabolic factors related to health. Meditation up-regulates SIRT1 gene expression and has a number of positive effects on basic metabolic pathways affecting DNA repair, mitochodrial health, and telomere lengths,  Readers of this blog will recognize that we have discussed these and closely related topics in depth,  I mention only a few of the most-recent blog relevant entries from the series NAD+ an emerging framework for health and life extensionPart 1: The NAD World, Part 2: Deeper into the NAD World, hopeful interventions, Part 3: 30 Major Factors that Control SIRT1 Expression, SIRT1 Activity, and SIRT1-mediated Aging. and Part 4:the NQ01 gene, the Warburg effect, SIRT 1 and inflammation, and possible interventions. Meditation is a worthy addition to the health interventions mentioned in these blog entries.
  3. Maintenance of mental balance, positive outlook and averting dementias. Meditation does these things, remarkably well. We published the blog entry A simple, comprehensive plan to prevent or reverse Alzheimer’s Disease and other neurodegenerative diseases – Part 1: The PlanTo that plan we add meditation.
  4. Discussions of basic pathways involving chronic stresses, inflammatory processes and healthful interventions. Meditation reduces stress and contributes to controlling inflammation. Nrf2 and NF-kappaB have long been featured in this blog as well as the benefits of xenohormetic interventions involving phytochemicals – far too many links to list here but they can be found by searching in the blog.
  5. 5. Roles of circadian rhythms, sleep and sleep stages and relationship of sleep stages to what occurs in meditation Meditation must work via established evolutionarily-driven biological mechanisms. Most likely, these are mechanisms that are encountered in sleep, REM sleep in particular, and have to do with balance of control between the sympathetic and parasympathetic nervous systems.  We have touched on these topics in a number of blog entries.  For example, the physiologic mechanisms described in the Part 3: Heart Rate Variability entry are possibly key for explaining what goes on in meditation as suggested by the final study described here.

Brief history of meditation – by Melody Winnig

Archeologists and scholars speculate that primitive hunter-gatherer societies may have discovered meditation and its altered states of consciousness while staring at the flames of their fires, although there is little recorded pre-history on the origins of meditation. Meditation as a systematic practice gradually evolved in India and China.

The earliest documented records of meditation stem from the teachings of the Vedas in ancient India, about 1500 BCE. Around the 6th to 5th centuries BCE, other forms of meditation developed in Taoist China and Buddhist India. Buddha lived from about 563 BC to about 483 BC and taught in Sarnath, India. Early written records of the multiple levels and states of meditation in Buddhism in India are found in the sutras of the Pāli Canon, which dates to 1st century BCE.  By 653 CE The first meditation hall opened in Japan and Japanese Buddhism and began to evolve in the 8th century.

Although for many centuries mediation was primarily only practiced in Asia, Christian, Jewish and Muslim mystics each developed their own forms of meditative practices.  By the 18th century translations of ancient eastern teachings began to be studied by scholars in the West.

But it wasn’t until the late 1950’s that non-Asian immigrants in the West began delving into meditation, particularly Zen which was  in part popularized by the beat poets Alan Ginsburg, Jack Kerouac and Gary Snyder and writers such as Alan WattsPhilip Kapleau and D. T. Suzuki.

In 1959 Shunryu Suzuki, a Zen Buddhist teacher from Japan  arrived in San Francisco and began teaching Zen meditation practices to Americans. The American students that joined Suzuki to sit and study Zen eventually formed the San Francisco Zen Center with Suzuki, one of the first meditation teaching centers in the US.  Through the 1960’s -1970’s numerous meditation teachers from Tibetan, Vipassana and Zen Buddhist and Hindu traditions came to Europe and the USA to teach their forms of  meditation.

For over thirty-five years  there has been a growing movement to both understand the scientific mechanisms of meditation and to  de-mystify meditation and make the once esoteric practices available in numerous therapeutic settings.  A pioneer in this field is Jon Kabot-Zinn who, in 1979, founded the Mindfulness-Based Stress Reduction (MSBR) Program. at the University of Massachusetts Medical Center, now the Center for Mindfulness at the University of Massachusetts.

This was the first science-based program to use mindfulness mediation to treat patients with chronic illnesses.

From History of MBSR:  “MBSR spans a confluence of epistemologies and practices from two very distinct and until recently, divergent lineages, both committed to empirical investigation, albeit utilizing very different methodologies: that of science, medicine, and psychology, on the one hand, and that of Buddhist meditative traditions and their teachings and practices, known collectively as the Dharma, on the other. —  Our work over the past thirty-five years has shown consistent, reliable, and reproducible demonstrations of major and clinically relevant reductions in medical diagnoses and in medical patients with a secondary diagnosis of anxiety and/or panic, over the eight weeks of the MBSR intervention, and maintenance of these changes in some cases for up to four years of follow-up.”

Mindfulness and other Buddhist meditation techniques are being advocated in the West by innovative psychologists and expert Buddhist meditation teachers such as  S.N. GoenkaJack KornfieldJoseph Goldstein, and Sharon Salzberg, who have been widely attributed with playing a significant role in integrating the healing aspects of Buddhist meditation practices with the concept of psychological awareness and healing.

Currently mindfulness and other meditation practices are often taught to elementary school students, prisoners, sports teams, CEOs, caregivers and many other diverse populations.  Many medical schools and university neuroscience departments, ie. Brown, UCLA etc,  are also studying the connection between meditation and science, the  mind/body connection.

So, while health benefis of mediation is a new topic in this blog, this field has a long and venerable history.  As you will observe, many of the research citations listed in this blog entry go back to the 1990s and even earlier.  Yet, much is still being discovered and the Great Book of Meditation and Science is far from written yet.  You will also see very recent publications listed, dealing with new topics such as meditation’s epigenetic impacts and how it affects gene expression.  And employing new technology such as functional MRI and new forms of HRV, there is still much to be discovered about how meditation works.

The top 21 Benefits of Meditation- by James P Watson

The benefits are these.

  1. Meditation reduces stress, ruminative thoughts, appraisals of threat, increases compassion, and may slow the rate of cellular aging
  2. Meditation reduces heart rate, ambulatory blood pressure and stress-induced hypertension
  3. Meditation reduces carotid artery intimal thickness (CIMT)
  4. Meditation lowers lipid peroxide levels in the blood
  5. Meditation improves Heart Rate Variability (HRV)
  6. Meditation increases melatonin levels, which helps you sleep. Melatonin also prevents cellular senescence and activates SIRT1 gene expression
  7. Meditation increases telomerase activity by 43%
  8. Meditation effectively treats Depression with the same “effect size” as medication
  9. Meditation reduces mortality 
  10. Meditation down-regulates pro-inflammatory genes – COX2 and RIPK2
  11. Meditation increases DHEA levels and reverses its age-related decline by 5-10 years 
  12. Meditation increases the size of the brain
  13. Meditation increases Activity in the Brain’s “Attention Center”
  14. Meditation Deactivates (decreases activity) in the Brain’s “Daydreaming Center”, also known as the “Default Mode Network”
  15. Breathing Rate with Meditation Determines the size change of a very specific area under the occipitotemporal lobe.  Breathing rate decreases with increasing experience of the meditator
  16. Meditation can reduce Chronic Pain
  17. Meditation can reduce anxiety
  18. Meditation is an “Epigenetic Drug, changing gene expression
  19. Meditation can reduce stress in caregivers of those taking care of dementia patients and handicapped patents or children
  20. Meditation changes gene expression in peripheral blood lymphocytes
  21. Meditation reduces Loneliness in elderly adults

1.  Meditation reduces stress, ruminative thoughts, appraisals of threat, increases compassion, and may slow the rate of cellular aging

That sounds like hyperbole from a “blow hard” or recent convert, but it is actually from an article with a Nobel Laureate as a senior author! (Dr. Elizabeth Blackburn).  Here is the Reference:   2009 Can Meditation Slow Rate of Cellular Aging? Cognitive Stress, Mindfulness, and Telomeres

Here is a diagram from that article:

Image may be NSFW.
Clik here to view.
Med1

Dr. Blackburn and others have since developed an intense research program on meditation, since it was discovered that meditation can activate the telomerase enzyme better than any drug or supplement.  See also the 2010 publication co-authored by Dr. Blackburn Intensive meditation training, immune cell telomerase activity, and psychological mediators.

Several studies including randomized clinical trials have evaluated meditation of various types on reducing stress among normal individuals, among cancer patients, college studies, and among those with essential hypertension.  Meditation also increases forgiveness among college students!  Who would have guessed?  With mindfulness meditation, total Mood Distrubance scores were reduced by 65% with a 31% reduction in the Symptoms of Stress. Another type of meditation is called “compassion meditation”.  I like this type. The Dali Lama just celebrated his 80th birthday at the Honda Center here in Los Angeles.  Thousands of people and several Nobel Laureates came to celebrate his birthday in this convention center.  He gave a talk about the need for “compassion” in the world right now.  My friend, Dr. Ray Lam was there and said it was difficult to understand the Dali Lama, but that he was a very moving speaker.

Some studies suggest that mindfulness meditation and relaxation therapy have equal effects on stress. Others have suggest that mindfulness meditation is superior to relaxation therapy, but not all authors agree.  Here is a smattering of the relevant articles:

References:

2006 Passage meditation reduces perceived stress in health professionals: A randomized, controlled trial.

2008 Contemplative meditation reduces ambulatory blood pressure and stress-induced hypertension: a randomized pilot trial

2009 Effect of compassion meditation on neuroendocrine, innate immune and behavioral responses to psychosocial stress

2008 Meditation Lowers Stress and Supports Forgiveness Among College Students: A Randomized Controlled Trial

2007 A randomized controlled trial of mindfulness meditation versus relaxation training: Effects on distress, positive states of mind, rumination, and distraction

2005 Association of psychological and physiological measures of stress in health-care professionals during an 8-week mindfulness meditation program: mindfulness in practice

2000 A Randomized, Wait-List Controlled Clinical Trial: The Effect of a Mindfulness Meditation-Based Stress Reduction Program on Mood and Symptoms of Stress in Cancer Outpatients

  1. Meditation reduces heart rate, ambulatory blood pressure and stress-induced hypertension

A randomized controlled clinical trial was done in 2008 by the center for Contemplative Meditation at the U. of Wurzburg, Germany.  Normally an article like this would be published in an obscure hypertension journal, but this was published in the Journal of Hypertension AND also in nature.com, Contemplative meditation reduces ambulatory blood pressure and stress-induced hypertension: a randomized pilot trial.

.The Clinical Trial consisted of 52 pharmacologically untreated subjects with essential hypertension.  The 52 subjects were randomly allocated to either 8 weeks of contemplative meditation with creating techniques (CMBT) or no intervention.  The CMBT consisted of two early morning and evening sessions of training for 40 min in each session. The first 12 minutes of this 40 minute sessions involved teaching the individuals to breathe deeply.  The 2nd phase was 30 minutes of meditation based on Christian tradition (that is what they call “contemplative meditation”.)  The observers were blinded.  The CMBT reduced heart rate (-13% vs 0% in controls) reduced systolic BP (-15 mmHg vs 3mm in controls) and diastolic BP (-13 mmHg vs -2% in controls) and also reduced the scores on the mental stress test (11 mmHg lower BP during mental stress test in the CMBT group).

As it turns out, several prior studies had already shown this effect.  These studies are Referenced below:

1996 Trial of stress reduction for hypertension in older African Americans. II. Sex and risk subgroup analysis

1995 A randomised controlled trial of stress reduction for hypertension in older African Americans

2002 Psychosocial Stress and Cardiovascular Disease Part 2: Effectiveness of the Transcendental MeditationProgram in Treatment and Prevention

  1. Meditation reduces carotid artery intimal thickness (CIMT)

This was very surprising to me!  Carotid artery intimal thickness (CIMT) is supposed to be an irreversible event!  In several studies, they showed that it was reduced or reversed.

2002 Psychosocial Stress and Cardiovascular Disease Part 2: Effectiveness of the Transcendental MeditationProgram in Treatment and Prevention

1996 Stress Management and Health (slide presentation)

2000 Effects of Stress Reduction on Carotid Atherosclerosis in Hypertensive African Americans

1994 George Lyman Duff Memorial Lecture. Arterial imaging and atherosclerosis reversal

2004 Review of Controlled Research on the Transcendental Meditation Program and Cardiovascular Disease. Risk Factors, Morbidity, and Mortality

  1. Meditation lowers lipid peroxide levels in the blood

One study has shown that transcendental meditation reduces lipid peroxide levels in serum.  This was another surprise!  This study compared long term meditators with controls who did not meditate.  This study had 41 patients that were studied, 18 of which were long term meditators and 23 were controls.  They showed that the long term meditators had a 15% lower lipid peroxides (measured by TBARS) in their plasma (serum), compared to controls.

Reference:  1998 Lower lipid peroxide levels in practitioners of the Transcendental Meditation program

  1. Meditation improves Heart Rate Variability (HRV)

This particular section of this blog is the longest and I am concerned I may lose my audience, so here is the one graph that will convince any scientist or lay person that meditation makes a dramatic change in HRV.  This graph is from Harvard Medical School scientists:

Image may be NSFW.
Clik here to view.
Med2

Reference:  1999 Exaggerated heart rate oscillations during two meditation techniques

Heart Rate Variability (HRV) is the “beat-to-beat” change in heart rate.  It is NOT a measure of heart rate, per se.  Whereas a LOW heart rate is generally a sign of health, HIGH heart rate variability is a sign of health. Over 17,895 PubMed research publications have been written on HRV as of this year and the scientific evidence on the importance of this health biomarker is getting stronger and stronger.  For instance, in a subset of patients in the Framingham Heart Study that has been ongoing for over 40 years, HRV had an independent predictive value in determining “all cause mortality”.  I have written a recent blog on our website about HRV that you may want to read.   Digital health – health and fitness wearables, Part 3: Heart Rate Variability: Principles and Science and Practical Measuring Devices.

Here is  a diagram from the American College of Cardiology on the Frequency Power Spectrum of HRV.

Image may be NSFW.
Clik here to view.
Med3

Image source

Basically there are two ways of measuring HRV – Time Domain measurements (Ex: R-to-R interval measurements in milliseconds) and Frequency Domain Measurements (see diagram above) which require Fourier transformations (“complicated math”) to derive.   Whereas Time Domain measurements are easy to do and quite reproducible, Frequency Domain measurements are much harder to do and typically require sampling of HR over several hours or 24 hours.  Thus Holter monitoring data has become the most common method of collecting HRV data in clinical research.

The 10 most important things that change HRV

The following diseases have been shown to depress HRV and the following interventions have been shown to improve HRV:

  1. Meditation – Meditation can have a dramatic positive effect on HRV. There are over 1,000 studies that show this effect.  This includes many forms of mediation, including Pranayama meditation, Kundalini Yoga meditation, Chinese Chi meditation, Mindfulness Meditation, and even just deep breathing exercises.  The most dramatic changes in HRV that have been found with Chinese Chi meditation and Kundalini Yoga meditation in experience practitioners.   In these individuals, dramatic oscillations in HRV occur in the 0.025-0.35 Hz band, which spans the VLF, LF, and HF spectrum.  The most dramatic change occurred in the VLF/LF frequency domain below 0.05 Hz.  The above 3D illustration of the data (the topographic map) from experienced meditators, shows their HRV power spectrum before meditating, during meditating, and after meditating. A dramatic shift to higher frequencies is shown during meditation.

Not only could this be measured in the power spectrum of HRV, it could also be measured simply with the change in time domain (rMSSD, SDNN, etc.).  Experienced practitioners of Chi Meditation and Kundalani Meditation both had fluctuations in the time domain of HRV by as much as 30-35 beats per minute within a 5 second interval!  This is a more dramatic increase that even that seen in well-trained endurance athletes!  (they compared the meditators with the athletes).  Here is a depiction of the same data but in the time domain for Chi Meditation and Kundalani Meditation:

Image may be NSFW.
Clik here to view.
Med4

Interestingly, these extremely prominent oscillations in HRV correlated with slow breathing.  These HRV oscillations seen during meditation were larger in amplitude than those seen with the respiratory sinus arrhythmia observed during the pre-meditation control state.  These HRV oscillations were also much larger than those seen with metronomic breathing (i.e. breathing slowly to a metronome).  They were even larger than the HRV oscillations seen at night in elite triathlon athletes during sleep (i.e. nocturnal HRV measurements).

Many other authors have found similar high amplitude, very low frequency/low frequency oscillations in HRV with different types meditation techniques.  There does not appear to be one particular meditation technique that has a “monopoly on health”.  The HRV oscillations seen with meditation cannot be explained by respiratory sinus arrhythmia (i.e. due to breathing) or changes in autonomic outflow, such as the vagal parasympathetic dominance seen in athletes.

Whereas the old view of mediation was that meditation simply “calmed the heart and mind”, this HRV data contradicts this simplistic view.  This data shows that meditation produces an active cardiac dynamic change, not a quiescent cardiac dynamic.  This phenomena has been referred to as the “meditation paradox.”  The Meditation Paradox is the fact that the HRV evidence does not fit the old “quiescent theory” of what meditation does

Conclusion:  Meditation has profound effects on HRV that can be easily measured in both the time domain (R-to-R interval measurements such as rMSSD, SDNN, etc.) and in the frequency domain (VLF, LF, and HF power spectrum).  In experienced mediators, large oscillations in HRV occur with changes of 30-35 bpm over 5 seconds in the time domain and large frequency oscillations that spanned 0.0025 to 0.35 Hz range.   These findings contradict the conventional wisdom and the “status quo” view of meditation as merely a way of inducing calm or a “homeostatic” state by reducing psychologic stress or lowering breathing rate.  In summary, the objective HRV data from meditation shows that it is more than simply “relaxation therapy” or “breathing exercises”.  Metronomic breathing does not mimic meditation. .

References:

2008 Inward-attention meditation increases parasympathetic activity: a study based on heart rate variability

2003 Heart rate dynamics during three forms of meditation

2008 Changes in heart rate variability during concentration meditation

2002 Effects of Qi-Training on Heart Rate Variability

2009 Effect of integrated yoga on stress and heart rate variability in pregnant women

2006 Effects of a Randomized Controlled Trial of Transcendental Meditation on Components of the Metabolic Syndrome in Subjects With Coronary Heart Disease

2006 Effects of two yoga based relaxation techniques on heart rate variability (HRV).

2004 Heart rate dynamics during three forms of meditation

1999  Exaggerated heart rate oscillations during two meditation techniques

In the remainder of this Section on Heart Rate Variability, you will see a number of literature citations pointing to topics discussed commonly in the literature of both meditation and HRV – topics like constitutional stress, impacts of exercise, and nature of sleep.  We infer that this is because the mechanisms of action of both sleep and meditation affect the systems and pathways that impact HRV.

  1. Hypertension, Coronary Heart Failure, and Myocardial Infarction All of these decrease HRV due to reduced parasympathetic activity, which is manifested by a lower “HighFrequency” (HF) in the power spectrum of HRV measurements.  In the time domain, HTN, CHF, and MI all decrease the root mean square standard deviation (rMSSD) of heart rate variability measurements.  It is not surprising, then to find out that all of the drugs used to treat HTN, CHF, and MI which have been shown to change long term mortality also improve HRV, whereas the drugs that are used to treat HTN, CHF, and MI which did not alter long term mortality did NOT change HRV.  Here are some examples:
  • Antiotensin converting enzyme (ACE) inhibitors – they lower 5 year mortality and improve HRV
  • Digitalis – this does not improve HRV and makes very little difference in 5 year mortality
  • Lowered sodium diet – lowering sodium in the diet improves HRV, whereas increasing salt in the diet makes HRV worse. This appears to be mediated by an increase in NO production with a high sodium diet and increased NO sensitivity as an adaptive function due to the high sodium.

References:

2008 Angiotensin II disproportionally attenuates dynamic vagal and sympathetic heart rate controls

2004 Relationships among heart rate variability, hypertension, and relaxation techniques

2014 Disruption of cardiovascular circadian rhythms in mice post myocardial infarction: relationship with central angiotensin II receptor expression

1996 Role of AT1 receptors in the central control of sympathetic vasomotor function.

2012 Effect of losartan, an angiotensin II type 1 receptor antagonist on cardiac autonomic functions of rats during acute and chronic inhibition of nitric oxide synthesis

2001 Contribution of nitric oxide to arterial pressure and heart rate variability in rats submitted to high-sodium intake

  1. Exercise – Exercise has been shown to dramatically improve HRV.  However, during exercise itself, HRV is decreased.  HRV does not improve until you have fully recovered from exercise.  After exercise recovery, there is an increase in High Frequency (HF) power and lowering of Low Frequency (LF) power.  It increases the root mean square of standard deviation in R-to-R intervals (rMSSD).  The most important health benefit of exercise may have more to do with improving HRV than they do with any of the other 80 molecular mechanisms that have been scientifically proven to occur with aerobic exercise.  Specifically, this may explain some of the benefits of exercise on depression, reducing Alzheimer’s disease, reducing cancer risk, etc.

Since exercise is “free”, exercise is probably the best “drug” to improve your HRV!

References:

2008 Effect of low-dose endurance training on heart rate variability at rest and during an incremental maximal exercise test

2001 Effects of aerobic exercise training on 24 hr profile of heart rate variability in female athletes

2003 Heart rate variability and autonomic activity at rest and during exercise in various physiological conditions

1997 Autonomic differences between athletes and nonathletes: spectral analysis approach

2003 Heart rate variability in athletes

1995  Assessment of training-induced autonomic adaptations in athletes with spectral analysis of cardiovascular variability signals

2006  [Heart rate variability and physical exercise. Current status].

  1. Sleep – Sleep has a positive effect on HRV.  Although there are differences in HRV between REM and non-REM sleep, a good night’s sleep will make dramatic improvements in HRV during the following daylight waking hours.  Interestingly, meditation improves HRV during sleep after cyclic meditation followed by supine rest.  This supports the idea that sleep and meditationmay have a synergistic effect on HRV.

References 1969 Reflex Regulation of Arterial Pressure during Sleep in Man

2010 Heart Rate Variability During Sleep Following the Practice of Cyclic Meditation and Supine Rest

  1. Lack of Sleep and Jet Lag– cutting across time zones and disrupting normal circadian rhythms dramatically decreases HRV.  The depressed HRV does not resolve until the “Jet lag” has resolved.
  2. Stress and Glucocorticoid administration– Stress and steroids both depress HRV.  Psychological stress is even worse than glucocorticoids because so many other hormones are also increased with stress, such as epinephrine, norepinephrine, etc.

The mediator of this impaired HRV is hydrogen sulfide signaling.

References:

2014 Vascular Disease: Biology and Clinical Science: Session Title: Microcirculation and Cerebral/Coronary/Peripheral Circulation II

Glucocorticoids modulate baroreflex control of heart rate in conscious normotensive rats

  1. Chronic Hypoxia – Chronic hypoxia (such as in sleep apnea or COPD) does not affect heart rate that much but has a dramatic effect on HRV.  This is why sleep apnea must be diagnosed and treated in these patients.  Likewise, chronic hypoxia induced by  rapid elevation gain to high altitude results in a dramatic depression in HRV.  However, if one climbs to high altitude slowly and acclimatizes, there may be a transient depression in HRV, but it usually returns to normal unless high altitude illness occurs, such as HAPE or HACE.

References:

2006 Heart rate variability in rats with chronic hypoxic pulmonary hypertension

1996 Effects of high altitude acclimatization on heart rate variability in resting humans.

2008 Effect of rapid ascent to high altitude on autonomic cardiovascular modulation

2005 Autonomic adaptations in andean trained participants to a 4220-m altitude marathon

2001 Alterations in autonomic nervous control of heart rate among tourists at 2700 and 3700 m above sea level

  1. Air pollution – Air pollution worsens HRV.   A recent study from Harvard’s School of Public Health showed that air pollution in general reduced HRV, but ozone and particulate matter in the air were most associated with a decrease in HRV.

Reference: 2005 Effects of air pollution on heart rate variability: the VA Normative Aging Study

  1. Happiness vs Depression – Happiness increases HRV whereas depression dramatically reduces HRV.  Surprisingly, although antidepressant drugs may reduce symptoms of depression, they do not improve HRV.  This suggests that these drugs do not treat the underlying cause of depression, but instead are chemically treating the symptoms of the disease.  This is a very sobering thought. On the other hand, meditation improves HRV and effectively treats depression.  This suggests that meditation is treating the underlying cause of the disease.  One interesting report showed that the effects of negative emotions on HR lasted longer than the effects of positive emotions on HR.  This suggests that we “cannot afford” to stay depressed and “wallow in our self pity”

References:

2003 Heart rate response is longer after negative emotions than after positive emotions

1981 Cardiovascular Differentiation of Happiness, Sadness, Anger, and Fear Following Imagery and Exercise1

2008  Depressed Mood, Positive Affect, and Heart Rate Variability in Patients With Suspected Coronary Artery Disease

2008 Neural correlates of heart rate variability during emotion

  1. Psychological Stress and Anxiety – Psychological stress worsens HRV. Anxiety also worsens HRV.  With normal circadian rhythms, HRV gradually worsens during the day.  This may explain why we humans are more vulnerable to the harmful effects of stress when we work long hours or are subject to stressors when we get home from work (i.e. spousal conflicts usually occur in the evening).

References:

2011 Exploring the Effectiveness of a Computer-Based Heart Rate Variability Biofeedback Program in Reducing Anxiety in College Students

2012 Of larks and hearts — morningness/eveningness, heart rate variability and cardiovascular stress response at different times of day

2001 Comparison of heart rate variability measures for mental stress detection

  1. Meditation increases melatonin levels, which helps you sleep. Melatonin also prevents cellular senescence and activates SIRT1 gene expression 

There is strong evidence that meditation increases endogenous melatonin production.

  • Although sleep is the obvious benefit of melatonin, there are many other benefits from melatonin because it is a “mitochondrial specific antioxidant.” .
  • There is also strong evidence that melatonin has health span and life span enhancing properties through molecular mechanisms that are related to caloric restriction, specifically SIRT1 activation and Nrf2 activation.

Melatonin may be the most “pleitropic molecule” in the entire body!  It has so many effects and so many mechanisms.  Functional MRI studies have shown that meditation increases metabolic activity in the pineal gland (see Reference below).  Measurements of melatonin levels in long-term practitioners of meditation show statistically significant increases in plasma levels of melatonin in several independent studies (see References below).

There are multiple molecular mechanisms by which melatonin has health-promoting benefits.  This includes anti-inflammatory and immune stimulating effects, anti-cancer and chelating properties, anti-oxidant properties.  For instance, melatonin has been shown to inhibit NF-kB signaling, thereby reducing inflammatory gene expression.  Moreover, melatonin has been shown to increase Nrf2 signaling.

The most fascinating recent molecular mechanism that has been discovered is the effect of melatonin on preventing cellular senescence (see Reference below).  More recently, melatonin has been shown to induce gene expression of SIRT1.  SIRT1 is one of the major calorie restriction (CR) pathway genes that has been shown to explain part of the molecular mechanisms of CR on health span and lifespan.  In 2014, Hardeland published a paper showing evidence that melatonin also exerts its effects through epigenetic mechanisms, noncoding RNAs, and via messenger RNA stability.  Here is a simplified illustration on how this works:

Image may be NSFW.
Clik here to view.
Med5

Illustration Reference:  2014 Melatonin, Noncoding RNAs, Messenger RNA Stability and Epigenetics—Evidence, Hints, Gaps and Perspectives

Conclusion:  Meditation increases melatonin during the day and at night.  This effect has widespread effects throughout the entire body due to multiple signaling pathways which are activated by melatonin.  This is further evidence that the health and longevity benefits of meditation can no longer be dismissed!

  1. Meditation increases telomerase activity by 43% 

Telomeres are the “caps on our chromosomes” that protect our chromosomes from forming bridges (translocations) with other chromosomes.  With aging, our telomeres shorten due to the “end replication problem”, which is the shortening of the end of the DNA strand when it is copied by DNA polymerase with cell division.  However, if cell division was the only cause of telomere shortening, then everyone’s telomeres would shorten at the same rate.  In real life, this is not the case. What basic science researchers have discovered is that cellular stress accelerates telomere shortening.  When the telomere gets too short, it triggers the “DNA damage response” which then causes the cell to die or to undergo cellular senescence. Fortunately, there is an enzyme that lengthens the telomeres called “telomerase”.  Telomerease was discovered by Dr. Elizabeth Blackburn (at UCSF) and two other researchers.  They won the Nobel Prize in 2008 for their discovery over 30 years ago.

Reference: 2010 Intensive meditation training, immune cell telomerase activity, and psychological mediators. “RESULTS: Telomerase activity was significantly greater in retreat participants than in controls at the end of the retreat (p<0.05). Increases in Perceived Control, decreases in Neuroticism, and increases in both Mindfulness and Purpose in Life were greater in the retreat group (p<0.01). Mediation analyses indicated that the effect of the retreat on telomerase was mediated by increased Perceived Control and decreased Neuroticism. In turn, changes in Perceived Control and Neuroticism were both partially mediated by increased Mindfulness and Purpose in Life. Additionally, increases in Purpose in Life directly mediated the telomerase group difference, whereas increases in Mindfulness did not. — CONCLUSIONS:  This is the first study to link meditation and positive psychological change with telomerase activity. Although we did not measure baseline telomerase activity, the data suggest that increases in perceived control and decreases in negative affectivity contributed to an increase in telomerase activity, with implications for telomere length and immune cell longevity. Further, Purpose in Life is influenced by meditative practice and directly affects both perceived control and negative emotionality, affecting telomerase activity directly as well as indirectly.”

Interestingly, “Relaxation therapy” does not turn on the telomerase enzyme, but meditation does activate telomerease by 43%.  This was a surprising study that was published in 2012.  This was after an 8 week training course in meditation. (Without the meditation course, the control group who did not meditate had no increase in telomerease activity).

Three other studies have been done since then that have confirmed this finding.  A meta-analysis of these 4 studies has been already done and concluded that the data was strong enough to believe.  They suggested a long term trial to verify that telomere length increases would result from this increase in telomerase enzyme activity.   However, so far no long term studies has been done to prove that the “meditator” telomeres increase in length.  What we do know is that telomerase activity clearly increases more dramatically with meditation than any telomerase supplement that has ever been devised or sold.

Conclusion:  Mindful meditation and other forms of meditation clearly increase telomerase activity.  Whether this is due to an increase in gene expression or a decrease in telomerase enzyme inhibition by other factors such as the long noncoding RNA, TERRA, is still not yet known.  Whether meditation will actually increase telomere length is also not yet known, but this is the most effective thing that has ever been found to increase the telomerase enzyme activity.

  1. Meditation effectively treats Depression with the same “effect size” as medication

There is very strong scientific evidence that meditation has profound benefits for treating depression.  The first Reference below is a doctoral dissertation on the effects of meditation on depression. Randomized controlled trials of mindfulness meditation training have also been done which show objective measurements of improvement in sleep and mood.  Both Major Depressive Disorder (MDD) and Unipolar depressive syndromes and recurrent brief depressive disorder have been shown to improve with meditation.  A recent study out of Johns Hopkins by Dr. Madhave Goyal, MD, MPH, reviewed 18,000 earlier studies on depression and ultimately arrived at 47 quality studies that had been done as randomized clinical trials (RCTs) to study the effects of meditation on depression.  Together, the number of patients in these 47 RCTs was over 3,500 patients.  All of these patients were either randomized to meditation (mindfulness or mantra) or another treatment like exercise.  The results of this meta-analysis showed that the “effect size” for meditation on depression was 0.3.

In other studies that looked at medications for depression, a similar “effect size” of 0.3 has been found.  The best results of treating depression with meditation involve an 8-week training period.  The studies showed that as little as 2.5 hours of meditation per week is adequate to show a benefit for depression.  Most of these programs are called “Mindfulness-Based Stress Reduction”.

References:

2014  For Depression Treatment, Meditation Might Rival Medication

2004  The Effects of Mindfulness Meditation on Cognitive Processes and Affect in Patients With Past Depression

2012 Mindfulness-based stress reduction, mindfulness-based cognitive therapy, and Zen meditation for depression, anxiety, pain, and psychological distress

2006 MEDITATION AND DEPRESSION

2014 Mindfulness Meditation Can Help Relieve Anxiety And Depression

  1. Meditation reduces mortality 

  Mortality in the Elderly w/ and w/o Mediation

A randomized, prospective study of TM was done by Alexander and colleagues from Maharishi International University in Fairfiled, Iowa in 1989. Reference:  1989    Transcendental meditation, mindfulness, and longevity: an experimental study with the elderly

In this study, they looked at mortality in a group of elderly volunteers in rest homes with an average age of 81.After one year, the transcendental group showed a significant improvement in quality of life and BP.  After 3 years, the number of surviving in the meditation group was significantly higher than in the non-meditating group. Even in the 15-year follow-up study, there was a lower cardiovascular mortality rate than in the control group.

At the 2015 Paul Glenn Conference on Aging at Harvard, Vince heard Dr. Elisbeth Blackburn talk about depression and telomere length being very accurate predictors of mortality.  If we understood correctly, 100,000 individuals were tracked over a 5 year period by the researchers.  They looked at dozens of biomarkers for health and longevity. The study was sponsored by Kaiser Permanente and was conducted by several Kaiser physicians as well as Dr. Elizabeth Blackburn from UCSF.   In this study, they found that patients with major depression had a higher rate of “all cause mortality”, but depression alone could not reliably predict 5-year mortality rates.  Likewise, shortened telomeres also predict mortality, but telomere length alone did not reliably predict 5-year mortality.  However, when both depression and short telomere data was combined, the two biomarkers predicted a 100% mortality over the subsequent 5 years.  This is the most indicative 5-year biomarker of mortality we have encountered that does not involve a deadly disease process.

Conclusion:  This study has not yet been published, but when it does, all doubts about the importance of mental health and telomeres will be dispelled.  No other biomarkers can predict 5-year mortality as accurately as major depression and telomere length, except a few for absolutely deadly diseases like glioblastoma.  Meditation may be the only intervention that both directly affects depression and telomere length.

  1. Meditation down-regulates pro-inflammatory genes – COX2 and RIPK2

This was a real surprise.  Researchers found that RIPK2 and COX2 were down regulated in PBMCs with meditation.  Meditation also reduced C-reactive protein gene expression in another study.

References:

2014  Rapid changes in histone deacetylases and inflammatory gene expression in expert meditators

2012 Mindfulness-Based Stress Reduction Training Reduces Loneliness and Pro-Inflammatory Gene Expression in Older Adults: A Small Randomized Controlled Trial

2013  Yogic meditation reverses NF-κB and IRF-related transcriptome dynamics in leukocytes of family dementia caregivers in a randomized controlled trial

  1. Meditation increases DHEA levels and reverses its age-related decline by 5-10 years 

DHEA-S levels in meditators was higher in all 11 age groups studied, in both male and female, and was independent of diet, BMI, and exercise.

Dehydroepiandrosterone sulfate (DHEA-S) is a “pre-hormone” that can be used by your body to make testosterone (in the testes) and estrogen/progesterone (in the ovaries).  More importantly, testosterone, estrogen, and progesterone are all neurohormones that are needed in the brain for normal neurogenesis in males and females.  Unfortunately both DHEA-S levels decline with aging and so does the production of sex-steroid neurohormones in the brain.

In several studies, DHEA-S levels in serum (blood) was measured and found to be higher in meditators vs non-meditators.   This finding was consistent in all 11 age categories studied and amounted to a 5-10 year “younger DHEA-S level”.  More importantly, this effect was independent of body mass, exercise, and diet.  In trials of oral DHEA-S administration, researchers have documented increases in more than just sex steroid hormones.  For instance, in one trial of 100mg/day of DHEA-S, serum androsternedione, testosterone, and dihydrotestosterone all increased to levels above gender-specific ranges in women, but not in men (in men, the effect was not as dramatic).   DHEA administration also increased serum IGF-1 levels by 16% in men and 31% in women.  Body fat decreased in males (1 kg or 6% of body weight) but not in females.  In men, knee muscle strength lumbar back strength both increased. All of these changes were statistically significant in this study that was carried out for 6 months.

Conclusion:  Meditation induces the endogenous synthesis of DHEA-S. I think this is remarkable.  Although the exact molecular mechanism of how meditation induces DHEA-S synthesis is still unknown, what is clear is this – endogenous DHEA-S synthesis is always better than exogenous dietary intake.  With increased endogenous synthesis of any hormone, that synthesis is net of any “feedback inhibition effect” on endogenous production of the hormone.  With exogenous administration, there always can be a “feedback inhibition effect” which results in decreased endogenous production of a hormone.  For this reason, meditation may be a “superior way to get your DHEA“.

References:

Toward a Unified Field of Study: Longevity, Regeneration, and Protection of Health through Meditation and Related Practices

1992 Elevated serum dehydroepiandrosterone sulfate levels in practitioners of theTranscendental Meditation (TM) and TM-Sidhi programs

1998 The effect of six months treatment with a 100 mg daily dose of dehydroepiandrosterone (DHEA) on circulating sex steroids, body composition and muscle strength in age-advanced men and women

  1. Meditation increases the size of the brain

Grey matter and white matter both increase in specific areas, including right orbitofrontal cortex, middle frontal cortex, superior frontal cortex, right insula, funds of the central sulcus, right middle and frontal sulci, left superior temporal gyrus, and left inferior temporal gyrus.

Summary:  Specific areas of the brain increase with meditation. Both white matter and grey matter volume change with regular meditation and prevent the age-related decline in brain volume!

This was one of the most shocking thing I have ever read.  The evidence is recent.- just in the past 10 years since 3D MRI and Diffusion Tensor Imaging (DTI) have been developed. The research has been done at MIT, Massachusetts General Hospital, Harvard University, Duke University, Florida State University, UCLA, and many other institutions.  There is not one “select type of Mediation” that is better at this than the rest.  Meditation techniques from Buddhist meditation (Zazen, Samantha, and Vipassana) and Hindu yoga/meditation techniques such as asanas yoga (position) and pranayama yoga (breathing meditation) all seem to work.  Meditation changes cortical volume (grey matter) and subcortical volume (white matter) in individuals who meditated on a regular basis – affecting only specific regions of the brain.  Most participants in the MRI studies had meditated for an average of 8-9 years for 40 minutes/day to as much as 2 hours per day.

This evidence is objective and cannot be debated or dismissed!  It was statistically significant with p = 0.00001 in some cases! This is the strongest kind of scientific evidence – you cannot alter this like you can with answers on a questionnaire!  The enlargement of the brain was not diffuse – it was very specific in location.  It was also specific to the side of the brain.  Here are the locations where the brain gets bigger (note where it enlarged preferentially on one side)

– Right OFC – the grey matter of the right Orbitofrontal cortex (OFC) which is involved with emotional control gets larger!  This region seemed to be the most consistently enlarged in all of the studies, although there were some exceptions.  This was measured with MRI, functional MRI, SPECT scans, and PET scans.

– MFC & SFC –  the grey matter of the middle and superior frontal cortex (MFC and SFC) enlarged –

– Right Insula – The grey matter in a large area of the right insula enlarged – this is Broadman’s area 9.  It is activated by tasks of interoceptive awareness.  The observations of bodily sensations during meditation may be why this area enlarged in meditators

– Fundus of central sulcus – The grey matter in the fundus of the central sulcus was also enlarged – this is Broadman’s area 3a

– Right Middle and Frontal sulci – The grey matter the right middle and frontal sulci enlarged – this is Broadman’s area 10.   p = 0.002

– Left Superior temporal gyrus – The grey matter in the left superior temporal gyrus enlarged – this is the auditory cortex

– Left inferior temporal gyrus – This area not only enlarged, but the enlargement correlated with the number of years that the meditator had been doing meditation. The left temporal lobe has been connected with spiritual activity and mysticism in many EEG studies and functional MRIs. This is the region where “deep pleasure” is felt and the experience of insight into the “unity of all reality.”

– Right Hippocampal gyrus – The hippocampus enlarged in one study – obviously this would be great for short term memory (see Reference below).  The reason why they thought that the hippocampus enlarged with meditation was due to its role in modulating amydalar activity and thus its role in attention and emotional activity

– Putamen – one study found that the area with the greatest change in grey matter volume was the putamen.  The putamen is very important in processing attention and may help with attention deficit disorders (ADHD)

What was even more notable was that in control brains (those that did not meditate), the brains underwent normal, age-related decline in volume!  (p = 0.001).  This should be enough evidence for everyone that meditation works.

Here are the References:

2012 The effect of meditation on brain structure: cortical thickness mapping and diffusion tensor imaging

2006 Meditation experience is associated with increased cortical thickness

2012 Yoga Meditation Practitioners Exhibit Greater Gray Matter Volume and Fewer Reported Cognitive Failures: Results of a Preliminary Voxel-Based Morphometric Analysis

2009 The underlying anatomical correlates of long-term meditation: Larger hippocampal and frontal volumes of gray matter

2013 Cortical thickness, mental absorption and meditative practice: Possible implications for disorders of attention

2013 Meditation effects within the hippocampal complex revealed by voxel-based morphometry and cytoarchitectonic probabilistic mapping

2007 Age effects on gray matter volume and attentional performance in Zenmeditation

2008 Investigation of mindfulness meditation practitioners with voxel-based morphometry

2009 The underlying anatomical correlates of long-term meditation: Larger hippocampal and frontal volumes of gray matter

2012 The Unique Brain Anatomy of Meditation Practitioners: Alterations in Cortical Gyrification

2013 Increased gray matter volume in the right angular and posterior parahippocampal gyri in loving-kindness meditators

2008 “Thinking about Not-Thinking”: Neural Correlates of Conceptual Processing during Zen Meditation

  1. Meditation increases Activity in the Brain’s “Attention Center

Increased brain activity is seen in the areas of the brain involving attention regulation with meditation – the dorsolateral prefrontal cortex (DLPFC) and the anterior cingulate cortex (ACC).

Recently, functional MRIs (fMRI) have been developed that can actually measure brain activity during meditation. These studies have shown that metabolic activity in the two regions involving attentiveness is increased with meditation.  These two areas are located on the outside of the front of the brain (called the “Dorsolateral prefrontal cortex” (DLPFC)and the “anterior cingulate cortex” (ACC).  These two regions are involved with attention during the day, and with organizing thoughts.  At night, the DLPFC is busy with dreaming, specifically “lucid dreams”, which are associated with REM sleep.  Expert meditators with many hours of meditation experience (> 19,000 hours) had more activation of these areas invoking attention.  These regions of the brain are located in the illustrations and the picture below:

Image may be NSFW.
Clik here to view.
Med6

Illustration Reference: 2012  The Dorso-lateral Prefrontal-Cortex and Lucid Dreaming

Image may be NSFW.
Clik here to view.
Med7

Illustration Reference:   2014 How meditation helps with “emotional sobriety”!


Image may be NSFW.
Clik here to view.
Med8

Photo Reference: 2008 Extract from The Secret Life of the Brain

References:

2010 Regional Brain Activation during Meditation Shows Time and Practice Effects: An Exploratory FMRI Study

2007 Neural correlates of attentional expertise in long-term meditation practitioners

2000 Functional brain mapping of the relaxation response and meditation

  1. Meditation Deactivates (decreases activity) in the Brain’s “Daydreaming Center”, also known as the “Default Mode Network”

In the posterior cingulate cortex and the medial prefrontal cortex areas, meditation decreased the activity of the brain, reducing mind wandering and daydreaming.  This occurred during mediation and after meditation.

Researchers at Yale have recently shown with the same functional MRI technique that there are areas in the brain that account for mind wandering and daydreaming.  These activities are not helpful to getting things done and are a great distractor from concentrating on the “task at hand”.   At Harvard, some other researchers showed that subjects daydreamed during nearly 50% of their waking hours.  This made them unhappy and led them to create the catch phrase, “A Wandering Mind is an Unhappy Mind”.  To date, meditation is the only thing that has really been shown to reduce mind wandering.  Here are some pictures of how much the activity is decreased with meditation in these two regions:

– posterior Cingulate Cortex (PCC) –

– medial prefrontal cortex (mPFC)

Image may be NSFW.
Clik here to view.
Med9

llustration Reference:  2012 The Healing Art of Meditation

References:

2011 Meditation experience is associated with differences in default mode network activity and connectivity

2007 Differential engagement of anterior cingulate and adjacent medial frontal cortex in adept meditators and non-meditator

2006  Dissociating medial frontal and posterior cingulate activity during self-reflection

  1. Breathing rate with meditation determines the size change of a very specific area under the occipitotemporal lobe.  Breathing rate decreases with increasing experience of the meditator

– the inferior occipito-temporal visual cortex changes in size based in the meditation breathing rate.  

– The meditation breathing rate is a function of how many years a person has been meditating.   This relationship is measurable and objective!

All this scientific, objective evidence has been recent – the past 10 years.  What several studies have shown is that if you measure the breathing rate of the subject (meditator) before he/she starts meditating,  then measure the person’sr breathing rate in the middle of meditating, then subtract the two, you come up with a “∆ RR”, or the change in respiratory rate with meditation.  What the researchers found out was that the experienced meditators had greater “∆ RR” than the  inexperienced meditators.  Once this was discovered, this was used as a “gauge” of mediation experience and to rule out people who were not really meditating.

Instead of just questioning a long term meditator about their meditation frequency, studies have shown that the breathing rate of meditators during meditation is a more sensitive predictor of actually how long meditators have actually been meditating (in other words, many people say they meditate regularly, but really don’t do so).  In long-term meditators who actually do the meditation, their breathing rate is lower during the time they are meditating.  This is NOT “fakable”.  For this reason, Harvard and MIT researchers used the breathing rate of long term meditators to make the following graph and brain image:

Here is what they found – the left inferior occipitotemporal lobe region increased in size and correlated with the “∆ RR

Image may be NSFW.
Clik here to view.
Med10

Picture/graph Reference:  2005 Meditation experience is associated with increased cortical thickness

Conclusion:  The scientific evidence is clear – the longer you have been meditating (in years), the greater the change in breathing rate occurs with meditation.  The greater the breathing rate changes, the thicker the brain cortex gets in the left inferior occipitotemporal lobe region of the brain. Thus it appears that the change in the thickness of the left inferior occipitotemporal lobe region is a direct measurement of breathing rate during meditation.

  1. Meditation can reduce Chronic Pain

4 days of meditation decreased pain unpleasantness by 57% and pain intensity ratings by 40%.  This effect is probably mediated by increased activity in the anterior cingulate cortex (ACC), anterior insula, and a decreased activity in the thalmus and activation of the orbitofrontal cortex.  This was accomplished without drugs and the benefits extended past the period of meditation.

Researchers at Wake Forest University showed that meditation can also reduce pain. They had subjects with chronic pain voluntarily enroll for a multi day course on mindfulness meditation.  After only 4 days of meditation, their pain had dramatically reduced in intensity.  This included a 57% drop in pain unpleasantness and a 40% drop in pain intensity.  This was calculated to be not due to chance.  Functional MRIs showed changes in brain activity as explained above

– increase in activity in the anterior cingulate cortex

– increase in activity in the anterior insula

– decreased activity in the thalamus

– increased activity in the orbitofrontal cortex

Other studies have shown reductions in chronic pain with 10 weeks of mindful meditation.  At 10 weeks, 65% of patients showed a reduction of > 33% of mean total rating of pain and 50% of participants showed a reduction of > 50% in mean total rating of pain.  Another study showed that meditation can reduce low back pain.  This was a randomized study.  Another study showed that brief mindfulness meditation training reduced experimental pain and that the echanism of action was via the reduction in anxiety (this may be why Valium reduces pain)

One of the most interesting studies was done in a Yoga master who claimed to not feel pain while meditating.  In this Yoga Master, MEG and functional MRI studies showed the following:

– on Magnetoencephalography (MEG), pain-related cortical activity on the primary and secondary somatosensory cortices were weak or absent

– on functional MRI, there was a reduced activity during meditation in the thalamus, the insula, and the cingulate cortex

Meditation has even been shown to reduce pain in fibromyalgia in 51% of patients treated with meditation.  Thus, meditation is a scientifically validated method for the self regulation of chronic pain and the specific regions of the brain that meditation regulates chronic pain is well established.

Here is a graph showing the pain rating scale before and after meditation:

Image may be NSFW.
Clik here to view.
Med11

Reference:  Chronic Pain And The Role Of Mindfulness Meditation

Here is a summary of the effects of meditation on pain, from the scientific journal, Nature

Image may be NSFW.
Clik here to view.
Med12

Table reference:  2014 Neuromodulatory treatments for chronic pain: efficacy and mechanisms

Here is a table comparing four non-drug methods for controlling pain:

  1. Hypnosis
  2. Meditation
  3. Transcrainial magnetic stimulation
  4. Neurofeedback
Treatment Advantages Disadvantages
Hypnosis Moderate evidence supports short-term and long-term efficacy
Encourages self-management and self-efficacy
Few (if any) negative side effects
Numerous beneficial side effects (for example, increased global well-being)
Evidence supports effects on most neurophysiological processes involved in pain processing—supports potential benefits for a wide variety of pain problems
Outcome is variable: not everyone benefits
Treatment requires patient involvement and motivation
Meditation Preliminary evidence is promising
Encourages self-management and self-efficacy
Few (if any) negative side effects
Reported beneficial side effects include increased well-being
Preliminary evidence supports effects on brain structures involved in attention, emotional processing and pain
Evidence for efficacy not yet well-established
Treatment requires patient involvement and motivation
fMRI and EEG studies examining the neural correlates of meditation training among novices with chronic pain is lacking
Noninvasive brain stimulation (repetitive transcranial magnetic stimulation and transcranial direct current stimulation) Preliminary evidence for short-term effects is promising
Treatment requires minimal patient effort
Requires equipment
Must be provided in the clinic (home practice not yet possible)
Passive treatment (does not encourage self-efficacy)
Evidence for long-term benefits is lacking; preliminary evidence suggests that benefits may be temporary
Associated with minor transitory side effects (for example, fatigue, scalp irritation, dizziness)
Mechanisms not yet understood
Neurofeedback (EEG and real-time functional MRI biofeedback) Preliminary evidence for short-term benefits is promising
Encourages self-management and self-efficacy
Requires equipment
Effects appear to be weak
Evidence for long-term benefits is lacking
Mechanisms not yet understood
Treatment requires patient involvement and motivation

Table reference:  2914 Table 2: Neuromodulatory chronic pain treatments: advantages and disadvantages

Summary: The effects of meditation in reducing pain is undeniable and scientifically irrefutable.  It works!

References:

2011 Brain Mechanisms Supporting the Modulation of Pain by Mindfulness Meditation

2012 Mindfulness meditation-related pain relief: Evidence for unique brain mechanisms in the regulation of pain

1982 An outpatient program in behavioral medicine for chronic pain patients based on the practice of mindfulness meditation: Theoretical considerations and preliminary results

1985 The clinical use of mindfulness meditation for the self-regulation of chronic pain

2008 “I Felt Like a New Person.” The Effects of Mindfulness Meditation on Older Adults With Chronic Pain: Qualitative Narrative Analysis of Diary Entries

2008 Mindfulness meditation for the treatment of chronic low back pain in older adults: A randomized controlled pilot study

2010 The Effects of Brief Mindfulness Meditation Training on Experimentally Induced Pain

1987 Four-Year Follow-Up of a Meditation-Based Program for the Self-Regulation of Chronic Pain: Treatment Outcomes and Compliance

2010 Mindfulness-based stress reduction for chronic pain conditions: Variation in treatment outcomes and role of home meditation practice

Beautiful  Work: a Meditation on Pain (book extract)

2013 Loving-Kindness Meditation for Chronic Low Back Pain – Results From a Pilot Trial

2005 Intracerebral pain processing in a Yoga Master who claims not to feel pain during meditation

1993 The impact of a meditation-based stress reduction program on fibromyalgia

  1. Meditation can reduce anxiety

There is very strong evidence-based medicine that meditation reduces anxiety by activating the anterior cingulate cortex, activating the ventromedial prefrontal cortex, and activating the anterior insula.  Transcendental meditation is more effective than placebos, relaxation response therapy, EMG-biofeedback, mantra meditation, PMR, and other relaxation methods.  Meta-analysis of the data is robust.   Meditation reduces anxiety as effectively as exercise and can be done with “spirituality” or without “spirituality.”

Drugs are not the only way to treat anxiety.  Several studies have shown that meditation can make dramatic improvements on reducing anxiety.  Meditation can be taught and practiced with a “spiritual side” or without a “spiritual side” There is, however, some evidence that including the spiritual aspect of meditation makes meditation more effective in treating anxiety (see References).

Unfortunately, patients with high anxiety have a low frequency of compliance with mediating (i.e. they don’t do it).  This makes the efficacy of treating anxiety with meditation questionable

Another old study showed that aerobic exercise (70% of maximal activity) and meditation had an equal effect on reducing anxiety.  A recent randomized controlled trial of meditation for the treatment of anxiety showed a reduction in anxiety, a reduction in blood pressure, but no change in a self-reported depression rating scale.  On functional MRI, the following regions of the brain were affected:

– activation of the anterior cingulate cortex (ACC)

– activation of the ventromedial prefrontal cortex (vmPFC)

– activation of the anterior insole

Here is a graph of the effects of meditation on high anxiety and moderate anxiety from a recent meta-analysis:

Image may be NSFW.
Clik here to view.
Med13

Graph reference: Trait anxiety and Transcendental Meditation meta analysis

Here is a graph comparing the different types of meditation and stress reduction on treating anxiety (i.e. comparing efficacy)

Image may be NSFW.
Clik here to view.
Med14

Graph reference:  Why Meditate – The Benefits of Transcendental Meditation

Conclusion:  There is more literature on the effectiveness of meditation on reducing anxiety than any other category. This positive benefit of meditation on anxiety stood up in a meta-analysis of the data. Below are just a few of the many References on this topic.

The evidence is very strong – it works!

References:

1993 The impact of a meditation-based stress reduction program on fibromyalgia

20O

2005 Is Spirituality a Critical Ingredient of Meditation? Comparing the Effects of Spiritual Meditation, Secular Meditation, and Relaxation on Spiritual, Psychological, Cardiac, and Pain Outcomes

2007 Does mindfulness meditation improve anxiety and mood symptoms? A review of the controlled research

1985 Meditation and anxiety reduction: A literature review

2009 I think therefore i om: cognitive distortions and coping style as mediators for the effects of mindfulness meditation on anxiety, positive and negative affect, and hope

1979 Effects of Zen meditation on anxiety reduction and perceptual functioning

1995 Three-year follow-up and clinical implications of a mindfulness meditation-based stress reduction intervention in the treatment of anxiety disorders

2013 Neural correlates of mindfulness meditation-related anxiety relief

2003 Alterations in Brain and Immune Function Produced by Mindfulness Meditation

1978 Anxiety reduction following exercise and meditation

2013 A randomized controlled trial of the effects of brief mindfulness meditation on anxiety symptoms and systolic blood pressure in Chinese nursing students

2013 Effects of meditation on anxiety, depression, fatigue, and quality of life of women undergoing radiation therapy for breast cancer

1978 Anxiety reduction following exercise and meditation

2010 The effect of mindfulness-based therapy on anxiety and depression: A meta-analytic review

2014 Mindfulness Meditation Can Help Relieve Anxiety And Depression


  1. Meditation is an “Epigenetic Drug, changing gene expression

Meditation changes gene expression  of histone deacetylase genes (HDAC2, HDAC3, and HDAC9) in peripheral blood lymphocytes in meditators.  This alters global histone modification marks like H4 acetylation and H3K4 trimethylation.

Reference: 2014 Rapid changes in histone deacetylases and inflammatory gene expression in expert meditators

  1. Meditation can reduce stress in caregivers of those taking care of dementia patients and handicapped patents or children

The type of meditation used was Kirtan Kriya Meditation (KKM) vs listening to music for 12 minutes daily for 8 weeks.   The KKM reversed the dysregulation of NF-kB and IRF genes, whereas the music listening did not.

References:

2013 Yogic meditation reverses NF-κB and IRF-related transcriptome dynamics in leukocytes of family dementia caregivers in a randomized controlled trial

2004 A Pilot Study of a Yoga and Meditation Intervention for Dementia Caregiver Stress

  1. Meditation changes gene expression in peripheral blood lymphocytes

This has now been reported by several groups and is statistically significant.

Reference:  2013 Regulation of gene expression by yoga, meditation and related practices: A review of recent studies

  1. Meditation reduces Loneliness in elderly adults

This was a prospective, randomized controlled trial done at UCLA.  The list of genes was quite large and the change in expression was quite mild, however.

References:

2012 Mindfulness-Based Stress Reduction training reduces loneliness and pro-inflammatory gene expression in older adults: A small randomized controlled trial

2011 Intensive meditation training, immune cell telomerase activity, and psychological mediators

2009 Can meditation slow rate of cellular aging? Cognitive stress, mindfulness, and telomeres

2013 Effect of comprehensive lifestyle changes on telomerase activity and telomere length in men with biopsy-proven low-risk prostate cancer: 5-year follow-up of a descriptive pilot study

2013 Effect of comprehensive lifestyle changes on telomerase activity and telomere length in men with biopsy-proven low-risk prostate cancer: 5-year follow-up of a descriptive pilot study

2012 A pilot study of yogic meditation for family dementia caregivers with depressive symptoms: effects on mental health, cognition, and telomerase activity

2013 Loving-Kindness Meditation practice associated with longer telomeres in women

2012 A Randomized Controlled Trial of Qigong Exercise on Fatigue Symptoms, Functioning, and Telomerase Activity in Persons with Chronic Fatigue or Chronic Fatigue Syndrome

2012 Changes in stress, eating, and metabolic factors are related to changes in telomerase activity in a randomized mindfulness intervention pilot study

2014 A meta-analytic review of the effects of mindfulness meditation on telomerase activity

2005  Studies of chinese original quiet sitting by using functional magnetic resonance imaging

2004 Effects of Hatha yoga and Omkar meditation on cardiorespiratory performance, psychologic profile, and melatonin secretion

2000  Acute increases in night-time plasma melatonin levels following a period of meditation

1995 Meditation, melatonin and breast/prostate cancer: hypothesis and preliminary data

2008 Evaluation of potential pro-survival pathways regulated by melatonin in a murine senescence model

2008 The SIRT1 Deacetylase Suppresses Intestinal Tumorigenesis and Colon Cancer Growth

2008 The NAD+-Dependent Deacetylase SIRT1 Modulates CLOCK-Mediated Chromatin Remodeling and Circadian Control

2007 Forced and Non-forced Chinese Meditation Studies

2000 Acute increases in night-time plasma melatonin levels following a period of meditation

2004 The effects of long meditation on plasma melatonin and blood serotonin

Toward a Unified Field of Study: Longevity, Regeneration, and Protection of Health through Meditation and Related Practices

Final  comments – by Vince Giuliano

How does meditation work?

What molecular mechanisms are at work to produce the impressive list of beneficial impacts outlined above?  We will probably generate another blog entry on that topic soon, or possibly a series of blog entries.  As a teaser consider this image:

Image may be NSFW.
Clik here to view.
Med15

Image source: Meditation as a therapeutic intervention for adults at risk for Alzheimer’s disease – potential benefits and underlying mechanisms: Figure 1. Possible pathways by which meditation may improve health outcomes in adults with cognitive impairment

We see in the diagram a number of themes touched on in this blog entry, including the impacts of meditation on reducing inflammation, reducing perceived stress, improving metabolic parameters, upgrading telomerase activity and reducing risk of cognitive decline.

Moreover, the aforementioned article emphasizes the importance of minimizing constitutional stress.  “Chronic stress can contribute to a vicious cycle that may not only have deleterious effects on health and cognitive function (32), but ultimately increase risk for institutionalization (29, 30).

The chronic stress that often characterizes the lives of those with cognitive impairment, as well as their caregivers, has been linked to adverse changes in sleep (30), mood (33, 34), and immunological function (33, 35), and elevated risk for metabolic syndrome, cardiovascular disease (CVD), and mortality (36, 37). Chronic psychological stress can have profound effects on memory and behavior in persons both with and without cognitive impairment, and has been prospectively linked to increased risk for incident MCI and dementia in older adults, and to accelerated cognitive decline (3840). Chronic stress leads to deleterious neuroendocrine and associated inflammatory changes, to suppression of IGF-1 and other neuroprotective factors, and to impaired synaptic plasticity, suppressed neurogenesis, reduced neuronal survival, and other adverse morphological and functional changes in the hippocampus, prefrontal cortex, and other brain structures; all these changes can profoundly affect mood, sleep, memory, and learning (4145). A large body of experimental, clinical, and epidemiological research has also implicated chronic stress and associated sympathoadrenal activation in the etiology of hypertension, obesity, dyslipidemia, and other components of the metabolic syndrome, and in the development and progression of CVD, type 2 diabetes, depression, and related chronic disorders (41, 46). These disorders have, in turn, been shown to predict cognitive dysfunction, and to increase risk for the development and progression of AD (4754). Autonomic and hypothalamic pituitary adrenal (HPA) axis dysfunction has also been linked directly to cognitive decline, and to adverse changes in brain structure and function. For example, HPA axis activation, manifested by elevated cortisol levels, has been associated with hippocampal volume loss and memory impairment in non-demented elders (41, 55). As noted above, depression and other mood disorders are common in those with and at risk for AD, including adults with MCI and SCI (12, 13, 28, 56). Depressive symptoms and other distressful states have also been linked to significantly increased risk for diabetes, CVD, stroke, and the metabolic syndrome (5759), and are a significant contributor to the profound reductions in quality of life reported by those with cognitive impairment (12, 31). Anxiety and depressive symptoms are also significant predictors of cognitive decline and incident cognitive impairment (60, 61). Moreover, in those with MCI, behavioral and psychological symptoms, including anxiety, depression, irritability, and apathy, are strong predictors of progression to AD (28, 62). In addition, mood disturbance can contribute not only to impairment of memory, but also to sleep disturbance, HPA axis dysregulation, and autonomic dysfunction and related pro-inflammatory changes, thus helping to promote a vicious cycle of adverse physiologic, neuroendocrine, and psychosocial changes that foster the development and progression of AD, CVD, and related chronic conditions (41, 63, 64).”

From the 2009 publication Can meditation slow rate of cellular aging? Cognitive stress, mindfulness, and telomeres: Meditation and Stress arousal: “In addition to mitigating stress-related cognitions and emotions, some types of meditation appear to reduce markers of stress arousal, both through the HPA axis, increasing vagal tone, and reducing markers of sympathetic arousal. Transcendental meditation (TM), a concentrative technique that uses silent repetition of a word or phrase as the object of awareness, has been the most extensively studied meditative technique. It appears to reduce systolic and diastolic blood pressure to levels comparable to pharmacologic treatment 116 and improves heart rate variability compared to an active control group.117 It also appears to lower basal cortisol and lead to greater cortisol peaks in response to an acute stressor,118120 a profile that might be described as enhanced allostasis.38121 TM and a similar type of concentrative meditation (the relaxation response technique) are also characterized by decreased oxygen consumption,122123 carbon dioxide elimination,124125 and salutary EEG patterns (theta and alpha activation).126 — Little research has evaluated specifically the effects of mindfulness meditation on HPA axis arousal or autonomic activity127 although similar effects as those found with transcendental meditation and the relaxation response could be predicted to occur. In one uncontrolled MBSR intervention study, cancer patients consistently showed decreased daily average cortisol values after one year of follow-up .128In a second study, lower cortisol responses to mental stress were observed after five days of practicing an integrated mind-body meditation approach incorporating mindfulness compared to a randomized relaxation control group.129 However, one caveat is that mindfulness includes acknowledgement of distressing thoughts and feelings, which may initially increase arousal and emotional activity, but viewed as a developmental process, may progressively lead to decreased reactivity through enhanced awareness, tolerance of discomfort, and acceptance. Thus, for beginners, and periodically for experienced practitioners, mindfulness meditation is expected to produce increases in physiologic arousal.130.

— Several randomized controlled trials have demonstrated the effectiveness of CBSM  (Cognitive Behavioral Stress Management) on reducing peripheral stress arousal. CBSM training reduced urinary free cortisol and epinephrine in clinical samples.131132 In one study of healthy participants, CBSM led to lower cortisol reactivity in response to a standardized laboratory stressor within 2 weeks104 and, to a lesser extent, four months after the intervention.133 To the extent that mindfulness or other forms of meditation promote the ability to buffer oneself from social evaluative threat — recognizing that negative social judgments or reflected appraisals of the self (what one thinks others think about oneself) do not necessarily represent reality or a threat to one’s self-worth, practitioners should indeed become less stress reactive.

— Although concentrative and mindfulness meditation techniques may reduce HPA axis and autonomic arousal, the brain appears to respond to specific types of meditation in ways that may represent an adaptive attentional state to appraise stimuli. An fMRI study of meditation practitioners (who practiced Kundalini meditation in which focused attention on respiration is linked to silent repetition of a phrase found increased activation of localized neural structures involved in attention (frontal and parietal cortex) and control of the autonomic nervous system (pregenual anterior cingulate, amygdala, midbrain, and hypothalamus) compared to a control nonmeditative condition.134These data suggest that as some meditation practices produce deep physical relaxation evidenced by reductions in autonomic and HPA arousal, these practitioners were engaged in an active attentional state of autonomic control, countering the notion that meditation is a state of mental as well as physical relaxation. –

Further evidence suggests that meditation effects are not simply the result of volitionally reduced peripheral arousal. Results of a study comparing neural correlates of mindfulness meditation and respiratory biofeedback found that while some regions are engaged by both tasks, mindfulness meditation activates additional neural regions (e.g., right anterior insula).135 Thus, while some forms of meditation engage attentional resources to induce a hypometablic state beneficial for managing stress-related arousal, they also appear to modulate cognitive and emotional processes involved in the appraisal of stress, such as interoception.”

Aging is highly programmed all the way from conception to death, where the program finally kills every one of us one way or the other.  Various interventions can tweak the program one way or the other.  A very large number of these can kill us sooner.  A precious few can keep us going healthily longer, and meditation appears to be one of those.  So, if you are older and want to keep going healthily and happily, you might want to try it.

G-qaudruplexes

By James P Watson with editorial help and selected contributions by Vince Giuliano
Image may be NSFW.
Clik here to view.
G-quad1=01
Image source Human telomeric G-quadruplex structure

 Introduction by Vince Giuliano

If you are new to G-quadraplexes, I can appreciate reader resistance to confronting the intellectual challenge of understanding an unfamiliar group of entities.  Speaking personally, I am ceaselessly seeking to expand my limited understanding of important topics key to aging like epigenetics, histone biology, the roles of various non-coding RNA species, DNA methylation, sense and antisense strands, multiple promoter sites, what is already known about telomere and centromere biology, protein folding, NAD-related pathways, etc. etc.    Given how much there is yet to learn about such important areas, can adding understanding of G-quadraplexes be so important as to be worthwhile?   The answer is “yes.”  That is why we are publishing this blog.

G-quadruplexes are secondary semi-stable folded structures found in our DNA and RNA which tend to assemble around guanine-rich sequences in the presence of cation molecules like potassium.  Heat can affect their coming and going, and their presence near promoter elements can block gene activation. Although first observed in the 19th century, their structures were not identified until in the 1960s and their presence and fuller relevance in the human genome only clarified in the last few years.  We now know those structures are very relevant to many critical biological processes like gene regulation, expression of telomerase and telomere maintenance, understanding of growth/oncogenes like C-myc, understanding of organismic development, comprehension of certain enigmatic diseases like ALS and possible new cancer treatments.   Many critical aging-related processes like the telomere/telomerase story can’t be fully told without considering G-quadruplexes.  The formation (folding) of DNA G-quadruplexes and the unfolding of G-quadruplex structures to allow telomerease to work is highly evolved.  And, G-quadruplex formation on single stranded DNA is one of the ways that the telomeric DNA is protected from oxidative stress and from triggering the DNA-damage response (DDR), which causes cellular senescence. In an important model of premature aging, Werner’s Syndrome, the genetic problem seems to be lack of a helicase protein that can unwind G-quadruplexes. G-quadraplexes play key roles in a number of other diseases like ALS, Fragile X syndrome, Fanconi’s anemia and Friedrich’s ataxia. Certain G-quadraplexes appear to be evolutionarily conserved across mammalian species, suggesting they play common critical roles. And the stories of what these strange origami structures do to us and for us are still being written.

Introduction

Like in many areas of science, the prevailing dogma is often disrupted by emerging evidence which either shows that the theory was completely wrong or that there were exceptions to the rule.   This essay is a perfect example of what could be described as an exception to what has been a fundamental “dogma” of genetics; or it could describe a new paradigm that requires the old view to be at least modified.

  • The “prevailing dogma” here is that guanine nucleotides only form base pairs with cytosine nucleotides.  These make up some of the rungs on the famous Watson/Crick double helix structure of DNA
  • The new paradigm or exception to this rule is that multiple guanine nucleotides also spontaneously form a “tetraplex” with a positively charged cation, such as potassium, forming what is referred to as a “Guanine Qaudruplex”, or “G-quadruplex” for short.

The familiar Double Helix, the Watson-Crick configuration, looks like this:

Image may be NSFW.
Clik here to view.
G-quadaa

Image source

The red-blue rungs are the guanine-cytosine base pairs.  Think this is what all or even most DNA looks like?  Think again.  G-quadraplexes can exist in a variety of topologies that mess up this pretty picture.  A G-quadraplex in our DNA could look like these:

Image may be NSFW.
Clik here to view.
G-quada
Image may be NSFW.
Clik here to view.
G-quadB
 
Image source 

Image may be NSFW.
Clik here to view.
G-quadC
  Image source

So, you can see how considering G-complexes make DNA look a lot more complicated.  Actually, the situation is even more complicated since G-quadraplexes are only one of several types of quadraplex structures, albeit the best-understood type.  There are also triplex, tetraplex, i-motif, minor groove quadruplexes,  etc.

“These unusual DNA structures play critical roles in regulation of very basic biological functions and are integral part of the complex regulatory systems of living beings. The negative supercoiling of DNA can induce sequence-dependent conformational changes that give rise to local DNA structures and alternative DNA conformations such as cruciforms, A-DNA, left-handed DNA (Z-DNA), triplexes, four-stranded DNA (quadruplexes) and others [2,3](ref)”  But we don’t really get into most of those other types here.

It is hard to consider G-quadraplex structures as “exceptions to the rule”, since at one or more phases of a mitotic cell’s life cycle, as many as 376,000 of these structures could occur (That is a lot of exceptions to the rule).  Moreover, the word “exception” hardly fits here, since these 3-D structures are part of normal molecular biology of both DNA and RNA, and play a key role in the molecular pathogenesis of disease.

Even historically, it has long been known that there was an important alternative to the Watson-Crick model of base pairing, known as Hoogsteen base pairing(ref)(ref) which is the biochemical form of hydrogen bonding involved with G-quadraplexes.

Are G-quadruplexes important?  The short answer is YES!  They play a key role in telomere stability, telomere length maintenance, hTERT gene expression, oncogene promoter activity, estrogen receptor expression, and many other molecular processes within the cell.   In disease, they appear to play key roles in Amyotrophic Lateral Sclerosis, Cancer, and aging.  Is that important enough?  You bet your G-quadruplexes it is!  Here is a recapitulation on what G-quadruplexes are and what they do.

  1. G-quadruplexes are an alternative way that DNA and RNA can fold.

The self-association of guanosine bases was first observed in the late 19th century (Ref).  In this sense, the spontaneous association of guanosine bases may have been the first “nanotechnology” experiment done. However, the tetrameric arrangement of guanine bases was not determined by X-ray crystallography until 1962, when Gellert, Lipsett, and Davies demonstrated helix formation by guanylic acid (Ref).

The first to show that G-quadruplexes actually occurred in human DNA was Wang and Patel at Columbia University in 1993 (Ref).  They showed that the single strand of telomeric DNA that overhangs on the ends of eukaryotic chromosomes form a G-quadruplex.  Their study was an artificial DNA solution of the telomere sequence (TTAGGG), formed a “3-stack” of G-quadruplexes at the ends of the telomere (see more about this below under Section 5 on telomeres).

Whereas Guanine normally pairs with cytosine to form one “rung” of the double helix, 4 Guanines can form salt bridges with a metal cation (most commonly potassium) to form a “G-Tetrad”.  The bonds between the 4 guanines are called “Hoogsteen base paring“. The cation in the middle and the Hoogsteen base paring are the fundamental features of a  a “G-quadruplex”. Here is a diagram comparing a G-C base pair to a G-Tetrad:

 Image may be NSFW.
Clik here to view.
G-quad1

Reference:  Recognition of Guanine-Rich DNA and RNA by Homologous PNA

  1. G-quadruplexes are formed from 3 loops of one strand of DNA that is rich in Guanines (Gs).

G-quadruplexes can also form from 2 strands (bimolecular) or 4 strands (tetra molecular) of DNA.

Stabilized by a monovalent (single charged) metal cation, 3 loops of DNA can form a “stack” of G-quadruplexes.  The more “stacks” there are in a G-quadruplex, the more stable it becomes.  Usually G-quadruplexes with only 1 or 2 stacks are not stable enough to maintain their structure, whereas G-quadruplexes with 3 or more stacks are usually stable.  The exceptions to this are the “2-stacks” seen with the thrombin-binding aptamer and fragile X syndrome.   Here is an illustration of a stack of 3 G-quadruplexes made from one strand of G-rich DNA:

Image may be NSFW.
Clik here to view.
G-quad2

Image source

G-quadraplexes can adopt a variety of geometric configurations depending on where they are found

A good reference on this is the 2007 document Human telomere, oncogenic promoter and 5′-UTR G-quadruplexes: diverse higher order DNA and RNA targets for cancer therapeutics

“DNA can adopt structures other than the Watson–Crick duplex when actively participating in replication, transcription, recombination and damage repair. Of particular interest are guanine-rich regions, which can adopt a non-canonical four-stranded topology called the G-quadruplex. Such architectures are adopted in several key biological contexts, including DNA telomere ends, the purine-rich DNA strands of oncogenic promoter elements, and within RNA 5′-untranslated regions (UTR) in close proximity to translation start sites. Therefore, elucidation of the sequence-based diversity of G-quadruplex scaffolds could provide insights into the distinct biology of guanine-rich sequences within the genome.”

Here is how G-quadruplexes can be formed from 1 strand of DNA, 2 strands of DNA, or 4 strands of DNA:

 Image may be NSFW.
Clik here to view.
G-quad3

Reference: Image source DNA and RNA Quadruplex-Binding Proteins

” Four-stranded DNA structures were structurally characterized in vitro by NMR, X-ray and Circular Dichroism spectroscopy in detail. Among the different types of quadruplexes (i-Motifs, minor groove quadruplexes, G-quadruplexes, etc.), the best described are G-quadruplexes which are featured by Hoogsteen base-paring. Sequences with the potential to form quadruplexes are widely present in genome of all organisms. They are found often in repetitive sequences such as telomeric ones, and also in promoter regions and 5′ non-coding sequences. Recently, many proteins with binding affinity to G-quadruplexes have been identified. One of the initially portrayed G-rich regions, the human telomeric sequence (TTAGGG)n, is recognized by many proteins which can modulate telomerase activity. Sequences with the potential to form G-quadruplexes are often located in promoter regions of various oncogenes. The NHE III1 region of the c-MYC promoter has been shown to interact with nucleolin protein as well as other G-quadruplex-binding proteins. A number of G-rich sequences are also present in promoter region of estrogen receptor alpha. In addition to DNA quadruplexes, RNA quadruplexes, which are critical in translational regulation, have also been predicted and observed. For example, the RNA quadruplex formation in telomere-repeat-containing RNA is involved in interaction with TRF2 (telomere repeat binding factor 2) and plays key role in telomere regulation. All these fundamental examples suggest the importance of quadruplex structures in cell processes and their understanding may provide better insight into aging and disease development.”

  1. Using prediction computer software, 376,000 putative G-quadruplex DNA structures may be present in the human genome. Common sites include promoters of oncogenes and telomeric DNA.  Many non-oncogene promoters also form G-quadruplexes. RNA also forms G-quadruplexes.

Using antibodies that only bind to G-quadruplexes of DNA, these structures have been conclusively shown to exist in human DNA.  Here is a fluorescent antibody stain of human osteosarcoma cancer cells which shows the presence of G-quadruplexes:

Image may be NSFW.
Clik here to view.
G-quad4

Image source: 2012 Visualization of DNA G-quadruplex structures in nuclei of human cancer cells

Now since the human genome has been sequenced many times, there are many methods of using software to predict “putative G-quadruplex sequences” (PQS) in the human genome.  Using these software tools, Huppert and Balsubramanian at Cambridge University have created a computer program called “quadparser” that uses models of the human DNA sequence.

In 2005, they estimated that as many as 376,000 putative G-quadruplex sequences (PQS) could exist in the human genome. Besides the single stranded DNA overhang of telomeric DNA, the other site where G-quadruplexes show up in the human genome is in promoter regions of oncogenes. For instance, the promoter region for the c-MYC oncogene has G-quadruplexes in it.  This may be one of the reasons why c-MYC over-expression is so prevalent in cancer. 

Reference:  2005 Prevalence of quadruplexes in the human genome

“Guanine-rich DNA sequences of a particular form have the ability to fold into four-stranded structures called G-quadruplexes. In this paper, we present a working rule to predict which primary sequences can form this structure, and describe a search algorithm to identify such sequences in genomic DNA. We count the number of quadruplexes found in the human genome and compare that with the figure predicted by modelling DNA as a Bernoulli stream or as a Markov chain, using windows of various sizes. We demonstrate that the distribution of loop lengths is significantly different from what would be expected in a random case, providing an indication of the number of potentially relevant quadruplex-forming sequences. In particular, we show that there is a significant repression of quadruplexes in the coding strand of exonic regions, which suggests that quadruplex-forming patterns are disfavoured in sequences that will form RNA.”

  1. Many G-quadruplex binding proteins have been found that facilitate G-quadruplex formation or G-quadruplex resolution (de-formation). 

These includes proteins found in the telomere region and promoter regions of DNA, as well as proteins involved with RNA quadruplex  formation, and quadruplex-resolving proteins which are called “Helicases“.  Here is a list of all of the proteins so far that have been found io be involved with G-quadruplexes in DNA and RNA:

Image may be NSFW.
Clik here to view.
G-quad5

Reference: 2014 DNA and RNA Quadruplex-Binding Proteins

Helicase proteins serve selectively to unwind G-quadraplexes, and when important helicase proteins are missing or mutated, serious diseases can ensue.

Helicase proteins act as unzippers, to separate intertwined strands of DNA into single strands for such purposes as to allow transcription, replication and recombination.  A helicase travels along the DNA in order to unzip it as illustrated here.

Image may be NSFW.
Clik here to view.
G-quadd

Image source

G-quadraplexes tend to block many common DNA transactions, again ones such as transcription, replication and recombination. Helicases also unwind G-quadraplexes and often come into play to allow such transactions.  Being the major means for doing so, they are discussed throughout this blog entry.  For example see Items 8a and 10 below which show how important helicases can be.  There is even a mitochondrial “twinkle” helicase for unfolding G-quadraplexes in mitochondrial DNA.  See Item 11 below

  1. Telomeres are rich in guanines and the single stranded 3′-overhang of DNA forms a DNA G-quadruplex.  RNA copies of telomere repeats (i.e. the long noncoding RNA called TERRA) has been shown to form a RNA G-quadruplex.

However, telomeres are not the most common location of G-quadruplexes(82.4%)

5a. Human telomeres contain DNA G-quadruplexes:

Telomeres are made of hexanucleotide repeats with the following sequence in humans: TTAGGG.   This means that they are rich in Guanines and therefore form G-quadruplexes.  This has been confirmed by many experiments involving specific antibodies and quadruplex binding proteins.

References:

 2009 Arrangements of human telomere DNA quadruplex in physiologically relevant K+solutions

2013 Quantitative Visualization of DNA G-quadruplex Structures in Human Cells

“Four-stranded G-quadruplex nucleic acid structures have been of great interest as their high thermodynamic stability under near-physiological conditions suggests that they could form in cells. Here, we report the generation and application of an engineered, structure-specific antibody that was employed to visualize quantitatively DNA G-quadruplex structures in human cells. We explicitly show that G-quadruplex formation in DNA is modulated during cell cycle progression and that endogenous G-quadruplex DNA structures can be stabilized by a small molecule ligand. Together these findings provide substantive evidence for the formation of G-quadruplex structures in the genome of mammalian cells and corroborate the application of stabilizing ligands in a cellular context to target G-quadruplexes and intervene with their function.”

References:

1993 Solution structure of the human telomeric repeat d[AG3(T2AG3)3] G-tetraplex

2009 Selective Recognition of a DNA G-Quadruplex by an Engineered Antibody

2004  Detection of Quadruplex DNA Structures in Human Telomeres by a Fluorescent Carbazole Derivative

2014  Stability of human telomere quadruplexes at high DNA concentrations

2006 Telomerase inhibition with a novel G-quadruplex-interactive agent, telomestatin: in vitro and in vivostudies in acute leukemia

Here is an illustration of the G-quadruplex that forms in human telomeres:

Image may be NSFW.
Clik here to view.
G-quad6

Illustration reference:   2007 Human telomere, oncogenic promoter and 5′-UTR G-quadruplexes: diverse higher order DNA and RNA targets for cancer therapeutics


“Guanine-rich DNA sequences can form G-quadruplexes stabilized by stacked G–G–G–G tetrads in monovalent cation-containing solution. The length and number of individual G-tracts and the length and sequence context of linker residues define the diverse topologies adopted by G-quadruplexes. The review highlights recent solution NMR-based G-quadruplex structures formed by the four-repeat human telomere in K+ solution and the guanine-rich strands of c-myc, c-kit and variant bcl-2 oncogenic promoters, as well as a bimolecular G-quadruplex that targets HIV-1 integrase. Such structure determinations have helped to identify unanticipated scaffolds such as interlocked G-quadruplexes, as well as novel topologies represented by double-chain-reversal and V-shaped loops, triads, mixed tetrads, adenine-mediated pentads and hexads and snap-back G-tetrad alignments. The review also highlights the recent identification of guanine-rich sequences positioned adjacent to translation start sites in 5′-untranslated regions (5′-UTRs) of RNA oncogenic sequences. The activity of the enzyme telomerase, which maintains telomere length, can be negatively regulated through G-quadruplex formation at telomeric ends. The review evaluates progress related to ongoing efforts to identify small molecule drugs that bind and stabilize distinct G-quadruplex scaffolds associated with telomeric and oncogenic sequences, and outlines progress towards identifying recognition principles based on several X-ray-based structures of ligand–G-quadruplex complexes.”

The pictures below are actual visualizations of the G-quadruplexes at telomeres and at non-telomeric regions, as seen in human cancer cells stained with a G-quadruplex antibody.  As you can see in iii, iv, and v, there are G-quadruplexes present at telomeres.  However, in i, ii, and iii, there are G-quadruplexes present at non-telomeric sites as well.  When they quantified the sites, they found that 82.4% of the sites that stained for the G-quadruplexes were not at telomeres. The conclusion of the authors of this article was that most of the G-quadruplexes were found at non-telomeric sites.

Image may be NSFW.
Clik here to view.
G-quad7

Reference:  2013 Quantitative Visualization of DNA G-quadruplex Structures in Human Cells

5b. Telomeric repeats must have at least 3 Guanines to form stable G-quadruplexes (2 are not enough)

Tetrahymena telomeres contain G-quadruplexes but telomeres do not, aat least acording to one publication. This is clearly due to differing G-content The telomeric repeat in Tetrahymena contains 4 guanines (TTGGGG) and forms even more stable G-quadruplexes than human telomeres.  However in yeast, the telomeric DNA repeat contains only 2 guanines and it does not form a G-quadruplex.

Reference: 2010 Stability of telomeric G-quadruplexes

“Using biophysical and biochemical methods, we studied sequences mimicking about four repetitions of telomeric motifs from a variety of organisms, including yeasts, with the aim of comparing the G-quadruplex folding potential of telomeric sequences among eukaryotes. G-quadruplex folding did not appear to be a conserved feature among yeast telomeric sequences. By contrast, all known telomeric sequences from eukaryotes other than yeasts folded into G-quadruplexes. Nevertheless, while G3T1-4A repeats (found in a variety of organisms) and G4T2,4 repeats (found in ciliates) folded into stable G-quadruplexes, G-quadruplexes formed by repetitions of G2T2A and G2CT2A motifs (found in many insects and in nematodes, respectively) appeared to be in equilibrium with non-G-quadruplex structures (likely hairpin-duplexes).”

Strangely, the conclusion in this publication that telomeres in yeast do not form G-quadruplexes seems to be contradicted in this 2011 publication which contains an illustration of the telomeric “G-quadruplex capping” that occurs in yeast.

Referemce:  2011 Rudimentary G-quadruplex–based telomere capping in Saccharomyces cerevisiae

Image may be NSFW.
Clik here to view.
G-quad8


” Telomere capping conceals chromosome ends from exonucleases and checkpoints, but the full range of capping mechanisms is not well defined. Telomeres have the potential to form G-quadruplex (G4) DNA, although evidence for telomere G4 DNA function in vivo is limited. In budding yeast, capping requires the Cdc13 protein and is lost at nonpermissive temperatures in cdc13-1 mutants. Here, we use several independent G4 DNA–stabilizing treatments to suppress cdc13-1 capping defects. These include overexpression of three different G4 DNA binding proteins, loss of the G4 DNA unwinding helicase Sgs1, or treatment with small molecule G4 DNA ligands. In vitro, we show that protein-bound G4 DNA at a 3′ overhang inhibits 5′→3′ resection of a paired strand by exonuclease I. These findings demonstrate that, at least in the absence of full natural capping, G4 DNA can play a positive role at telomeres in vivo.”

Also, other publications refer to G-quadraplexes with respect to yeast telomeres like the 2002 publication STM1, a gene which encodes a guanine quadruplex binding protein, interacts with CDC13 in Saccharomyces cerevisiae.

5c. The 3′-overhang of the telomere is where the G-quadruplex forms. TPP1 is a Shelterin protein that helps to form (fold) the G-quadruplex and POT1 is a Shelterin protein that helps to unfold the G-quadruplex. 

As it turns out, single strand overhang on the 3′ end of the human telomere contains between 20 and 200 nucleotides.  This is where the G-quadruplex forms. Since 3 of the 6 nucleotides in the TTAGGG repeat are guanines, it is easy to see how this could form a G-quadruplex. As it turns out, the G-quadruplex formation of this single stranded DNA is one of the ways that the telomeric DNA is protected from oxidative stress and from triggering the DNA-damage response (DDR), which causes cellular senescence.  The formation (folding) of DNA G-quadruplexes and the unfolding of G-quadruplex structures to allow telomerease to work is highly evolved.  There are Shelterin proteins that assist in both of these phases of dynamic telomere activity.  TRF1 interacting protein 1 (TPP1) assists in the formation of the G-quadruplex and Protection of Telomeres 1 (POT1) protein assists in the unfolding of the G-quadruplex.

References:

2014 DNA and RNA Quadruplex-Binding Proteins

2004 Telomerase Inhibition and Cell Growth Arrest After Telomestatin Treatment in Multiple Myeloma

5d. G-quadraplex formation at the end of telomeric DNA can inhibit telomere extension by telomerase and G-quadraplex unwinding by hellicase.

Reference:  G-quadruplex formation at the 3′ end of telomere DNA inhibits its extension by telomerase, polymerase and unwinding by helicase

“In this work, we studied the 3′ tail size-dependence of telomere extension by either telomerase or the alternative lengthening of telomere (ALT) mechanism as well as telomere G-quadruplex unwinding.  We show that these reactions require a minimal tail of 8, 12 and 6 nt, respectively. Since we have shown that G-quadruplex tends to form at the farthest 3′ distal end of telomere DNA leaving a tail of no more than 5 nt, these results imply that G-quadruplex formation may play a role in regulating reactions at the telomere ends and, as a result, serve as effective drug target for intervening telomere function.”

Image may be NSFW.
Clik here to view.
G-quad9

Image source “Figure 1: Extension of telomere by telomerase depends on the size of single-stranded tail at the 3′ side of the farthest distal G-quadruplex on telomere overhang. A telomere tail of less than four T2AG3 repeats (0–23 nt) will stay in single-stranded form. Those with tails long enough but unable to form G-quadruplex can be extended (top) while others without or with too short tails may not be extended (bottom).”

5e. The BRCA1 protein plays a role in G-quadruplex formation since it regulates the length of the single stranded DNA of the 3′-overhang of the telomere in a Rad50-dependent manner. BRCA1 also controls the expression of the telomerase (hTERT) gene. (i.e. the “telomerease-dependent role of BRCA1).

This is a very important finding, since the BRCA1 gene mutation plays such an important role in inherited breast and ovarian cancer.  BRCA1 silencing by epigenetic mechanisms is also seen frequently in sporadic breast cancer as well, making it an important part of the cause of both inherited and sporadic breast cancer pathogenesis.   Although the BRCA1 protein plays a key role in repairing double stranded DNA damage, it also inhibits the human TERT promoter region.

BRCA also plays a vital role in controlling telomere length via its association with G-quadruplex formation.  These non-DNA repair roles may be why it BRCA1 such a strong influence on the incidence of breast cancer.  This is especially intriguing for breast cancer, since the promoter region for the estrogen receptor probably also has G-quadruplexes in it which may also be regulated by BRCA1..

As it turns out, the single strand of the 3′-overhang of the telomere can be as short as 20 nucleotides and as long as 200 nucleotides.  Also as it turns out, BRCA1 mutation carriers have longer telomeres and people with normal BRCA1 genes have shorter telomeres.  This may be how BRCA1 gene mutations create a “cancer-permissive” environment for cancer to occur.

References:

2009 The Central Region of BRCA1 Binds Preferentially to Supercoiled DNA

2009 BRCA1 Localization to the Telomere and Its Loss from the Telomere in Response to DNA Damage

2003 BRCA1 Inhibition of Telomerase Activity in Cultured Cells

Here are some pictures of the BRCA1 protein co-localizing with TRF1 and with TRF2

Image may be NSFW.
Clik here to view.
G-quad10

Image may be NSFW.
Clik here to view.
G-quad11

Image source: 2009 BRCA1 Localization to the Telomere and Its Loss from the Telomere in Response to DNA Damage

5f. BRCA1 localization at telomeres is lost in response to DNA damage and plays a key role that is “telomerease-independent”

This may be a major mechanism of cancer formation.

Reference: 2009 BRCA1 Localization to the Telomere and Its Loss from the Telomere in Response to DNA Damage

5g. RNA forms G-quadruplexes at telomeres as well (i.e. the lncRNA TERRA)

There is also very strong evidence that the long noncoding RNA transcribed from the antisense strand of telomeres (TERRA) forms RNA G-quadruplexes and that the TERRA RNA G-quadruplex binds to telomere repeat binding factor 2 (TRF2).  Here is an illustration of how TERRA forms G-quadruplexes.

Image may be NSFW.
Clik here to view.
G-quad1

  1. 6. The most important oncogene, c-MYC,has a G-quadruplex in it, upstream from the promoter. This 27 nucleotide, G-quadruplex forming region controls 90% of c-Myc gene expression.   Thus G-quadruplex formation plays an important role in carcinogenesis.

  2. Image may be NSFW.
    Clik here to view.
    G-quad12

Reference: 2014 DNA and RNA Quadruplex-Binding Proteins  “Structure of G-quadruplex in the nuclease hypersensitive element (NHE) III1 region of human c-MYCpromoter (PDBid: 1XAV, [16]). (A) Side view; and (B) Bottom view. Sugar-phosphate backbone is represented by the orange ribbon, with the guanine bases forming the tetrads located in the middle.”

There is a guanine-rich sequence that is upstream from the promoter region of the c-MYC oncogene that forms a G-quadruplex.   When this was discovered by Simonsson,Kubista, and Pecinka in Sweden in 1997, suddenly everyone started taking G-quadruplexes seriously!

c-Myc is by far the most important oncogene that is over-expressed in cancer (whereas p53 is the most common tumor suppressor gene that is lost by mutation or by epigenetic silencing in cancer).   Moreover, Simonsson and colleagues proposed a molecular mechanism by which an “intrastrand fold-back of DNA” could form a tetraplex with a potassium ion.   The exact location where  this G-quadruplex can form is located in a major control element, upstream from the promoter, at bases 2186-2212, -115 to -142 bp upstream from the P1 c-Myc promoter.  This region is also called the “nuclease-hypersensitive element III” or NHE.  Although the c-Myc gene actually has 4 promoters, this NHE accounts for 75-85% of the total c-Myc transcription.

References:

1997 DNA tetraplex formation in the control region of c-myc

2002 Direct evidence for a G-quadruplex in a promoter region and its targeting with a small molecule to repress c-MYCtranscription

2007 Human telomere, oncogenic promoter and 5′-UTR G-quadruplexes: diverse higher order DNA and RNA targets for cancer therapeutics

Here is an illustration of how the G-quadruplex at the NHE can activate  c-Myc gene expression.

Image may be NSFW.
Clik here to view.
G-quad13

Image Reference: 2007 Human telomere, oncogenic promoter and 5′-UTR G-quadruplexes: diverse higher order DNA and RNA targets for cancer therapeutics


G-quadruplex formation appears to play a role in both gene expression and gene suppression. Here is a Wikipedia illustration how how the G-quadruplex inhibits gene expression.  Good examples of genes where G-quadruplex formation inhibits gene expression includes the c-kit gene, the bcd-2 gene, the VEGF gene, and the HIF-1a gene.

Image may be NSFW.
Clik here to view.
G-quad14

Reference: Wikipedia G-Quadraplex


  1. Several other common oncogene promoters have G-quadruplex DNA structures upstream from their promoter regions (c-kit, bcl-2, VEGF, HIF-1a, etc.)

c-MYC is not the only oncogene that is regulated by the formation of G-quadruplex DNA structures.  Several other oncogenes have well-described G-rich regions that form G-quadruplexes and are involved with gene regulation. Stabilization of G-quadraplexes affecting gene promoter elements to keep them from unwinding is a possible anti-cancer strategy.  Here are some examples:

7a. c-kit si an oncogene that codes for a tyrosine kinase receptor with an inhibitory 22 nucleotide G-quadruplex region upstream

The  c-kit gene is a common oncogene that codes for the expression of a tyrosine kinase receptor.  This gene is often over-expressed in gastrointestinal tumors.  The gene has two guanine-rich sequences that can form “3-stack” G-quadruplexes.  The formation of the G-quadruplex in the c-kit gene inhibits its expression. Drugs have been developed that stabilize this G-quadruplex structure.  These drugs cause the cancer to die by apoptosis. Thus the G-quadruplex of the c-Myc gene and  the c-kit gene are structurally different.

References:

2007 Human telomere, oncogenic promoter and 5′-UTR G-quadruplexes: diverse higher order DNA and RNA targets for cancer therapeutics

2006 A conserved quadruplex motif located in a transcription activation site of the human c-kit oncogene

This publication cites an instance of evolutionary conservation, suggesting similar roles of certain G-quadraplexes  in mamalian species: “Mutational analysis of c-kit21 has provided insights into its structural polymorphism. In particular, one mutated form appears to form a single quadruplex species that adopts a parallel conformation. The quadruplex-forming sequence shows a high level of sequence conservation across human, mouse, rat, and chimpanzee. The small variation in sequence between the quadruplex in human/chimpanzee as compared to the rat/mouse was examined more closely by biophysical methods. Despite a variation in the sequence and length of loop 2, the quadruplexes showed both comparable CD spectra, indicative of parallel quadruplexes, and also similar thermal-stability profiles, suggesting conservation of biophysical characteristics. Collectively, the evidence suggests that this quadruplex is a serious target for a detailed functional investigation at the cell-biology level.”

Reference: 2007 Structure of an unprecedented G-quadruplex scaffold in the human c-kit promoter

7b. bcl-2 is an apoptosis inhibitor that is over expressed in cancer and has an inhibitory 39 nucleotide G-quadruplex in it

Cells have many genes that encode for apoptosis activators and apoptosis inhibitors.  One of the major apoptosis inhibitor genes is the bcl-2 protein, encoded by the bcl-2 gene.  It can act like an oncogene in cancer when it is over expressed.  It is now clear that the 39-nucleotide G-quadruplex structure found between 1386 and 1423 base pairs upstream from the transcription start site (TSS) of the bcl-2 gene acts as a bcl-2 gene silencer.  When mutation studies have been done that delete this 39-nucleotide sequence,  this increases bcl-2 gene expression by 2.1 to 2.6 fold.  Like many other genes this guanine-rich sequence is in the proximity of a nuclease hypersensitive region (HNE).

References:

2007 Human telomere, oncogenic promoter and 5′-UTR G-quadruplexes: diverse higher order DNA and RNA targets for cancer therapeutics

1994 Regulation of chemoresistance by the bcl-2 oncoprotein in non-Hodgkin’s lymphoma and lymphocytic leukemia cell lines

2006 Deconvoluting the Structural and Drug-Recognition Complexity of the G-Quadruplex-Forming Region Upstream of the bcl-2 P1 Promoter

Different G-quadraplexes with alternative configurations can come into play impacting on the bcl-2 gene promoter.  “Mutation and deletion analysis permitted isolation and identification of three overlapping DNA sequences within this element that formed the three individual G-quadruplexes. Each of these was characterized using nondenaturing gel analysis, DMS footprinting, and circular dichroism. The central G-quadruplex, which is the most stable, forms a mixed parallel/antiparallel structure consisting of three tetrads connected by loops of one, seven, and three bases. Three different G-quadruplex-interactive agents were found to further stabilize these structures, with individual selectivity toward one or more of these G-quadruplexes. Collectively, these results suggest that the multiple G-quadruplexes identified in the promoter region of the bcl-2 gene are likely to play a similar role to the G-quadruplexes in the c-myc promoter in that their formation could serve to modulate gene transcription. Last, we demonstrate that the complexity of the G-quadruplexes in the bcl-2promoter extends beyond the ability to form any one of three separate G-quadruplexes to each having the capacity to form either three or six different loop isomers. ”

Here is an illustration of a bcl-2 gene G-Quadruplex

Image may be NSFW.
Clik here to view.
G-quad15

Image soure: 2006 Deconvoluting the Structural and Drug-Recognition Complexity of the G-Quadruplex-Forming Region Upstream of the bcl-2 P1 Promoter

7c.  The KRAS proto-oncogene has a G-rich region which can activate KRAS gene transcription in the DNA double stranded conformation (i.e. no quadruplex) or inhibit KRAS gene transcription (in the G-quadruplex conformation. 

Like the c-kit and bcl-2 G-quadruplexes that regulate gene expression of the c-kit and bcl-2 genes, the KRAS gene also has a guanine-rich strand that can form a “3-stack” G-quadruplex.  When this G-quadruplex is stabilized by small molecules such as TMPyP4, it reduces gene expression of the KRAS gene down to 20-40% of controls.  When the G-quadruplex is not stabilized, this G-rich area has been shown to go back to the DNA double stranded (Watson-Crick) conformation, thereby allowing gene transcription to occur.

Reference:  2006 G-quadruplex formation within the promoter of the KRAS proto-oncogene and its effect on transcription

Here is a diagram of the 28 nucleotide G-quadruplex that occurs in the KRAS promoter region

Image may be NSFW.
Clik here to view.
G-quad16

Image source: 2006  G-quadruplex formation within the promoter of the KRAS proto-oncogene and its effect on transcription


7d. The VEGF gene and HIF-1a gene each have 5 sites upstream with at least 3 guanines that may form G-quadruplexes, thereby creating or opening up binding sites for Sp1 and Egr-1 transcription factors

One universal feature of cancer is the formation of blood vessels, which provides nutrients and oxygen to the cancer cells, allowing them to grow. A second (near universal feature) of cancer is that 95% of the cancers develop “Warburg-type metabolism”, which is defined as the metabolic phenotype of “aerobic glycolysis in the presence of oxygen”.  In other words, they utilized glucose to make ATP without using oxygen, even if there is oxygen present.  This metabolic phenomena was named after Otto Warburg who first noted it in the early 20th century.  It is now clear that these two “twin features” of cancer (angiogenesis and Warburg-type metabolism) are driven by “twin genes” – VEGF and HIF-1a.  For instance, the Vascular endothelial growth factor (VEGF) gene encodes for a protein (VEGF) that is the main transcription factor for making blood vessels.  The Hypoxia Inducing Factor 1 alpha (HIF-1a) gene encodes for a protein (HIF-1a) that is the main transcription factor for VEGF and for the many genes that induce the Warburg effect.  Interestingly, both of these genes have 5 guanine-rich regions upstream from their promoter that are all capable of forming G-quadruplex structures in vitro.  These G-rich regions are near (but not exactly at) endonuclease hypersensitivity regions, suggesting that they are active in their involvement of gene regulation.  Here are the DNA sequences of these G-rich regions in VEGF and HIF-1a genes:

Image may be NSFW.
Clik here to view.
G-quad17


VEGF G-rich region(s): The most well-studied G-rich region in the VEGF gene is located at -85 to -50 bps from the TSS

Here is the DNA sequence for this G-rich region:

Image may be NSFW.
Clik here to view.
G-quad18


References:

2007 Human telomere, oncogenic promoter and 5′-UTR G-quadruplexes: diverse higher order DNA and RNA targets for cancer therapeutics

2008 The proximal promoter region of the human vascular endothelial growth factor gene has a G-quadruplex structure that can be targeted by G-quadruplex-interactive agents

HIF-1a G-rich regions(s)

2007 Human telomere, oncogenic promoter and 5′-UTR G-quadruplexes: diverse higher order DNA and RNA targets for cancer therapeutics

Unlike the G-quadruplexes in c-kit and bcl-2 which reduce oncogene expression, these G-rich sequences of the VEGF and HIF-1a genes may actually open up binding sites for promoters that activate these genes, such as Sp-1 and Egr-1 transcription factors.

More references:

2005 Facilitation of a structural transition in the polypurine/polypyrimidine tract within the proximal promoter region of the human VEGF gene by the presence of potassium and G-quadruplex-interactive agents

2008 The proximal promoter region of the human vascular endothelial growth factor gene has a G-quadruplex structure that can be targeted by G-quadruplex-interactive agents

“Collectively, our results provide evidence that specific G-quadruplex structures can be formed in the VEGF promoter region, and that the transcription of this gene can be controlled by ligand-mediated G-quadruplex stabilization. Our results also provide further support for the idea that G-quadruplex structures may play structural roles in vivo and therefore might provide insight into novel methodologies for rational drug design.”

7e. Small molecules have been made that bind to G-quadruplexes of oncogenes

Several small molecules have been synthesized that bind to G-quadruplexes.  These molecules actually stabilize the G-quadruplex, which makes them more difficult to “unfold”.   As a consequence of this G-quadruplex stability, these small molecules induce apoptosis in cancer cells.  It is likely that the location where these work is at the promoters or upstream from the promoters in the oncogenes that have G-quadruplexes in them, such as c-Myc, c-kit, bcl-2, VEGF, and HIF-1a. 

References:

2006 Telomerase inhibition with a novel G-quadruplex-interactive agent, telomestatin: in vitro and in vivostudies in acute leukemia

2006 Deconvoluting the Structural and Drug-Recognition Complexity of the G-Quadruplex-Forming Region Upstream of the bcl-2 P1 Promoter

Here are some of the small molecules that have been synthesized to bind to G-quadruplexes:

Image may be NSFW.
Clik here to view.
G-quad20


Image source


  1. G-quadruplexes or G-quadruplex unfolding problems play a key role in many disease conditions (Fragile X syndrome, Werner’s syndrome, Friedrich’s ataxia, ALS, etc.)

Whereas most of the information above involved either telomere G-quadruplexes or cancer oncogenes, several rare neurodegenerative diseases have been found to form G-quadruplexes.  In most all of these diseases, a nucleotide repeat expansion occurs where a triplet nulceotide sequence expands or a hexanucleotide repeat expands.  The repeat expansions have been found in coding segments (i.e. exons), 5′ untranslated regions (5′-UTRs), 3′ untranslated regions (3′-UTRs), promoter regions, and in noncoding regions (introns).

In some of these diseases, it may be the DNA that forms the G-quadruplex, but in most cases, it is the RNA transcript that forms the G-quadruplex. Here are some of those diseases:

8a. Fragile X Syndrom or FXMR syndrome – a CGG triplet repeat expansion in exon #1 of FMR-1 gene that forms a G-quadruplex

FXMR syndrome is the single most common inherited cause of mental retardation. There is a triple repeat in the first exon of the Fragile X Mental Retardation gene (FMR-1 gene) which does not cause mental retardation in carriers where the repeat is less than 200 nucleotides in length.  However, the repeat expands to as many as 2,000 nucleotides in individuals afflicted with FXMR, or Fragile X syndrome.  Along with expansion of the “CGC repeat”, there is hypermethylation of the cytosine residues in this area, which results in suppression of the FMR-1 gene. This results in the delay in replication of cells in those with Fragile X syndrome.

Thus the DNA triplet repeat expansion prevents DNA replication in Fragile X syndrome.  Interestingly, a functional copy of the helicase enzyme called “Werner syndrome helicase” (aka WRN) can overcome this replication block.  (In Werner’s syndrome, the helicase gene is nonfunctional).  This led to the discovery of proteins that “unfold” G-quadruplexes, such as WRN.  Unlike the effects of the small molecule stabilizers of G-quadruplexes in oncogenes, these small molecules that interact with G-quadruplexes destabilize the G-quadruplexes in Fragile X syndrome.  Obviously there is much more to learn about these structures.

References:

2007 Human telomere, oncogenic promoter and 5′-UTR G-quadruplexes: diverse higher order DNA and RNA targets for cancer therapeutics

1991 Instability of a 550-base pair DNA segment and abnormal methylation in fragile X syndrome

1993 Association of fragile X syndrome with delayed replication of the FMR1 gene

8b. Werner’s syndrome involves a mutation in a G-quadruplex “unfolding protein” called “helicase”

This was a major discovery about the importance of G-quadruplexes.   The helicase gene that is mutated in Werner’s syndrome is a critical protein for DNA replication, repair and telomere maintenance. This helicase gene is a member of the RecQ helicase family of enzymes.  Mutations in other members of this family also cause disease, such as Bloom syndrome and Rothmund-Thomson syndrome. RecQ helicases are often called the “guardian angels of the genome.” That is quite a strong statement in the 21st century, since it is very hard to see guardian angels today.  Although there are many other functions of the Werner’s syndrome helicase, it has an important role in unwinding or unfolding G-quadruplex structures.  During replication, G-quadruplexes on the lagging telomere is “unwound” by WRN helicase, making it possible to complete the DNA replication of the lagging strand of DNA. Here is an illustration of the role of WRN helicase in unwinding G-quadruplexes at the telomere.

Image may be NSFW.
Clik here to view.
G-quad19

Image source: 2015 Werner Syndrome-specific induced pluripotent stem cells: recovery of telomere function by reprogramming

8c. Friedrich’s Ataxia – a GAA triple repeat expansion in intron #1 of the Frataxin gene impairs transcription elongation

Unlike the triplet repeat in Fragile X syndrome, the triplet repeat that expands in Friedrich’s ataxia is NOT a G-rich triplet.  Instead, it is a “A-rich triplet” of GAA repeats.  Nevertheless, the story is similar – the triplet repeat does not cause any disease in carriers with short expansions, whereas when this expansion grows, the individuals display a terrible form of ataxia that was described by Friedrich long ago.  The exact method by which this “non-G-rich expansion” causes the disease is still being worked out.  What is clear is that the expression of the Frataxin gene is reduced when this expansion gets bigger.

References:

2007 Human telomere, oncogenic promoter and 5′-UTR G-quadruplexes: diverse higher order DNA and RNA targets for cancer therapeutics

1996 Friedreich’s ataxia: autosomal recessive disease caused by an intronic GAA triplet repeat expansion

2000 The GAA*TTC triplet repeat expanded in Friedreich’s ataxia impedes transcription elongation by T7 RNA polymerase in a length and supercoil dependent manner

1999 Sticky DNA: self-association properties of long GAA.TTC repeats in R.R.Y triplex structures from Friedreich’s ataxia

2000  Unexpected formation of parallel duplex in GAA and TTC trinucleotide repeats of Friedreich’s ataxia

8d. RNA G-quadruplexes form in the C9orf72 inherited form of FTD/ALS

Image may be NSFW.
Clik here to view.
G-quad21


Image source C9orf72 expansions and neurodegenerative disease 

Study by Beck and colleagues. C9orf72 expansions are thought to produce so-called RNA G-quadruplexes, stable secondary structures that may interfere with normal cellular functions. The authors developed a novel method for rapid screening for these expansions and investigated both a group of patients with various neurodegenerative disorders and population controls. They find these expansions to be present in a more diverse group of patients than previously anticipated. Also, up to 0.2% of the population are carriers of these massive expansions.”

9. DNA methylation and oxidation near G-quadruplex structures may reduce their stability and contribute to aging. Some have proposed that folate and antioxidants may make a major difference in the stability of G-quadruplexes, although no experimental evidence exists to support this claim. References:

2015 G-quadruplexes: A possible epigenetic target for nutrition.

2014 FANCJ promotes DNA synthesis through G-quadruplex structures

G4 sequences are prone to mutations particularly upon replication stress or in the absence of specific helicases. To investigate how G-quadruplex structures are resolved during DNA replication, we developed a model system using ssDNA templates and Xenopus egg extracts that recapitulates eukaryotic G4 replication. Here, we show that G-quadruplex structures form a barrier for DNA replication. Nascent strand synthesis is blocked at one or two nucleotides from the G4. After transient stalling, G-quadruplexes are efficiently unwound and replicated. In contrast, depletion of the FANCJ/BRIP1 helicase causes persistent replication stalling at G-quadruplex structures, demonstrating a vital role for this helicase in resolving these structures. FANCJ performs this function independently of the classical Fanconi anemia pathway. These data provide evidence that the G4 sequence instability in FANCJ(-/-) cells and Fancj/dog1 deficient C. elegans is caused by replication stalling at G-quadruplexes.”

Reference: 2014 The repair of G-quadruplex-induced DNA damage

“G4 DNA motifs, which can form stable secondary structures called G-quadruplexes, are ubiquitous in eukaryotic genomes, and have been shown to cause genomic instability. Specialized helicases that unwind G-quadruplexes in vitro have been identified, and they have been shown to prevent genetic instability in vivo. In the absence of these helicases, G-quadruplexes can persist and cause replication fork stalling and collapse. Translesion synthesis (TLS) and homologous recombination (HR) have been proposed to play a role in the repair of this damage, but recently it was found in the nematode Caenorhabditis elegans that G4-induced genome alterations are generated by an error-prone repair mechanism that is dependent on the A-family polymerase Theta (Pol θ). Current data point towards a scenario where DNA replication blocked at G-quadruplexes causes DNA double strand breaks (DSBs), and where the choice of repair pathway that can act on these breaks dictates the nature of genomic alterations that are observed in various organisms.”

 10. Some (but not all of the Helicases) unwind the 3D structure of DNA in G-quadruplexes. These helicases play a major role in health and aging.

The BRCA1-associated FANCJ Helicase can unwind G4 quadruplexes in vitrond this “G4 resolving function” helps protect DNA and improves genomic stability. When the FANCJ gene is mutated, ” replication stalling” occurs and the genome is vulnerable to oxidation during the stalled replication. As a result, individuals with mutations in the FANCJ gene develop breast cancer or Fanconi’s anemia. Reference: 2013 Specialization among iron-sulfur cluster helicases to resolve G-quadruplex DNA structures that threaten genomic stability

“G-quadruplex (G4) DNA, an alternate structure formed by Hoogsteen hydrogen bonds between guanines in G-rich sequences, threatens genomic stability by perturbing normal DNA transactions including replication, repair, and transcription. A variety of G4 topologies (intra- and intermolecular) can form in vitro, but the molecular architecture and cellular factors influencing G4 landscape in vivo are not clear. Helicases that unwind structured DNA molecules are emerging as an important class of G4-resolving enzymes. The BRCA1-associated FANCJ helicase is among those helicases able to unwind G4 DNA in vitro, and FANCJ mutations are associated with breast cancer and linked to Fanconi anemia. FANCJ belongs to a conserved iron-sulfur (Fe S) cluster family of helicases important for genomic stability including XPD (nucleotide excision repair), DDX11 (sister chromatid cohesion), and RTEL (telomere metabolism), genetically linked to xeroderma pigmentosum/Cockayne syndrome, Warsaw breakage syndrome, and dyskeratosis congenita, respectively. To elucidate the role of FANCJ in genomic stability, its molecular functions in G4 metabolism were examined. FANCJ efficiently unwound in a kinetic and ATPase-dependent manner entropically favored unimolecular G4 DNA, whereas other Fe-S helicases tested did not. The G4-specific ligands Phen-DC3 or Phen-DC6 inhibited FANCJ helicase on unimolecular G4 ∼1000-fold better than bi- or tetramolecular G4 DNA. The G4 ligand telomestatin induced DNA damage in human cells deficient in FANCJ but not DDX11 or XPD. These findings suggest FANCJ is a specialized Fe-S cluster helicase that preserves chromosomal stability by unwinding unimolecular G4 DNA likely to form in transiently unwound single-stranded genomic regions.”

References: 2008 FANCJ helicase defective in Fanconia anemia and breast cancer unwinds G-quadruplex DNA to defend genomic stability

2014 FANCJ promotes DNA synthesis through G-quadruplex structures

 Mitochondrial DNA also forms G-quadruplexes in the mitochondria.

These G-quadruplexes correlate well with common sites for deletions that often occur in the mitochondrial DNA. A mitochondrial Helicase called “Twinkle Helicase” unwinds these G-4 structures to allow mitochondrial DNA to be replicated. The Twinkle Helicase is transcribed from a nuclear gene called “C10orf2″. A well known mitochondrial G-quadruplex found in the mitochondrial genome is associated with deletions at this location in renal cell carcinoma. Thus research is now emerging that suggests that mitochondrial genomic Instability maybe due to deletions induced by stalled replication at G-4 structures due to inefficient unwinding by Twinkle. References: 2014 Association of G-quadruplex forming sequences with human mtDNA deletion breakpoints

2014 DNA sequences proximal to human mitochondrial DNA deletion breakpoints prevalent in human disease form G-quadruplexes, a class of DNA structures inefficiently unwound by the mitochondrial replicative Twinkle helicase

  1. G-quadraplexes in TERRA and telomeric DNA may play a role in regulating telomere length

TERRA is a long noncoding RNA that is transcribed from the antisense strand of telomeric DNA. As a consequence, the hexanucleotide repeat of TERRA is “UUAGGG”. The guanine ribonucleotdies of TERRA can form RNA G-quadruplexes, much like how G-rich DNA sequences can form G-4 structures with a cation and Hoogsteen bonds between the guanine ribonucleotides.

TERRA is plays a physiological role and a pathological role in regulating telomerase by interfering with the RNA template used by hTERT to add hexanucleotide repeats to telomeric ends. In addition to this role of TERRA, recent evidence has emerged about the G-quadruplexes in TERRA and the G-quadruplex structures of telomeric DNA. Thus TLS/FUS is both an “RNA and DNA G-quadruplex binding protein”. In the C-terminal region of TLS/FUS, there is an Arg-Gly-Gly domain that binds to both RNA or DNA G-4 structures. The theory is that G-quadruplexes form a scaffold for TLS to bind to RNA and DNA. This then allows TLS to regulate telomere length by histone modifications.  If this theory is correct, it points to an active role of a G-quadraplex structure that goes beyond simply blocking DNA transactions.

References:

2013 Regulation of telomere length by G-quadruplex telomere DNA- and TERRA-binding protein TLS/FUS

2014 DNA and RNA quadruplex-binding proteins

2011 Structure of long human telomeric RNA (TERRA): G-quadruplexes formed by four and eight UUAGGG repeats are stable building blocks

2013 Specific binding of modified RGG domain in TLS/FUS to G-quadruplex RNA: tyrosines in RGG domain recognize 2′-OH of the riboses of loops in G-quadruplex

2013 Specific binding of modified RGG domain in TLS/FUS to G-quadruplex RNA: tyrosines in RGG domain recognize 2′-OH of the riboses of loops in G-quadruplex

13. Both DNA and RNA G-4 structures may regulate estrogen receptor alpha (ER-a) expression.

Since many cancers utilize the ER-alpha receptor as a driver of cancer growth, intense interest has been focused on how the ER-a gene expression is regulated. Estrogen hormone levels, epigenetic regulation, and lncRNA regulation of the ER-alpha gene do not fully account for the variations in ER-a levels in normal cells or neoplastic cells. For this reason, G-Quadruplex mediated gene regulation has been proposed as a possible explanation for the differences in ER-a protein seen in different tissues. 20 G-rich sequences have been found in the ER-a gene, including 3 in the exons of the ER-a gene.  G-Quadruplexes have been identified by CD, UV, and NMR spectroscopy. One G-Quadruplex in particular, called the “exon C G-quadruplex”, has been shown to form a very stable DNA G-quadruplex in living cells and decreases ER-a gene expression.  This G-rich region is 22 nucleotides long. When a GGG region in this 22nt region was mutated into a AAA, there was a 15-fold increase in the expression of the ER-a gene in bovine cells.

In another experiment, a region in the 5′-UTR of the transcribed ER-a messenger RNA has been found to form a G-quadruplex. Although this G-quadruplex in the 5′-UTR region of the ER-a mRNA does not code for any amino acid, it clearly regulates the rate at which the mRNA transcripts are translated. When cloned and placed in front of a Luciferase reporter gene, this 5′-UTR G-quadruplex reduces expression of the Luciferase by 6-fold!

In summary, both DNA G-4 structures and mRNA G-4 structures exist in the normal expression of the ER-a gene and may regulate transcription (the exon C DNA G-Quadruplex) and translation (the 5′-UTR mRNA G-Quadruplex). 

References:

2009 Repression of translation of human estrogen receptor alpha by G-quadruplex formation

2014 DNA and RNA quadruplex-binding proteins

2010 Occurrence of a quadruplex motif in a unique insert within exon C of the bovine estrogen receptor alpha gene (ESR1)

2012 book New Models of the Cell Nucleus: Crowding, Entropic Forces, Phase Separation, and Fractals

2012 book Therapeutic applications of quadruplex nucleic acids

  1. mRNA G-Quadruplex structures in the 5′-UTR noncoding portion of RNA transcripts

Whereas the early studies of G-quadruplexes was confined to DNA G-4 structures, there has been a recent surge of interest in RNAG-Quadruplexes, since they have been found in vivo. The most common site where G-4 structures exist in RNA is in the 5′-UTR region of the mRNA

Reference: 2012 5′-UTR RNA G-quadruplexes: translation regulation and targeting

“RNA structures in the untranslated regions (UTRs) of mRNAs influence post-transcriptional regulation of gene expression. Much of the knowledge in this area depends on canonical double-stranded RNA elements. There has been considerable recent advancement of our understanding of guanine(G)-rich nucleic acids sequences that form four-stranded structures, called G-quadruplexes. While much of the research has been focused on DNA G-quadruplexes, there has recently been a rapid emergence of interest in RNA G-quadruplexes, particularly in the 5′-UTRs of mRNAs. Collectively, these studies suggest that RNA G-quadruplexes exist in the 5′-UTRs of many genes, including genes of clinical interest, and that such structural elements can influence translation. This review features the progresses in the study of 5′-UTR RNA G-quadruplex-mediated translational control. It covers computational analysis, cell-free, cell-based and chemical biology studies that have sought to elucidate the roles of RNA G-quadruplexes in both cap-dependent and -independent regulation of mRNA translation. We also discuss protein trans-acting factors that have been implicated and the evidence that such RNA motifs have potential as small molecule target. Finally, we close the review with a perspective on the future challenges in the field of 5′-UTR RNA G-quadruplex-mediated translation regulation.”

Here are a few practical phytosubstance-related aspects to the discussion:

15. Quercetin is a strong binder to G-Quadruplex DNA and RNA structures! 

This is fascinating and may explain some of the reasons why Quercetin induced apoptosis in the Mayo Clinic study earlier this year.

Reference: 2013 Aminoglycosylation Can Enhance the G-Quadruplex Binding Activity of Epigallocatechin

16. Epigallocatechin binds to G-Quadruplexes. Derivatives of EGC bind even stronger than EGC, such as glucosaminosudes of pentamethylated EGC. 

This modified EGC has both an affinity for DNA and RNA G-Quadruplexes.

Reference:  2013 Aminoglycosylation Can Enhance the G-Quadruplex Binding Activity of Epigallocatechin

17. EGCG and Theaflavin both have been found to bind to histone proteins in the cell as well as G-Quadruplexes in the cell

Reference:2013 Phenolic promiscuity in the cell nucleus – epigallocatechingallate (EGCG) and theaflavin-3,3′-digallate from green and black tea bind to model cell nuclear structures including histone proteins, double stranded DNA and telomeric quadruplex DNA

Overall Summary

G-quadruplexes are 3D structures formed by 4 guanines from 1, 2, or 4 strands of DNA or RNA that violate the most fundamental tenant of the “Watson-Crick” dogma of DNA (i.e. that guanine only forms a base pair with cytosine).  This “rule violation” has disrupted most of the conventional wisdom about the tertiary structure of DNA.  The key structural feature of these G-qaudruplexes is the presence of a monovalent cation (K+ or Na+) in the center of the G-quadruplex.  These G-quadruplexes can be “stacked” to form 2, 3, 4, or many stacks.  The more stacks there are, the more stable these structures are and the more difficult it is for them to be unfolded.  Both the formation and the unfolding of G-quadruplexes are facilitated by specialized G-quadruplex binding proteins that have evolved over millions of years.

Although G-quadruplex structures are mostly found in eukaryotes, they have also been found in some prokaryotes.  As many as 376,000 putative G-quadruplex structures could form in the human genome, although this estimate was made purely based on computer modeling.  Another 3,000 putative RNA G-quadruplex-forming elements have been identified in the human genome.  These RNA G-quadruplex structures are transcribed from 5′-UTR segments of genes.

G-quadruplex structures play a critical role in telomere stably of the 3′-overhang part of the very end of the telomere. They associate with Shelterin proteins and are critical in “G-quadruplex capping of the telomere”.  These G-quadruplexes are regulated by BRCA1 gene.  The role that BRCA1 gene plays in stabilizing G-quadruplexes may be even more important that its role in double stranded DNA break repair.

The G-quadruplex stabilizing role of BRCA1 on the estrogen receptor gene promoter may explain why gene mutation carriers have such a high incidence of breast and ovarian cancer (i.e. BRCA1 is not turning off the estrogen receptor gene).  G-quadruplexes also form in Fragile X Syndrome within exon #1 and in Fredrich’s ataxia in intron #1.  However, the triplet repeat expansions in these two inherited genes are the true reason why these patients develop the disease, not the formation of G-quadruplexes per se.

G-quadruplex unfolding is a key role of the Werner’s syndrome helicase protein.  When this gene is mutated, the helicase protein cannot unfold the many G-quadruplexes found throughout the human genome.  As a consequence, patients with Werner’s syndrome undergo accelerated aging.

Thus the inability to unfold G-quadruplexes may be a major cause of premature aging.  There is some evidence that the inability to unfold G-quadruplexes may play a role in normal aging as well.

Last of all, G-quadruplexes play a crucial role in carcinogenesis.  G-quadruplexes have been found in endonuclease hypersensitivity areas in the promoters or near the promoters of many important oncogenes, including c-Myc, c-kit, bcl-2, KRAS, VEGF, HIF-1a, and other oncogenes.   Small molecules that stabilize these G-quadruplexes often induce apoptosis in cancer cells.  Here is a diagram that summarizes the many roles of G-quadruplexes in health and disease:

Image may be NSFW.
Clik here to view.
G-quad22

Illustration Reference: Image source DNA and RNA Quadruplex-Binding Proteins

18.  Thoughts on G-quadraplexes and evolution

I am fascinated with this wild new 3D structure of DNA. I remember reading about G-quadruplexes when I did a write up on telomeres and TERRA, but really did not understand how fundamental these structures were in Nature. Then when the word came up as I was reading about C9orf72 repeat expansions and familial FTD/ALS, I decided I had to figure out what these structures were.

Now I am convinced that G-quadruplex structures form spontaneously in G-rich regions of DNA and RNA when the weather cools.  This could have evolved long ago as the first way of turning off genes at night (cooler temps) or in the winter.  Also, since heat will “unwind G-quadruplexes,” they could have evolved as a simple way to initiate transcription of the rising sun (I.e. Circadian rhythms) or turn on growth genes like c-Myc when the weather became warmer in the spring/summer months.

My guess is that simple organisms like prokaryotes had little control over the formation/deformation of G-4 structures that simply turned genes on/off based on ambient temperature, Whereas in more complicated cell (eukaryotes) evolution produced “G-4 folding proteins” and “G-4 unfolding proteins” which could regulate G-4 structures with much tighter transcriptional control. It is also clear to me that the “inability to unwind G-4 structures” is the reason for the accelerated aging phenotype seen with Werners Syndrome. This emerging science may also lead to a better understanding normal aging. The analogy here would be HGPS (Hutchinson-Gilford progeria syndrome). Once upon a time, we thought that HGPS had no similarities to normal aging.  Then we found out that progerin forms in skin with normal aging; due to long UV light exposure (UVA) triggering the same alternative splice site in the LMNA gene that is constitutively activated in HGPS! In other words, I bet we will find a G-quadruplex unwinding problem occurs with normal aging, just like it causes accelerated aging in Werner’s Syndrome. Thus WRN mutations causing Helicase dysfunction may provide the clue in normal aging.

Final comments by Vince Giuliano

The question could be asked:  “Are-G-quadraplexes 1.  pesky artifacts created by Hoogsteen hydrogen bonding that evolution has had to work itself around, or 2.  are they tools for the fine-tuning of key biological processes.”  I give my usual answer which is “probably both” and also add “but certainly the second.”  G-quadraplexes plus the helicase proteins that unwind them are capable of blocking or permitting key DNA transactions in a highly circumstance-driven manner, including gene transcription.  As such, they provide another level of cell regulation. beyond that provided by many other mechanisms including histone acetylation, DNA and histone methylation, various species of noncoding RNA, etc.  Further, it appears that G-quadraplexes can play other roles besides blocking DNA transactions, such as functioning as a scaffold for the telomere-binding protein, TLS, to regulate telomere length by histone modifications.  G-complexes in UTR non-coding portions of RNA point to additional regulatory functions. I think that focusing on regulatory functions of G-quadraplexes is an emerging viewpoint in the literature.  Evolution has embraced G-quadraplexes and put them to work.  For example, the 2014 publication DNA and RNA Quadruplex-Binding Proteins comments:

“The large number of potential quadruplex structures in all genomes pointed to their importance in cell regulation. Epigenetic modifications and alternative DNA structures appear to provide a higher level of information which may determine and fine-tune complex biological processes at the molecular level. Local DNA structures including cruciforms, triplexes and quadruplexes are often formed in the domains of negatively supercoiled DNA and they could be stabilized and regulated by protein interaction. Since these structures could also be the source of genomic instability, they have to be tightly regulated especially during DNA replication. Telomeric quadruplexes can contribute to the protection of the chromosomal ends. G-quadruplexes in promoter regions can also influence transcription efficiently. Association of quadruplexes with oncogenic and tumor suppressor proteins suggests that quadruplexes may play roles in cancer development and are possible targets for gene therapy. Quadruplex-binding proteins can be divided into several categories. In addition to a well characterized group of proteins which bind specifically to telomeric DNA, we have further classified quadruplex-binding proteins into those which bind to DNA quadruplexes, and those which associate with RNA quadruplexes (see Table 1). Using a new computational tool for examination of conserved G-quadruplex motifs, a great deal of G-quadruplexes conserved across species was identified [145]. Stability of the quadruplexes in evolution suggests the significance of these structures. A deeper understanding of the processes related to their formation, function and recognition will be an important piece of the puzzle in providing better insight into the regulation of living organisms.”


Transposable DNA elements – Part 1: basics and importance

By Vince Giuliano, inspired by interaction by James P. Watson

This is the first blog entry in a three-part series concerned with transposable DNA entries (TEs).  It focuses on basics of what TEs are, why they are important for us who are concerned with health and aging, and briefly outlines what comes later in the series.  Part 2 of the series, The Self-copy Machines in Your Genes – transposable elements was mainly generated by Jim Watson.  It is the main course of the series, providing the “meat and potatoes” of technical content.  Twenty one key aspects of TEs are discussed there.   Part 3 of the series TEs and an emerging “Grand Unified Theory” of biology and aging outlines the key role of TEs in making evolution possible in response to a changing environment, and how they fit into an emerging unified theory of how all life and aging works.

What are transposable elements?

Most of the DNA in our human genome is composed of largely but not completely, inactive copies of three distinct classes of transposable element, sequences of DNA that have accumulated over millions of years and keep replicating.  “A transposable element (TE or transposon) is a DNA sequence that can change its position within the genome, sometimes creating or reversing mutations and altering the cell’s genome size. Transposition often results in duplication of the TE(Wikipedia).”  A transposable element is a segment of DNA with inverted terminal repeats at each end that can excise or copy itself and move from one location to another within or between chromosomes, plasmids, or phage. Not only can some TEs copy their own genomes — they can also copy and paste parts or wholes of adjacent human genes. And they can relocate or paste in the DNA where they want, including in the middle of other genes.  Although we are still starting to understand this, we know it is not completely random.TEs have played enormously important roles in shaping our evolution and some of these TEs are continuing to do that today. Transposable elements have been called “jumping jeans.”  Most of these TEs are in fact not protein-coding genes, but jump around they do.  They also may be a major driver of aging.

Key practical facts about transposable elements

Despite the fact that there are different classes of TEs with different properties, a few important generalizations can be drawn, including:

TEs and evolution

TEs seem active in all organisms and to be major drivers of evolution within and between species.  Tracing our evolution, some of the first TEs showed up over 150 million years ago in primitive organisms like yeast.  As time progressed, we can identify the emergence of TE classes of increasing sophistication.  Alu is a primate-specific transposable element whose copy numbers have increased from zero to between 1.4 and 2 million copies over the past 65-80 million years of primate evolution. Some recently emerged TEs seem to apply only to us hominids, like SVAs which go back only 25 million years or so.

TEs can systematically broadcast complex genetic mutations in DNA under stress conditions.  They can copy or export long segments of DNA to remote and seemingly unrelated places in the genome of a cell.  It is as if they can say to the organism concerned   “It seems like you are experiencing a lot of stress and I am getting concerned about your survival and success as a species.  So, I am going to throw your evolution machine into higher gear by mixing up your DNA a bit, copying whole pieces and moving them to new places in your genome.  Sometimes, I will make you another copy of one of your genes in a new place.  Or, even several copies.  Some of those possible DNA shifts or mutations may give you cancers or kill you or otherwise screw you or your progeny up.  I am sorry for that, but I hope you understand that my deep commitment is to the evolution and proliferation of species, not to you as an individual, or even to your particular species.  That means innovation in the interest of life going on and developing life further as conditions change.  And sometimes it means creating new species.  These in turn require innovation in your genome and that is my job.  However, I generally don’t generally do random mutations.  Mostly, the pieces of DNA I spread around or duplicate in the genome of one of your cells are ones you had somewhere there in the first place.  Many of the innovative DNA shifts and mutations in your genome, perhaps in other individuals like you, will prove useful and enhance survival or perhaps emergence of a superior species.  I know this works well since we, the TEs, have been doing this for millions of years and it has been key to your species of homo sapiens getting to where it is now.  Years ago you learned that evolution was due to random variation and natural selection.  What I am telling you now is that the variation is deliberate, is triggered, and focused.  Speaking on behalf of me and my fellow TEs, I am telling you that generating that variation is our job.”

In other words, TEs are a very deep mechanism for rapid evolution, applying across species, going back to near the beginning of life forms.  If you like the idea of being more than a slime mold, you should appreciate them.

The Part 3 blog entry in this series further discusses the role of TEs in evolution.

TEs and health

Most TEs in humans are no longer active although still present in our DNA and making up about half of our genome.  The vast majority of these are no longer active as a result of cumulative mutation, truncation, internal rearrangement and silencing.  However, it is estimated that approximately 100 of L1s TEs per nuclear genome still retain their replication activity.  If promoted by cancer, certain other disease conditions and aging, these can create mutations that lead to pathologies and diseases.  Some Line-1 TEs can create single and double-strand DNA breaks.  Alu TE element copying can introduce insertions and deletions in 33 genes, leading to many more terrible diseases.  SVA TEs can exercise DNA mischief including the generation of differentially methylated regions, exon shuffling, alternative splicing, and of course insertional mutations. Some TEs can do strange things in terms of gene activation.  For example, an L1 TE may contain an antisense promoter leading it to activate an unrelated upstream gene, or, more likely, down-regulate it or silence it. TEs of the Alu and LTR families can provide binding sites for NF-kappaB, master regulator of immune response and inflammation. So, TEs can turn on inflammation.

Cancer cells and certain other diseased cells have very high levels of TE expression, especially cancer cells that have progressed to late stages of chemotherapy and radiation resistance.  TEs may be implicated in Alzheimer’s disease through creating many extra copies of the gene that makes amyloid precursor protein in the cortical neurons of AD patients.

Human endogenous retroviruses (HERVs) are TEs, but though they make up a great deal of our genome they are largely inactive as viruses.  However,  they are quite important since their long terminal repeats (LTRs) can serve as alternative promoters of nearby genes.  This appears to be a process very important for embryogenesis, but can also lead to a number of disease conditions.

TEs and aging

TEs are highly likely to play major roles in aging.  There is widespread agreement that genomic instability and DNA damage are key features of aging – and TEs cause both.   Although the research on this topic is not completely definitive yet, it may well turn out to be the case that TEs are more important for aging in elderly people than the “usual suspect” pathways like IGF-1 and mTOR.  TEs are likely to do this by generating double strand DNA breaks, by generating insertional mutations, by silencing of genes, by gene copy number increases, by triggering pathways that lead to cellular senescence and apoptosis, and by generating inflammation through activating alternative binding sites for inflammatory factors.    Global hypo-methylation associated with aging leads to activation of TEs.  Consistent with this, the expression of certain TEs, namely LINE-1 elements, dramatically increases with aging in yeast, in fruit fly brains, in mouse liver and skeletal muscle, and in human somatic cells.  A few studies have shown that overexpression of L1 can cause cells to senesce.   Some researchers think that large numbers of DNA breaks associated with L1 TEs may be a major factor in aging.  Such breaks can exhaust limited supplies of NAD+ and  SIRT1 for their repair, impairing mitochondrial and metabolic health.  expression of L1 TEs  can induce cellular senescence or apoptosis in normal cells.  Studies of SNPs of genes that are promoted by LTRs in TEs suggest an intriguing link between inflammation and aging.  When SNPs of inflammation-promoting genes are present, they cannot be activated by TEs and longer lifespans result.  TEs are responsible for increasingly mixing up our non-germline DNA as we age, leading us to become “genomic mosaics” where not all of the cells have the same copy number of genes and some cells may have multiple copies of pro-aging genes.

What activates TEs and what silence them?

No surprise, inflammation and major stresses are the big activators if TEs.  Some TEs can turn on inflammation – human endogenous retroviruses (HERVs) and LTR remnants of HERVs can turn on inflammation by using the LTRs as “alternative promoters” for NF-kB and many other inflammatory transcription factors.  In turn, inflammation itself can activate TEs. There is now strong evidence that transposable elements become activated and TE transcription increases with inflammation and cellular stress. The consequences can be serious, such as in the case of inflammation induced by IFN-gamma.  Some of the inflammatory transcription factors produced by IFN-gamma can activate LTRs on TEs found near human genes.  These inflammatory transcription factors can use the LTR as a “landing strip” and activate nearby genes that can induce cancer and aging. This is why chronic viral infections are associated with an increased risk of cancer and accelerated aging.

As to keeping TEs silent, we humans are much better at this than lower animals, and this might be a big part of explaining why we live longer.  However, for the reasons outlined above, implementing measures for keeping TEs silent as we become aged can be very important.  Fortunately, there seems to be a number of strategies for doing this.  As just indicated, keeping inflammation down is an excellent idea – a recurrent theme from a number of other longevity-related viewpoints.  Some of our dear old anti-aging friends like SIRT6, melatonin, caloric restriction and fasting can be helpful in keeping TEs silent.  Keeping our level of NAD and our NAD/NADH ratio up can be helpful for having enough SIRT6 around to both handle double-strand DNA breaks and keep our L1 TEs silent.  Fasting and other measures that down-regulate the insulin/IGF-1 pathway might help.  Also, lifestyles that respect our circadian rhythms, biotin, histone deacetylase inhibitors, histone acetyl transferase inhibitors, and sirtuin activators may also be promising approaches to suppress TE expression.  And vaccines might help, ones being developed to work against ORF2 and HERV proteins for preventing cancer and HIV infections.  Finally, some drugs might turn out to be useful in this regard, such as reverse transcriptase inhibitors like lamivudine and adefovir.

For the research and literature citations backing up the above statements, see Jim Watson’s Part 2 blog entry in this series.

Image may be NSFW.
Clik here to view.

Image source   Genetic mosaicism in corn due to transposable elements

Background homework on TEs

If you are not familiar with the basics of transposable DNA elements (TEs), I suggest you start by reviewing some basic information about them, such as on the Wikipedia page on this  topic.  I have quoted a few passages from that page here in italics to introduce a number of distinctions that are referred to  throughout this blog entry.  You can skip this Section and go right on to the Part 2 blog entry if you already are familiar with TEs.

·       Again from Wikipedia:

Transposable elements (TEs) represent one of several types of mobile genetic elements. TEs are assigned to one of two classes according to their mechanism of transposition, which can be described as either copy and paste (class I TEs) or cut and paste (class II TEs).[12]

“Class I (retrotransposons)

Class I TEs are copied in two stages: first they are transcribed from DNA to RNA, and the RNA produced is then reverse transcribed to DNA. This copied DNA is then inserted at a new position into the genome. The reverse transcription step is catalyzed by a reverse transcriptase, which is often encoded by the TE itself. The characteristics of retrotransposons are similar to retroviruses, such as HIV.

Retrotransposons are commonly grouped into three main orders:

·       TEs with long terminal repeats (LTRs): encode reverse transcriptase, similar to retroviruses

·       LINEs (LINE-1s or L1s): encode reverse transcriptase, lack LTRs, and are transcribed by RNA polymerase II

·       SINEs: do not encode reverse transcriptase and are transcribed by RNA polymerase III.

Retroviruses can also be considered TEs. For example, after entering a host cell and conversion of the retroviral RNA into DNA, the newly produced retroviral DNA is integrated into the genome of the host cell. These integrated DNAs represent a provirus of the retrovirus. The provirus is a specialized form of eukaryotic retrotransposon, which can produce RNA intermediates that may leave the host cell and infect other cells. The transposition cycle of retroviruses has similarities to that of prokaryotic TEs, suggesting a distant relationship between these two TEs types.

Class II (DNA transposons)

The cut-and-paste transposition mechanism of class II TEs does not involve an RNA intermediate. The transpositions are catalyzed by several transposase enzymes. Some transposases non-specifically bind to any target site in DNA, whereas others bind to specific DNA sequence targets. The transposase makes a staggered cut at the target site resulting in single-strand 5′ or 3′ DNA overhangs (sticky ends). This step cuts out the DNA transposon, which is then ligated into a new target site; this process involves activity of a DNA polymerase that fills in gaps and of a DNA ligase that closes the sugar-phosphate backbone.[citation needed] This results in duplication of the target site. The insertion sites of DNA transposons may be identified by short direct repeats (created by the staggered cut in the target DNA and filling in by DNA polymerase) followed by a series of inverted repeats important for the TE excision by transposase. Cut-and-paste TEs may be duplicated if their transposition takes place during S phase of the cell cycle when a donor site has already been replicated, but a target site has not yet been replicated.[citation needed] Such duplications at the target site can result in gene duplication, which plays an important role in evolution.[13]:284 Not all DNA transposons transpose through the cut-and-paste mechanism. In some cases, a replicative transposition is observed in which a transposon replicates itself to a new target site (e.g. Helitron (biology)).

Class II TEs make less than 2% of the human genome, making the rest Class I.[14]

Autonomous and non-autonomous TEs

Transposition can be classified as either “autonomous” or “non-autonomous” in both Class I and Class II TEs. Autonomous TEs can move by themselves while non-autonomous TEs require the presence of another TE to move. This is often because non-autonomous TEs lack transposase (for class II) or reverse transcriptase (for class I).”

·       The various kinds of transposons are mobile genetic elements that can move about in the genome, and there are other such elements as well including Plasmids, Bacteriophage elements, like Mu, Group II introns and Group I introns.  The total of all mobile genetic elements in a genome may be referred to as the mobilome.

This diagram illustrates the cut-and-paste and copy-and-paste mehanisms of movement.

Image may be NSFW.
Clik here to view.
LINE1-a

Image source

Here is a somewhat more complete diagram showing what TEs do:

Image may be NSFW.
Clik here to view.
LINE1-d

Image source: 2011 Dynamic interactions between transposable elements and their hosts Fig 1

Additional key distinctions

ORF -open reading frame” In molecular genetics, an open reading frame (ORF) is the part of a reading frame that has the potential to code for a protein or peptide. An ORF is a continuous stretch of codons beginning with a start codon (usually AUG) and ending with a stop codon(usually TAA, TAG or TGA).[1] ” (ref)

LTR – long terminal repeat.  Long terminal repeats (LTRs) are identical sequences of DNA that repeat hundreds or thousands of times found at either end of retrotransposons or proviral DNA formed by reverse transcription of retroviral RNA.  They are used by viruses to insert their genetic material into the host genomes.

RT–  Reverse transcriptase (RT) is an enzyme used to generate complementary DNA (cDNA) from an RNA template, a process termed reverse transcription

ALUAn Alu element is a short stretch of DNA originally characterized by the action of the Alu (Arthrobacter luteus) restriction endonuclease.[1] Alu elements of different kinds occur in large numbers in primate genomes. In fact, Alu elements are the most abundant transposable elements in the human genome. They are derived from the small cytoplasmic 7SL RNA, a component of the signal recognition particle. The event, when a copy of the 7SL RNA became a precursor of the Alu elements, took place in the genome of an ancestor of Supraprimates.[2]

HERVs – Human endogenous retroviruses

Gag, Pol and Env these are three major proteins encoded in the retroviral genome:

Image may be NSFW.
Clik here to view.

Image and legend reference  ”The group antigens form the viral core structure, RNA genome binding proteins, and are the major proteins comprising the nucleoprotein core particle. Reverse transcriptase is the essential enzyme that carries out the reverse transcription process that take the RNA genome to a double-stranded DNA preintegrate form. — The reverse transcriptase gene also encodes an Integrase activity and an RNase H activity that functions during genome reverse transcription.”

If you are intrigued by TEs in the light of the above, I strongly suggest you proceed to Jim Watson’s Part 2 blog entry.  The 21 items discussed there are:

1. There are Over 2 Million Copy Machines in your Genes, but only 80-100 still work (they are all LINE-1s)

2. Short-lived organisms are more permissive to retrotransposition, whereas long-lived organisms are resistant to retrotranspostion.  

3. Human Gene Transcription or Repression can be triggered from the anti-sense promoters of LINE-1 and from the bidirectional LTRs of old HERV sequences

4.  TEs and inflammation

5.  Bidirectional promoters and diseases

6. SIRT6 “vacates” L1 promoters with aging, allowing L1 expression to occur in old age

7.  Inflammation triggers transposable element expression 

8.  Germ lines and stem cells are protected against TE expression

9. Knocking out the Insulin/IGF pathway in C. elegans silences transposons by RNAi, Piwi-piRNA pathway, and by TDP-1

10. Transposable element endonuclease (ORF2) induces double stranded DNA breaks (DSBs) via endonuclease “nicking” of DNA

11. Cancer is manifested by dramatic increases in transposable element expression                                                                                                          

12. LTR transposable elements contain G-quadruplex sequences at specific distances from their endogenous TE promoter that may regulate LTR-mediated gene expression

13. Transient LINE-1 over-expression induces cell senescence or apoptosis in normal healthy cells

14. Melatonin suppresses LINE-1 expression, as does sleep and turning off the lights at nigh

 15.  SIRT6 – An important silencer of transposable element expression and a candidate “longevity gene”

16. Longevity is associated with gene polymorphisms that may play a role in reducing TE activity and reducing inflammation 

17. The human brain is a very active site of L1 transcription and insertions into neurons, in a cell-specific manner that produces gene mosaicism

18.  TE-originated genetic mosaicism – a likely cause of Alzeimer’s disease

19. Vaccines with cancer-associated ERVS and HIV infection-associated ERVs appear to be safe and immunogenic 

20. Reverse Transcriptase inhibitors that suppress transposable element retrotransposition may effectively treat cancer

21. Retrotransposon activity is likely to be a MAJOR cause of aging

Transposable DNA elements –- Part 2: The Self-copy Machines in Your Genes

By James P Watson with editorial and some content contribution by Vince Giuliano

This is the second blog entry in a three-part series concerned with transposable DNA entries (TEs).  The Part 1 entry focused on basics of what TEs are, and why they are important for us who are concerned with health and aging.  This  Part 2 entry is the main course of the series, providing the “meat and potatoes” of technical content.  Twenty one key aspects of TEs are discussed here.  Part 3 of the series TEs and an emerging “Grand Unified Theory” of biology and aging outlines the key role of TEs in making evolution possible and how TEs fits into an emerging unified theory of how all life and aging works.

1. There are Over 2 Million Copy Machines in your Genes, but only 80-100 still work (they are all LINE-1s)

These TE “copy machines” drove evolution for 150 million years, but have largely become non-functional in humans.  However, those that are working can still copy themselves (LINE-1s) or copy other transposable elements that were never able to copy themselves (i.e. were parasitic transposable elements).  The Alu and SVA transposable elements are the “parasitic TEs”. 

Here are the details.

HERVs (Human endogenous retroviruses)

There are 98,000 fragments of leftover “fossil viruses” in our genomes (HERVs)  but none are capable of “self-copying” themselves.  In rodents, however, there are many mouse endogenous retroviral elements (MERVs) that are “active” and capable of retrotransposition.  This is one of the major genetic differences between “mice and men” and may partially explain why TE insertional mutagenesis in rodents is 100-fold higher than in humans.  Likewise in mice several MERVs are very similar looking to exogenous, infections mouse retroviruses (This is why many viruses cause tumors in mice and rats).   The fact that LTR-retrotransposons cannot copy themselves in humans is surprising, since HERVs make up 8-9% of the human genome (in terms of DNA base pairs).  When transposable elements cannot copy themselves, they are referred to as being “non-autonomous”, which HERVs are in humans (but not rodents).   This difference between humans and rodents may be a major reason why we live so much longer than rodents.

 So, largely because of active TEs, mice are more open to evolution than we are and they get a lot more cancers.

Although the HERVs in us are non-autonomous, this does not mean that they are completely benign.  Some copies with ORFs can still be transcribed (into RNA) and even fewer copies have their RNA translated into env proteins, gag proteins, and 2 small proteins that are very important in cancer, called Rec and Np9.  

The 2015 publication Human Endogenous Retrovirus Type K (HERV-K) Particles Package and Transmit HERV-K-Related Sequences relates how a retrovirus can spread itself to other cells, although not necessarily creating any pathology: “Retroviruses invaded the genome of human ancestors over the course of millions of years, yet these viruses generally have been inactivated during evolution, with only remnants of these infectious sequences remaining in the human genome. One of these viruses, termed HK2, still is capable of producing virus particles, although these particles have been regarded as being noninfectious. Using a genetic probe derived from HK2, we have discovered that HK2 viruses produced in modern humans can package HK2 sequences and transmit them to various other cells. Furthermore, the genetic sequences packaged in HK2 undergo reverse transcription. The transmitted probe circularized in the cell and failed to integrate into the cellular genome. These findings suggest that modern HK2 viruses can package viral RNA and transmit it to other cells. Contrary to previous views, we provide evidence of an extracellular viral phase of modern HK2 viruses. We have no evidence of sustained, spreading infection.”

One unique “fossil virus” called  HERV-18 can also produce a “superantigen”  which makes your T cells very “angry”.  The expression of HERV-18’s superantigen may be why the exogenous Eptstein Barr Virus (EBV) is able to establish a long-term infection status see in humans.  For the HERV sequence to be transcribed, the fossil viral DNA must have an open reading frame (ORF).  3 families of HERVs still have ORFs (HERV-K, HERV-FRD, and HERV-W).  As a result, proteins from these three classes of HERVs have been detected, including env, gag, rec, Np9, and the HERV-K18 super antigen(ref) The last member of the HERV family of viruses to infect the human genome was the HERV-K(HML-2) subfamily, which makes up 1% of all HERVs.  These did infect the human genome since we  “split” from chimpanzees.  Some copies of HERV-K(HML-2) have been active (i.e. transfecting the human genome) in the past few hundred  thousand years. HERVs with ORFs  use RNA polymerase II (Pol II) to transcribe their DNA.

Reference: 2006 Cutting Edge: Epstein-Barr Virus Transactivates the HERV-K18 Superantigen by Docking to the Human Complement Receptor 2 (CD21) on Primary B Cells

Role of LTRs in HERVs

However, the most important role of HERVs today has nothing to do with transcription or translation.  Instead, it is the role of the “fossil promoter”, called the “LTR” (long terminal repeat), which can function as an “alternative promoter” to activate nearby human genes which is the most important function of HERVs in our DNA.  These LTRs are used in embryonic stem cells to activate “pluripotency programs”, since the LTR promoter has a binding site for OCT4. In the placenta, the envprotein of the HERV-W “fossil virus” is used to trigger cell differentiation. In many diseases, the LTRs are used to activate specific genes, since there are transcription factor binding sites for so many human transcription factors.  In both mice and humans, LTRs play an important role in disease pathogenesis.

However, since LTRs are no longer mobile in humans, no insertional mutagenesis events have been discovered that were due to HERV mobility (Maksakova, 2006).  If HERVs play a role in cancer, it is likely to be via their ability to function as “alternative promoters” for oncogenes or other genes that dysregulate signaling pathways that prevent cancer (i.e. apoptosis, autophagy, DNA repair, etc.).

LTRs and inflammation

LTRs that function as “alternative promoters” may play a major role in inflammaging, since there are many inflammatory transcription factors that can bind to HERV LTRs and activate gene expression.  The link between inflammation, LTRs, and aging has not been clearly proven, however.

LINEs – “Seventeen per cent of the human genome is comprised of ‘parasitic’, repeated DNA segments called LINE-1 elements.  Some of these, occasionally, copy themselves and move to new locations in the genome. More rarely, they will aberrantly pick up a piece of adjacent, non-LINE-1 DNA and copy that to a new site: this is known as LINE-1 transduction(ref)”. There are 850,000 fragments of LINEs left over from evolution, although only about 7,000 of these are intact.  Evolutionary speaking, LINE-1s are very old, first showing up in yeast (C. albicans) about 150 million years ago.   Of the intact copies of LINE-1, only between 80-100 are capable of “self-copying”.  This means LINE-1s have DNA that codes for all the enzymes that allow them to be transcribed into RNA, then be converted back into DNA copies (i.e. reverse transcriptase), and then reintegrate into the genome.

Rodents and humans both have functional copies of LINE-1, so these LINEs are called “autonomous retrotransposons”.   All of the 80-100 functioning “self copy machines” within the human genome are from the LINE-1 (L1) family.  L1s can also copy other TEs, such as Alu or SVA elements.  These two types of TEs are non-autonomous and are completely dependent on the L1 copy machines to be duplicated, then re-inserted into new sites in the human genome.  In addition to copying Alu elements and SVA elements, the functioning L1s can also copy nearby human genes.  This is why as we age, humans become a “genomic mosaic”, where not all of the cells have the same copy number of genes, such as the Amyloid Precursor Protein (APP) gene in the brain.  Genome mosaicism is another fascinating topic that deserves a lot of attention, since it may be one of the major causes of sporadic Alzheimer’s disease.  See Item 14. below

What good are HERVs and LINE-1A today?

Whereas the beneficial, functional role of HERVs today is mostly due to the “repurposing” of the LTR as an “alternative promoter,” the main beneficial, functional role of LINEs in human cells is not as clear.  Although they clearly played a beneficial role in evolution, today they appear to primarily play a role in producing harmful mutations and disease.  For instance, in normal cells, LINEs are very poorly expressed, whereas in cancer cells, L1s are abundantly expressed and decreasing LINE-1 activity in cancer cells reduces cancer cell proliferation and promotes cancer cell differentiation (thereby stopping proliferation).  This diagram illustrates how LINE-1s can spread DNA around in lung cancer cells. One out of every four Line-1 mutations is a transduction, copying of adjacent non-LINE-1 DNA.

Image may be NSFW.
Clik here to view.
LINE1-f

Image source ” In a lung cancer genome, three LINE-1 copies located at human chromosomes 22, 14, and 13 spread non-repetitive DNA by transduction. [DOI: 10.1126/science.1251343]”

There are at least a dozen other diseases besides cancer that have been specifically linked to L1 insertions into cells.  This includes choroideremia, chronic granulomatous disease, X-linked Duchenne muscular dystrophy, Hemophilia A and B, X-linked retinitis pigments, Coffin-Lowry disease, Fukuyama-type congenital muscular dystrophy, beta-thalasemia, and Pyruvate dehydrogenase deficiency.  For the above reasons, a great amount of attention has been made towards understanding how to silence LINE-1 expression in human cells.

Alu SINE – Alu elements are “copiers that borrow their copy machine“.   The Alu transposable element was named for the Alu Arthrobacter luteus restriction endonuclease enzyme.  Alu is part of the family of Short Interspersed Nuclear Elements (SINEs) that is evolutionarily derived from a mutated copy of a small cytoplasmic 7SL RNA, which is a part of the signal recognition particle.  Alu is a primate-specific transposable element.

Unlike HERVs or LINEs, none of the Alu DNA sequence codes for proteins.  This makes it a non-autonomous TE, which must use the L1 “copy machine” to duplicate itself.   Despite those limitations, Alu elements have been twice as successful as L1 TEs in producing copies of  themselves (1.4-2 million vs 850,000 copies), even though LINE-1 is a much older TE, in terms of evolution (150 million years vs 65-80 million years).  This makes the Alu element  “ the most successful copier” in mammalian history, based on copy number. “How did primates get to begat so many other primates eventually begatting us?”  Was it due to the Alus?  What is clear is that Alu elements have developed many important, indispensable molecular roles in primate evolution (Ex: RNA editing, gene expression regulation, etc.), especially in the evolution of the primate brain.

The “evolutionary success in copying rate” of Alu  has been attributed to “retrotransposition efficiency”, post-insertional evolutionary selection, or both.  The retrotransposition efficiency of Alu elements may be due in part to the fact that they only require ORF2 in the LINE-1 copy genes, whereas LINE-1 copying requires both ORF1 and ORF2 to successfully undergo retrotranspostion.  There are more L1s in the human genome with intact ORF2s than there are L1 copies with intact ORF1s (i.e. the old, “partially broken copy machines” can still copy Alu elements).

Alu elements also have deleterious effects in humans, with mutagenic effects and a role in diseases.  Alu element copying can introduce insertions and deletions in genes, and have been shown to cause insertions in 33 genes, producing many more diseases than associated with LINE-1 insertions.  The Alu insertion-induced diseases include breast cancer, Hemophilia A and B, Muckle-Wells syndrome, chronic hemolytic anemia, cholinesterase deficiency, type 1 antithrombin deficiency, cystic fibrosis, mucolipidosis type II, Walker Warburg syndrome, Apert syndrome, Ewing’s sarcoma, familial hypercholesterolemia, hemophilia, neurofibromatosis, diabetes type II, and may also play a role in Alzheimer’s disease, lung cancer, and gastric cancer.

This Table showing various possible Alu LI and SVA insertions and the associated diseases is from the  reference:  (Belancio, et.al, 2008) Mammalian non-LTR retrotransposons: For better or worse, in sickness and in health.

Image may be NSFW.
Clik here to view.

An important role for Alu elements is in the regulation (or dysregulation) of microRNAs. Recently it was shown that as much as 20% of all known human microRNAs are driven by Alu Pol III promoters.  Dysregulation of microRNAs is a ubiquitous feature of cancer.

SVAs – SVAs are chimeras that are “hominid-specific.”  SVAs are an uncommon type of TE found in humans that are “very young” in terms of evolution.    Less than 3,000 copies of SVAs exist in the human genome and they appear to have played a recent role in the evolution of our ancestors.  SVAs started integrating into the hominid genome about 25 million years ago and are not found in old-world monkeys.   They may have been key in giving homonid evolution a final boost and putting us over the top as homo sapiens.

From their DNA sequence, SVAs look like a chimera, a hybrid of several structures, which makes them difficult to classify.  Some call them a successful “pseudogene”, whereas others classify them as a retrotransposon (i.e. a TE).   They are part of the SINE family and are non-autonomous, so they have to use the L1 “self-copy machine” to replicate and reintegrate.  The acronym SVA stands for SINE VNTR Alusince this TE has a Variable Number of GC-rich Tandem Repeats (VNTR) and a sequence that is similar to two anti-sense Alu fragments.  In addition, the SVA also has a DNA sequence that is very similar to the HERV-K env gene and the right LTR sequence of the HERV-K10 “fossil virus”.

Although it is clear that SVAs played a role in hominid evolution, no current beneficial, functional role for SVAs has been identified in humans.  They have been found to induce insertional mutations and deletions of genomic material, playing a role in at least 7 diseases (leukemia, neurofibromatosis 2, X-linked agammaglobulinemia, Hereditary elliptocytosis and pyropoikilocytosis, X-linked dystonia-parkinsonism, Autosomal Recessive Hypercholesterolemia, and Fukayama-type muscular dystrophy,

Reference: (Hancks, Kazaian, 2010). 2010 SVA retrotransposons: Evolution and genetic instability  “SVAs are currently active and may impact the host through a variety of mechanisms including insertional mutagenesis, exon shuffling, alternative splicing, and the generation of differentially methylated regions (DMR).”

Here is another depiction of the different kinds of TEs with a legend commenting on their characteristics:

Image may be NSFW.
Clik here to view.
LINE1-b

Image and legend source    “Types of transposable element. DNA transposons such as the Mariner-like elements in mammalian genomes are inactive relics of mobile DNAs that transpose directly. They encode a transposase activity that mediates their excision from, and integration into, DNA. Retrotransposons transpose via an RNA intermediate that is converted by a reverse transcriptase (RT) into a DNA that is integrated into the host-cell genome. Retrotransposons that contain many (but not all) of the activities necessary for their mobility are called autonomous. They comprise the endogenous retroviruses (ERVs), which are characterized by (a) long terminal repeats (LTRs) and (b) the LINEs, which are non-LTR retrotransposons. Of the LINES, only the L1 group is known to be actively mobile in eutherian mammals. R2 is a site-specific element that is active in insects and is the element studied by Eickbush and Eickbush [5]. Non-autonomous elements, such as Alu and SVAs, are dependent on L1 for their mobility. Processed pseudogenes derive from spliced RNAs that are copied and inserted in the genome by the L1s. Mariner: DR, direct repeat (in the host-cell DNA); ITR, inverted terminal repeat. ERV: TSD, target-site duplication (in the host cell DNA); LTR, long terminal repeat; Pol, RNA-dependent DNA polymerase with a reverse transcriptase (RT) domain and an integrase (INT) domain; Env, Gag and Prt encode other proteins required for the virus life cycle. LINE: EN, endonuclease domain; RT, reverse transcriptase domain; C, zinc knuckle domain; DB, DNA binding; An, poly(A). SINE: A/B, A- and B-box PolIII promoter.”

Summary:  Alus are the most successful “copiers”, and also have been linked to the highest number of diseases caused by insertional mutations of specific genes.  SVAs are the most recent “copiers,” are the least common, and have been linked to the fewest number of diseases caused by insertional mutagenesis of specific genes.  LTR retrotransposons are no longer active in the human genome, whereas they are still mobile in rodents (mice and rats).  This means they play no role in insertional mutagenesis in cancer in humans, whereas ERVs may play a major role of insertional mutagenesis in rodents.

LINE-1s are the only class of TEs with copy machines that still work in humans, with only 80-100 copy machines still running.  However there are another 100 or so where only ORF2 works.  Only ORF2 is needed to copy Alu elements.  This may be one reason there are twice as many Alus as LINEs in humans.

Alus have played a crucial role in primate evolution and continue to play a role in human evolution, since an additional 7,000 copies of AluY have been inserted into the human genome since we “split” from our common ancestor with chimpanzees.  In addition to their role in evolution and disease, Alus have clearly been genetically “repurposed” to play many vital roles in gene development, RNA editing, gene regulation, and microRNA regulation.  As a race, humans owe a debt of gratitude to this 300 bp piece of DNA that has copied itself over a million times in our genomes.  Without it, we would look much more like our mammalian primate and non-primate relatives.

2. Short-lived organisms are more permissive to retrotransposition, whereas long-lived organisms are resistant to retrotranspostion.

Compared to humans, mice have a 100-fold higher rate of mutations caused by retrotransposon insertions (10% vs 0.1-3%). This is the strongest line of evidence that the ability of an organism to repress TEs correlates with lifespan.  99.9% of TEs in humans are incapable of retrotransposition.  This fact is the second strongest line of evidence that “mobile-capableTE expression” in the genome correlates negatively with life span.  

Retrotransposable element insertions into the human genome are 20 times more numerous, per unit of DNA, when compared to retrotransposable element insertions into the fruit fly genome (Drosophila melanogaster).  Despite this high rate of TE integration in humans, we have very low rates of TE activity.  In fruit flies, these TEs are subject to constant turnover (new insertions of TE and elimination by natural selection, i.e. death of the organism) (Eickbush, Furano, 2002 Fruit flies and humans respond differently to retrotransposons).  In fruit flies (D. melanogaster), only 12% of genomic DNA consists of transposable elements, yet more than 50% of de novo mutations arise from these transposable elements.  (Eickbush, Furano, 2002)(Bartolome, et al, 2002  On the Abundance and Distribution of Transposable Elements in the Genome ofDrosophila melanogaster).

This is thought to be due to the fact that TEs are very mobile in fruit flies.  In mice, 37% of genomic DNA consists of transposable elements, but only 10% of all de novo mutations in mice are due to TE activity.  This reduction in the percentage of mutations due to TEs parallels the reduction in TE mobility in mice, compared to fruit flies.  So there appears to be a consistent trend illustrated in this comparison of fruit flys, mice and humans.

In humans, the same trend occurs.  Approximately 45% of genomic DNA in humans is comprised of TE sequences, yet it has been estimated that only 0.3% of de novo mutations in human cells are due to TE activity (Deininger, Batzer, 1999 Alu Repeats and Human Disease). Compared to mice, TEs  in humans are much less  mobile (Belancio, et.al., 2008) (Maksakova, et al, 2006 Retroviral Elements and Their Hosts: Insertional Mutagenesis in the Mouse Germ Line).   Perhaps the most important point here, however is that LTR retrotransposons are no longer mobile in the human genome and as a consequence, they do not produce gene mutations by TE insertions.  Likewise, although there are 850,000 fragments of LINEs in the human genome, only 80-100 contain functional ORF1 and ORF2 segments. As a consequence, 99.9% of the TEs in the human genome can no longer produce mutations.

So there appears to be a consistent trend illustrated in this comparison of fruit flies, mice and humans.  As the organisms get more advanced and sophisticated there are larger percentages of TEs in the genomes but the TEs become much less active and capable of inducing mutations.

TE silencing mechanisms are also much more complex in human cells, with many more layers of repressive molecular mechanisms, compared to more primitive organisms.  This includes histone biotinylation, histone trimethylation, histone deacetylation, DNA methylation, siRNA-mediated degradation of TEs, and PIWI-piRNA pathway degradation of TEs.  These multiple layers of TE suppression at the transcriptional and post-transcriptional level is clearly an additional reason why humans have less TE activity, compared to Drosophila and other lower organisms.

Conclusion:  TE activity is low in human somatic cells, compared to mice, fruit flies, nematodes, and yeast.  Paradoxically, the sheer DNA content (as a percentage) of TEs does not vary directly with TE activity.  Instead, there seems to be an inverse relationship that cannot be easily explained.

One possible explanation is that fewer copies of the TEs are still functional and active in humans.  This is clear for the LTR retrotransposons, which are still active in rodents  but no longer capable of transposition in humans.  However, the more extensive silencing mechanisms in humans is more likely to explain the paradox of TE content and TE activity in humans vs fruit flys or mice.

3. Human Gene Transcription or Repression can be triggered from the anti-sense promoters of LINE-1 and from the bidirectional LTRs of old HERV sequences – This may be how non-coding genes evolved, since they are often transcribed off of the anti-sense strand of DNA.

A major flaw in the classical “Watson-Crick model” of gene expression is the widely held belief that genes are primarily regulated by transcription factors binding to classical promoter regions found near the transcription start sites of genes.  Whereas this concept is valid, many sequences of DNA upstream and downstream from these canonical promoters can affect gene transcription.   Specifically, the structure of the 5′-UTR region of L1 contains both a “sense promoter” (SP) and an “anti-sense promoter” (ASP).  (If you need to refresh your understanding of mRNA structures, this publication explains how they are organized, the elements in them including UTRs and ORFs. and possible post-transcription regulatory functions of the UTR elements on gene expression.)  These two promoters allows the LINE-1 TE to be transcribed from the SP and an upstream human gene to be transcribed from the ASP.  This is likely to be an important mechanism for intergenic, long noncoding RNA genes to be transcribed.  Here is a diagram illustrating this:

Image may be NSFW.
Clik here to view.
LINE1-1

Image reference: 2002 Many Human Genes Are Transcribed from the Antisense Promoter of L1 Retrotransposon

In a query of an expressed sequence tag (EST) database of GenBank, using RepeatMasker, researchers found 23 cESTs which could be driven by L1 antisense promoters in normal cells.  In tumor cells, an additional 19 cESTs were found in cell lines from teratocarcinomas, colon cancers, prostate cancers, liposarcomas, ovarian cancers, and B-cell tumors.  Moreover, in many more cases, they found full length LINEs within introns of genes that allowed for the adjacent human gene to be transcribed from the anti-sense L1 promoter. Their conclusion was that although gene activation could occur from a perfectly placed anti-sense L1 promoter, in the majority of cases, the L1 anti-sense promoter down regulated the gene expression of the nearby gene by producing only a partial transcript of the gene or by silencing the entire gene.

Reference: 2002 Many Human Genes Are Transcribed from the Antisense Promoter of L1 Retrotransposon

4.  TEs and inflammation

Promoter sequences from L1 and Alu elements can also be used to trigger inflammatory pathways.  A recent study showed that the IFN-gamma gene can only be maximally activated with an alternative promoter, derived from Alu and LTR families of TEs.

2009 The role of transposable elements in the regulation of IFN-λ1 gene expression “Studies of virus induction of IFN-λ1 identified an essential role of IFN regulatory factors (IRF) 3 and 7, which bind to a regulatory DNA sequence near the start site of transcription. Here, we report that the proximal promoter region of the IFN-λ1 regulatory region is not sufficient for maximal gene induction in response to bacterial LPS, and we identify an essential cluster of homotypic NF-κB binding sites. Remarkably, these sites, which bind efficiently to NF-κB and function independently of the IRF3/7 binding sites, originate as transposable elements of the Alu and LTR families. We also show that depletion of the NF-κB RelA protein significantly reduces the level of the IFN-λ1 gene expression. We conclude that IFN-λ1 gene expression requires NF-κB, and we propose a model for IFN-λ1 gene regulation, in which IRF and NF-κB activate gene expression independently via spatially separated promoter elements. These observations provide insights into the independent evolution of the IFN-λ1 and IFN-β promoters and directly implicate transposable elements in the regulation of the IFN-λ1 gene by NF-κB.”

5.  Bidirectional promoters and diseases

LTRs can also function as bidirectional promoters, activating transcription in both directions. The best know examples of this is the activation of expression of GSDML by an LTR promoter, which can be activated by an LTR transposon. This causes chronic myeloid leukemia and four other cancers.  Another example involves the genes involved with autoimmune disease – HLA-DQB1*04 and HLA-DRB1*04. A nearby LTR sequence can function as an “alternative promoter” and activate these genes in rheumatoid arthritis.  A LTR sequence near another HLA-DQ gene can activate this autoimmune gene in type 2 diabetes.

See the 1993 publication Expression of human endogenous retrovirus (HERV-K) in chronic myeloid leukemia “We have previously demonstrated the presence of a reverse transcriptase-like enzyme in retroviral particles from patients with essential thrombocythemia, polycythemia vera, and chronic myelogenous leukemia. It was subsequently shown that the human genome contains 50 copies of HERV-K. HERV-K is a human endogenous class I retroviral element that contains gag, pol, and env open reading frames. Using both reverse transcriptase-polymerase chain reaction and ribonuclease protection assays, it is demonstrated that the HERV-K pol is expressed in human blood leukocytes. The data indicates that this expression is restricted in CML white cells and is the result of gene regulation.”

References:

2010 A role for human endogenous retrovirus-K (HML-2) in rheumatoid arthritis: investigating mechanisms of pathogenesis. “The significant variation in RA patients, both serologically and transcriptionally, may be an indication that RA is an umbrella term for a number of separate disease entities, of which particular HERV polymorphisms may play a role in development.”

1999 An endogenous retroviral long terminal repeat at the HLA-DQB1 gene locus confers susceptibility to rheumatoid arthritis

2003 The IDDM-associated solitary retroviral promoters DQ-LTR3 and DQ-LTR13 have a distinct impact on the expression of selected DQB1 genes in different cell lines in vitro

2009 The role of transposable elements in the regulation of IFN-λ1 gene expression

LTRs can also down-regulate nearby human genes.  In Schizophrenia, a nearby LTR can down regulate the GABBR1 gene, which encodes for the GABA receptor.  Male infertility can also be cause by a mutation in a gene found on the Y chromosome, AZFa, which results in a loss of function of this gene.

References:

2013 GABBR1 has a HERV-W LTR in its regulatory region – a possible implication for schizophrenia

2000 Two long homologous retroviral sequence blocks in proximal Yq11 cause AZFa microdeletions as a result of intrachromosomal recombination events

LTRs can also result in mislocalization of a protein.  Although the exact mechanism is not clear, this may involve the deletion or alteration of a nuclear localization sequence on the gene.  This may be the case with certain cases of Amyotrophic lateral sclerosis (ALS), where LTR activation causes TDP-43 mislocalization to the cytoplasm, rather than the cell nucleus:

Reference: 2011 Identification of active loci of a human endogenous retrovirus in neurons of patients with amyotrophic lateral sclerosis

Summary:  There is a small, but well-documented role for the effects of L1 promoter and LTR sequences from old HERVs on human gene expression.

Because the promoters for LINE-1 non-LTR retrotransposons and LTR retrotransposons can induce bidirectional gene expression.  The sense strand usually triggers transcription of the retrotransposon, whereas the anti-sense strand promoter can initiate gene expression of an “upstream” human gene.  This includes genes that can be activated by the antisense promoter, genes that can be silenced by the upstream promoter, and gene products that loose either part or all of the functionality.

6. SIRT6 “vacates” L1 promoters with aging, allowing L1 expression to occur in old age

Turning to the highly practical, SIRT6 is one of the major mechanisms of suppressing LINE-1 expression.  SIRT6 ribosylates KAP1, a nuclear corepressor protein,  and facilitates KAP1 interaction with heterochromatin factor 1 alpha (HP1a).  This silences LINE-1 retrotransposons.  SIRT6 binds to a site in the 5′-UTR region of the L1 retrotransposon, thereby inhibiting transcription of the TE.

From Wrangling Retrotransposons (2015): “Specifically, SIRT6 binds to the L1 5′ UTR, where it coordinates the assembly of heterochromatin proteins at the L1 promoter. Once assembled, this silencing machinery saturates the L1 5′ UTR and its associated chromatin with epigenetic modifications that prevent the retrotransposon from being expressed. — Without the ability to express itself, L1 cannot synthesize the parasitic machinery required to initiate its own replication. As a result, the host cell is protected from de novo mutagenesis events. Additionally, because the L1 is heterochromatinized, it has limited ability to interfere with host gene expression or to induce erroneous recombination events. When SIRT6 is deleted from mouse cells or knocked down in human cells, the L1 5′ UTR escapes heterochomatinization, resulting in massive increases in L1 transcription and de novo L1 insertions.”

Unfortunately, this does not necessarily work so well with aging. SIRT6 becomes depleted from the L1 5′ UTR in the course of aging. A consequence is the de-heterochromatinization of the L1 element allowing that element to become transcriptionally active. This has been seen in senescent human cells as well as in multiple tissues of aging mice.

A related issue is that when double-stranded DNA damage occurs, SIRT6 “runs away” like an ambulance chaser to the site of the DNA damage.  When SIRT6 “runs away”, this leaves the L1 5′-UTR region “naked”, and then transcription of the two open reading frames (ORF1 and ORF2) of the LINE-1 element can occur.  Unfortunately, many copies of L1 are typically produced by this.  As a result, the cells either “age” and become senescent or they die. Both oxidative stress and aging trigger this molecular mechanism. Later, we mention how in aging keeping up the amount of NAD+ and maintaining a high NAD/NADH ratio can provide an adequate supply of SIRT6 and avert this.

Reference:  2014 SIRT6 represses LINE1 retrotransposons by ribosylating ​KAP1 but this repression fails with stress and age

Here is an illustration which shows how SIRT6 “relocalizes” to a site where DNA damage is occurring.

Image may be NSFW.
Clik here to view.
LINE1-2

As a result, it leaves the ORF1 “naked”, allowing the L1 retrotransposon to be transcribed by RNA Polymerase.  This is why “we are screwed” by low NAD levels and low NAD/NADH ratios.

Unfortunately, Resveratrol and Glaxo-Smith-Kline’s synthetic STAC activators do NOT activate SIRT6 like they do SIRT1.  Neither does pterostilbene, curcumin, EGCG, and other polyphenols.  If we want to have enough SIRT6 around to keep or L1 TEs silent we need to pay attention to our NAD levels and NAD/NADH ratios.  You can check out our recent four-part series of blog entries regarding the NAD world (ref)(ref)(ref)( ref).

Reference 2014 SIRT6 represses LINE1 retrotransposons by ribosylating ​KAP1 but this repression fails with stress and age

Here is the on the difference between L1 expression in young cells and old cells in the brain, liver, and heart;

Image may be NSFW.
Clik here to view.
LINE1-3

Illustration reference:  2014 SIRT6 represses LINE1 retrotransposons by ribosylating ​KAP1 but this repression fails with stress and age  Fig. 4

Here is the data that shows how SIRT6 stops sitting on the L1 promoter, allowing L1 expression to occur.

Image may be NSFW.
Clik here to view.
LINE1-4

References: 2014 SIRT6 represses LINE1 retrotransposons by ribosylating ​KAP1 but this repression fails with stress and age

7.  Inflammation triggers transposable element expression

– diseases with inflammation show high levels of expression of L1 ORF2 and L1ORF2 transcripts.  Models of Skin inflammation can also be created by triggering DNA transposon-directed inflammatory pathways.  

There is strong evidence that chronic inflammation triggers TE transcription in both plants and animals, along with heat shock, oxidative and other stresses. In humans, this has been documented in several diseases, including rheumatoid arthritis.  This is all consistent with points made earlier about stresses and TE expression

Here is an illustration from Capy, et al, in Nature, 2000 Stress and transposable elements: co-evolution or useful parasites?

Image may be NSFW.
Clik here to view.
LINE1-5

References:

2000 “Stress and transposable elements: co-evolution or useful parasites?

1997 The expression of the tobacco Tnt1 retrotransposon is linked to plant defense responses 

1992 Induction of the mobile genetic element Dm-412 transpositions in the Drosophila genome by heat shock treatment  “Males of a Drosophila melanogaster isogenic line with a mutation of the major gene for radius incompletus (ri) were treated by standard light heat shock (37 degrees C for 90 min) and by heavy heat shock (transfer of males from 37 degrees C for 2 hr to 4 degrees C for 1 hr and back; this procedure was repeated three times). In the F1 generation of treated males mated with nontreated females of the same isogenic line, mass transpositions of copia-like mobile genetic element Dm-412 were found. The altered positions of the element seem nonrandom; five “hot spots” of transposition were found. Probabilities of transpositions were estimated after light heat shock and heavy heat shock and in the control sample. These probabilities were, respectively, 3.4 x 10(-2), 8.7 x 10(-2), and less than 4.1 x 10(-4) transpositions per genome per occupied position per generation. Therefore, as a result of heat shock treatment, the probabilities of transpositions were two orders of magnitude greater than those of the control sample in the next generation after induction. Comparison of the results with those after stepwise temperature treatment shows that the induction depends on the intensity of the stress action (temperature treatment) rather than on the type of the stress action.”

2001 Retrotransposable L1 elements expressed in rheumatoid arthritis synovial tissue: Association with genomic DNA hypomethylation and influence on gene expression

2011 Development of Transgenic Cloned Pig Models of Skin Inflammation by DNA Transposon-Directed Ectopic Expression of Human β1 and α2 Integrin

2012 Epigenetic Epidemiology of Inflammation and Rheumatoid Arthritis

2013 Association between blood pressure and DNA methylation of retrotransposons and pro-inflammatory genes  Some of the conclusions of this study are of general interest “Results: An increase in inter-quartile range (IQR) in the methylation of Alu elements was associated with an increase of 0.97 mm Hg in diastolic blood pressure (DBP) (95% CI 0.32–1.57), but no such association was observed for long interspersed nuclear element-1 (LINE-1). We also found positive associations between DBP and methylation of the genes for toll-like receptor 2 (TLR2) and inducible nitric oxide synthase (iNOS), and a negative association between DBP and methylation of the gene for interferon-γ (IFN-γ). Associations between methylation and systolic blood pressure (SBP) were weaker than those between methylation and DBP. Bayesian mixed-effects structural equation model results were similar for both DBP and SBP models.  — Conclusions: The results of our study suggest that changes in DNA methylation of some pro-inflammatory genes and retrotransposable elements are related to small changes in BP.”  It is unclear whether the association represents causality in either direction.

2008 Epigenetic Regulation of Inflammatory Response and Relevance eo Common Diseses

1994 Genome and stresses: Reactions against aggressions, behavior of transposable elements

8.  Germ lines and stem cells are protected against TE expression role of the Piwi proteins and piRNA pathways

Since TEs can wreak so much genetic havoc, evolution has had to provide mechanisms to keep germline cells so that the germline can remain relatively constant from generation to generation.  Likewise, stem cells that may be needed to replace somatic cells require protection.  It appears that in a number of species silencing TEs in such cells is in part or in whole accomplished by expression of Piwi proteins.

The 2011 publication Uniting germline and stem cells: the function of Piwi proteins and the piRNA pathway in diverse organisms relates “The topipotency of the germline is the full manifestation of the pluri- and multipotency of embryonic and adult stem cells, thus the germline and stem cells must share common mechanisms that guarantee their multipotentials in development. One of the few such known shared mechanisms is represented by Piwi proteins, which constitute one of the two subfamilies of the Argonaute protein family. Piwi proteins bind to Piwi-interacting RNAs (piRNAs) that are generally 26 to 31 nucleotides in length. Both Piwi proteins and piRNAs are most abundantly expressed in the germline. Moreover, Piwi proteins are expressed broadly in certain types of somatic stem/progenitor cells and other somatic cells across animal phylogeny. Recent studies indicate that the Piwi-piRNA pathway mediates epigenetic programming and posttranscriptional regulation, which may be responsible for its function in germline specification, gametogenesis, stem cell maintenance, transposon silencing, and genome integrity in diverse organisms.”

The 2014 publication 2014 Homeland security in the C. elegans germ line: insights into the biogenesis and function of piRNAs relates: While most eukaryotic genomes contain transposable elements that can provide select evolutionary advantages to a given organism, failure to tightly control the mobility of such transposable elements can result in compromised genomic integrity of both parental and subsequent generations. Together with the Piwi subfamily of Argonaute proteins, small, non-coding Piwi-interacting RNAs (piRNAs) primarily function in the germ line to defend the genome against the potentially deleterious effects that can be caused by transposition. Here, we describe recent discoveries concerning the biogenesis and function of piRNAs in the nematode Caenorhabditis elegans, illuminating how the faithful production of these mature species can impart a robust defense mechanism for the germ line to counteract problems caused by foreign genetic elements across successive generations by contributing to the epigenetic memory of non-self vs. self.”

The piRNA pathway is active in us as well as in c-elegans and fruit flies.  The 2014 publication Piwi is required in multiple cell types to control germline stem cell lineage development in the Drosophila ovary  reports “The piRNA pathway plays an important role in maintaining genome stability in the germ line by silencing transposable elements (TEs) from fly to mammals. As a highly conserved piRNA pathway component, Piwi is widely expressed in both germ cells and somatic cells in the Drosophila ovary and is required for piRNA production in both cell types. In addition to its known role in somatic cap cells to maintain germline stem cells (GSCs), this study has demonstrated that Piwi has novel functions in somatic cells and germ cells of the Drosophila ovary to promote germ cell differentiation. — This study has revealed new germline requirement of Piwi in controlling GSC maintenance and lineage differentiation as well as its new somatic function in promoting germ cell differentiation. Therefore, Piwi is required in multiple cell types to control GSC lineage development in the Drosophila.

Piwi seems to work via surveillance of the genome for extraneous DNA, epigenetically silencing it when it sees it.

Addittional references

2014 Silent no more: Endogenous small RNA pathways promote gene expression.  “Endogenous small RNA pathways related to RNA interference (RNAi) play a well-documented role in protecting host genomes from the invasion of foreign nucleic acids. In C. elegans, the PIWI type Argonaute, PRG-1, through an association with 21U-RNAs, mediates a genome surveillance process by constantly scanning the genome for potentially deleterious invading elements. Upon recognition of foreign nucleic acids, PRG-1 initiates a cascade of cytoplasmic and nuclear events that results in heritable epigenetic silencing of these transcripts and their coding genomic loci. If the PRG-1/21U-RNA genome surveillance pathway has the capacity to target most of the C. elegans transcriptome, what mechanisms exist to protect endogenous transcripts from being silenced by this pathway? In this commentary, we discuss three recent publications that implicate the CSR-1 small RNA pathway in the heritable activation of germline transcripts, propose a model as to why not all epialleles behave similarly, and touch on the practical implications of these findings.”

2012 Function, targets and evolution of Caenorhabditis elegans piRNAs

2008 Piwi and piRNAs Act Upstream of an Endogenous siRNA Pathway to suppress Tc3 Transposon Mobility in the Caenorhabditis elegans germline

2015 piRNAs and piRNA-Dependent siRNAs Protect Conserved and Essential C. elegans Genes from Misrouting into the RNAi Pathway   “piRNAs silence foreign genes, such as transposons, to preserve genome integrity, but they also target endogenous mRNAs by mechanisms that are poorly understood. Caenorhabditis elegans piRNAs interact with both transposon and nontransposon mRNAs to initiate sustained silencing via the RNAi pathway. To assess the dysregulation of gene silencing caused by lack of piRNAs, we restored RNA silencing in RNAi-defective animals in the presence or absence of piRNAs. In the absence of piRNAs and a cellular memory of piRNA activity, essential and conserved genes are misrouted into the RNAi pathway to produce siRNAs that bind the nuclear Argonaute HRDE-1, resulting in dramatic defects in germ cell proliferation and function such that the animals are sterile. Inactivation of RNAi suppresses sterility, indicating that aberrant siRNAs produced in the absence of piRNAs target essential genes for silencing. Thus, by reanimating RNAi, we uncovered a role for piRNAs in protecting essential genes from RNA silencing.”

2013 Biology and Mechanisms of Short RNAs in Caenorhabditis elegans

2012 Extremely stable Piwi-induced gene silencing in Caenorhabditis elegans “In recent years, the Piwi pathway has been shown to regulate the silencing of mobile genetic elements. However, we know little about how Piwi pathways impose silencing and even less about trans-generational stability of Piwi-induced silencing. We demonstrate that the Caenorhabditis elegans Piwi protein PRG-1 can initiate an extremely stable form of gene silencing on a transgenic, single-copy target. This type of silencing is faithfully maintained over tens of generations in the absence of a functional Piwi pathway. Interestingly, RNAi can also trigger permanent gene silencing of a single-copy transgene and the phenomenon will be collectively referred to as RNA-induced epigenetic silencing (RNAe). RNAe can act in trans and is dependent on endogenous RNAi factors. The involvement of factors known to act in nuclear RNAi and the fact that RNAe is accompanied by repressive chromatin marks indicate that RNAe includes a transcriptional silencing component. Our results demonstrate that, at least in C. elegans, the Piwi pathway can impose a state of gene silencing that borders on ‘permanently silent’. Such a property may be more widely conserved among Piwi pathways in different animals.”

9. Knocking out the Insulin/IGF pathway in C. elegans silences transposons by RNAi,

Piwi-piRNA pathway, and by TDP-1

As observed above, nematodes contain transposable elements in their genome.  Like humans, they have the Piwi-piRNA pathway which silences transposons.  Defects in the Piwi/piRNA pathway lead to the re-expression of transposons and immediate sterility.   Although there are many reasons that have been proposed for why genetic blockade of the Insulin/IGF-1 pathway increase life span in all organisms studied to date, the main explanation that has been given for the benefit of this intervention has been the nuclear localization  of the FOXO3a transcription factor (in humans) or the nuclear localization of DAF-16 in C.  elegans (the nematode version of FOXO3a).  The targets of FOXO3a transcription factor include apoptosis genes and genes that promote cellular resistance to oxidative stress and other cell stressors.

In addition, knocking out the Insulin/IGF-1 pathway promotes retrotransposon silencing via two RNA-based methods.

·       The first RNA-based method of slicing transposons found to be activated by fasting or Insulin/IGF-1 genetic knockout was the Piwi-piRNA pathway.  This was controlled by the gene prg-1. 

·       However a recent paper from UNC, Chapel Hill  showed that reduced insulin/IGF-1 signaling promoted germ cell immortality via a 2nd pathway, involving RNAI methods.  In these studies, they “knocked out” prg-1 gene in C. elegans, and now these prg-1 mutants could not “turn on” the Piwi/piRNA pathway.  However, these cells were still able to repress transposon expression by the RNAi pathway.  Here is a diagram of how this works:

Image may be NSFW.
Clik here to view.
Figure thumbnail fx1

Illustration reference: 2014 Reduced Insulin/IGF-1 Signaling Restores Germ Cell Immortality toCaenorhabditis elegans Piwi Mutants

This study showed that there was more than one way of silencing transposons in C. elegans and demonstrated the health benefits of fasting.  They found that brief periods of starvation in C. elegans  extended the transgenerational lifespan of prg-1 mutants by stimulating the DAF-16 (FoxO) transcription factor.  Constitutive activation of DAF-16 by fasting immortalized germ  line cells by silencing repetitive elements (repeats and transposons) via RNAi proteins in these prg-1 mutants (i.e. the RNAi pathway that is parallel to the Piwi-piRNA pathway) as well as by histone H3K4 demethylase activation.

Again, reference: 2014 Reduced Insulin/IGF-1 Signaling Restores Germ Cell Immortality toCaenorhabditis elegans Piwi Mutants

So, down-regulating the Insulin/IGF-1 pathway may have a completely independent way of dealing with transposable elements that has nothing to do with RNAi or the Piwi-piRNA pathway.  This involves TDP-1 (TDP-43 in humans), a pathway that is “broken” in patients with familial ALS.  DAF-16 (FoxO) up regulates the tdp-1 gene in C. elegans.  TDP-1 is a DNA binding protein implicated in several neurodegenerative diseases, but exactly how it works is not clear.  What is clear is that it is upregulated by heat stress and DAF-16 (i.e. down regulating the Insulin/IGF-1 pathway).

Here are some additional references on this:

2012 TDP-1/TDP-43 Regulates Stress Signaling and Age-Dependent Proteotoxicity in Caenorhabditis elegans

2011 TDP-43 neurotoxicity and protein aggregation modulated by heat shock factor and insulin/IGF-1 signaling

In another study, researchers found that the C. elegans ortholog to the human TDP-43 was also involved with preventing the accumulation of double stranded RNA in C. elegans.  TDP-43 is a nuclear protein in human cells, but “gets stuck” in the cytoplasm of patients with familial ALS and FTD/ALS spectrum disorders.  As a consequence they develop frontotemporal dementia and amyotrophic lateral sclerossis.  In C. elegans, TDP-1 is also found in the nucleus and it prevents dsRNA from accumulating, reduces the frequency of A-to-I editing, and promotes the degradation of dsRNA.  Here is an illustration of this in human cells (TDP-43 function):

Image may be NSFW.
Clik here to view.
Embedded Image

Image source:  2014 TDP1, the Caenorhabditis elegans ortholog of TDP43, limits the accumulation of doublestranded RNA

More references:

2012 TDP-1/TDP-43 Regulates Stress Signaling and Age-Dependent Proteotoxicity in Caenorhabditis elegans

2014 RNA-Processing Protein TDP-43 Regulates FOXO-Dependent Protein Quality Control in Stress Response

Conclusion:  The evidence is overwhelming – down regulating the Insulin/IGF-1 pathway suppresses transposable element expression and increases the degradation of double-stranded RNA molecules from endogenous retroviral expression (ERV) and from exogenous retroviruses.  There are two of these pathways that are dependent on small RNAs – the RNAi pathway and the Piwi-piRNA pathway.  Fasting and caloric restriction work via both of these.  In addition, the TDP-1 DNA binding protein also works to limit the accumulation of double stranded RNA molecules within cells.  In humans, the TDP-1 ortholog is TDP-43, which is implicated in familial FTD/ALS.  Thus targeting the insulin/IGF-1 pathway in humans may help with preventing ALS and other similar diseases like Frontotemporal Dementia by reducing transposable element expression.

10. Transposable element endonuclease (ORF2) induces double stranded DNA breaks (DSBs) via endonuclease “nicking” of DNA This is a mechanism of DNA damage independent from the oxidative stress-based free radical theory of aging.  TE endonucleases do not require ROS to damage DNA and produce DSBs.  This may in part explain why anti-oxidant drugs and supplements failed to “cure” or slow down aging.

Whereas most of the discussion up to this point has centered around insertional mutagenesis of transposable elements, there is a completely different mechanism by which TEs can cause aging and cancer.  In the 2nd open reading frame (ORF2) of LINE-1, there is an endonuclease domain (EN) that is responsible for breaking genomic DNA.  This enzyme is necessary for re-integrating the L1 transcript after it undergoes reverse transcriptase processing.  You can think of the endonuclease as being like an ice pick.  Unfortunately, every re-integration attempt by the L1 endonuclease produces multiple “nicks” in the DNA.  Some of these “nicks” are single stranded DNA breaks (SSBs) but some are double stranded DNA breaks (DSBs).

This of course triggers the DNA damage response and harnesses the SSB repair pathways or the DSB repair pathways, which includes the hyper activation of PARPs, which use up prodigious amounts of SIRT1, NAD and ATP.  Thus a “vicious cycle” of “nicks, SSBs, and DSBs” occurs when LINE-1 ORF2 endonuclease is produced.

Because of this “inefficient nicking” system of the ORF2 endonuclease, some experts have estimated that there are 10-100 times more frequent DSBs cause by L1 activity than there are de novo L1 integration events (Gasior, et al, 2006 The Human LINE-1 Retrotransposon Creates DNA Double-strand Breaks). Specifically, they show evidence that L1 activity may be responsible for 0.4 to 7 double stranded DNA breaks per cell.  If so, this implicates L1 activity as a major cause of aging, not due to insertional mutagenesis but due to  L1 activity-induced DSBs.  

Note that this mechanism of induced DSBs does not require any increase in reactive oxygen species (ROS).  This may explain why Denham Harmon’s laboratory experiments failed to show that anti-oxidant administration could slow down aging in normal aged rodents and may explain why anti-oxidant administration in humans does not reduce cancer risk.  In other words, ROS may not be the major reason for DSBs…..it may be L1 activity.

References:

2006 The Human LINE-1 Retrotransposon Creates DNA Double-strand Breaks

2010 Somatic expression of LINE-1 elements in human tissues

2014 Potential for genomic instability associated with retrotranspositionally-incompetent L1 loci

1996 Human L1 Retrotransposon Encodes a Conserved Endonuclease Required for Retrotransposition

Here is an illustration which shows how ORF2 produces the endonuclease enzyme which “nicks” DNA, producing a DSB:

Image may be NSFW.
Clik here to view.
LINE1-6

Image and legend source: 2006 The Human LINE-1 Retrotransposon Creates DNA Double-strand Breaks

“Schematic of the L1 TPRT reaction. The top drawing shows a genomic site with a typical L1 endonuclease cleavage site (5’TTTTAA) that is exposed in the nucleus to the L1 RNP, where the ORF2 cleaves the DNA at the A+T-rich consensus sequence. In the second drawing, the T-rich region primes reverse transcription on the L1 mRNA poly(A) tail. The third drawing highlights the reverse transcriptase activity (formation of the blue cDNA) of the ORF2 and the need for a nick to occur on the second strand, made by an unknown source. The segment between the two nicks is highlighted in gray to illustrate the eventual formation of flanking direct repeats by the duplication of these segments. The fourth panel illustrates the possibility that the second-strand synthesis is primed by microhomology-mediated priming, which results in synthesis of a second copy of the gray segment (dotted arrow). Replication from the gray arrow completes synthesis across the 2nd strand of the cDNA creating a new L1 insert and completing synthesis across the other side of the direct repeat.”

Here is another illustration of how both transcription of the functional L1 locus (FL1mRNA) or the splice variant that only contains ORF2 can cause DNA mutations:

Image may be NSFW.
Clik here to view.
LINE1-7

Image source:    2015 Somatic expression of LINE-1 elements in human tissues

Here is an illustration that shows why you need a competent L1 to create endonuclease from ORF2.  It also summarizes the three deleterious mechanisms by which L1 retrotransposons can create DNA havoc, cancer and aging.

Image may be NSFW.
Clik here to view.
LINE1-9

Image source:   2014 Potential for genomic instability associated with retrotranspositionally-incompetent L1 loci

11. Cancer is manifested by dramatic increases in transposable element expression

There is very strong evidence that cancer cells express transposable elements and that cancer cells that have progressed to late stages of chemotherapy and radiation resistance have very high levels of TE expression.  The exact role that TE expression plays is still a mystery, however.  Part of this mystery may have been recently solved by some researchers who found double-stranded hybrid nucleic acid strands (DNA:RNA DS hybrids) that contain both LINE-1 and Alu elements.   When cancer cells are treated with LINE-1 reverse transcriptase  inhibitor drugs, such as efavirenz (EFV), five amazing effects occur simultaneously in the RT-inhibitor treated cancer cells:

– the DNA:RNA double-stranded hybrid molecules containing LINE-1 and Alu copies fail to form

– cancer cell proliferation is repressed

– coding genes that were silenced are re-expressed

– many microRNAs that were dysregulated are re-expressed

– ultra conserved regions (UCRs) are re-expressed

What is even more fascinating is that the RT inhibitor-sensitive microRNAs and UCRs that are re-expressed are significantly associated with Alu elements.  This was just reported in 2013 and opens up an exciting new field in cancer research  (Sciamanna, et.al, 2013 A tumor-promoting mechanism mediated by retrotransposon-encoded reverse transcriptase is active in human transformed cell lines).

Several authors have suggested that these same RT inhibitor drugs may also be used to treat aging, since the expression of LINE-1 elements dramatically increases with aging in S. cerevisiae (Maxwell, et al, 2011),  in the Drosophila brain (Li, 2013), in the mouse liver (Cecco, et al, 2013), in the mouse skeletal muscle (Cecco, et.al, 2013), and in aging human cells (Belancia, et al, 2010).  To date, no animal experiments or human clinical trials have shown that RT inhibitor drugs prolong life span, however.

Here is an illustration for how the RISC complex represses TE expression in normal cells, in early tumors, and chemotherapy resistant cancers.

Image may be NSFW.
Clik here to view.
LINE1-10

Image source: 2010 Repression of transposable-elements – a microRNA anti-cancer defense mechanism?

12. LTR transposable elements contain G-quadruplex sequences at specific distances from their endogenous TE promoter that may regulate LTR-mediated gene expression  –G-quadruplexes in the 3′-UTRs and 5′-UTRs of LINE-1 elements may affect expression of neighboring genes

G-quadruplexes are common, but complex tertiary “3D” structures found in G-rich sequences of DNA that form stable structures using a potassium cation in their center and a series of hydrogen bonds called “Hoogsteen bonds”.  G-quadruplexes are formed within the 3′   overhang region of the telomeric DNA and help stabilize/protect the tip of the telomere. TERRA, the long non-coding RNA that associates with the tellomere to transcriptionally silence telomerase, also has a G-quadruplex in it.  For more on this fascinating topic, read the blog that Dr. Vince Giuliano and I recently posted on this website:  2015 G-quadraplexes.

There are hundreds of thousands of potential G-quadruplex structures within our DNA sequences and they are evolutionarily conserved. One of the many reasons why the BRCA1 gene (we call it the “Angelina Jolie Gene” now) is so important in preventing breast cancer is because it controls G-quadruplex formation in the telomere (via its control over Rad50).  Perhaps the most shocking thing about G-quadruplexes, however, is that 90% of the expression of the c-Myc oncogene is controlled by a G-quadruplex structure just upstream from its promoter.  c-Myc is the most important oncogene that gets up-regulated in cancer.  Thus it may be that this upstream G-quadruplex may be the reason for the hereto unexplained up-regulation of c-Myc that occurs in the majority of tumors.

A recent study showed that there probably are G-quadruplex structures within transposable elements (see references below).  Quadruplex DNA can affect the whole genome as it represents a barrier for DNA replication. This is why helicases like Werner’s Rec-helicase is so important in the proper functioning of DNA.  When the Werner helicase gene is mutated, accelerated aging occurs and the phenotype of the progeria Werner’s syndrome almost exactly “mimics” normal aging, but at an accelerated rate (the children with the progeria die at an early age).

The link between TEs and G-quadruplexes is via the protein ATRX.  ATRX is part of a family of SWI/SNF proteins that are chromatin modulators. ATRX interacts with Heterochromatin Protein 1 (HP1) the protein that interacts with nuclear corepressor protein 1 (KAP1), which is the target of SIRT6-mediated transposable element silencing.  ATRX and HP1 also interact with trimethylated lysine 4 and lysine 9 in histone 3 (i.e. H3K4me3 and H3k9me3).  H3K9me3 plays a role in transposon silencing.

References

2013 Quadruplex-forming sequences occupy discrete regions inside plant LTR retrotransposons

2010 ATR-X Syndrome Protein Targets Tandem Repeats and Influences Allele-Specific Expression in a Size-Dependent Manner

Here is an illustration of how LTRs work in plant LTR retrotransposons and in human LINE-1 elements:

Image may be NSFW.
Clik here to view.
LINE1-11

Image source: 2014 Quadruplex-forming DNA sequences spread by retrotransposons may serve as genome regulators

Here is an illustration of how G-quadruplexes could play a role in blocking transposable element retrotransposition, inhibiting ectopic recombination, and forming truncated 5′ copies that would not have made functional copies.

Image may be NSFW.
Clik here to view.
LINE1-12

Image and text source:  2014 Quadruplex-forming DNA sequences spread by retrotransposons may serve as genome regulators  ” Figure 2. A model of DNA quadruplex spreading by retrotransposition and the assumed biological functions of DNA quadruplexes in gene regulation and genome organization: (A) negative and positive effect on transcription via interfering with RNA extension or separating DNA strands, respectively, (B) inhibitory effect on DNA replication that can be overcome by binding of FANCJ-type helicases, (C) serving as hotspots for recombination and (D) the role in chromatin remodeling by attracting ATRX-like proteins that are associated with heterochromatin or heterochromatin boundaries.”

13. Transient LINE-1 over-expression induces cell senescence or apoptosis in normal healthy cells – LINE-1 expression is “toxic” to cells

There is recent evidence that merely expressing L1 can induce cellular senescence or apoptosis in normal cells.  Belancio and colleagues in 2010 showed that expression of the wild type L1 element (mRNA) or the splice variant (SpORF2) in normal human fibroblasts and adult stem cells leads to a sensecent-like phenotype.  Even low levels of L1 activity have the potential to contribute to genetic instability, aging, and age-related diseases like cancer.  When they looked at old normal cells from the esophagus, prostate, stomach, and heart muscle, they found levels of L1 expression that were 80% (esophagus), 50% (prostate), 150% (stomach), and 200% (heart muscle) of the levels of L1 expression in HeLa cells.  Thus it is clear that somatic cells express L1.  In the testes, there is a dramatic increase in L1 expression that is an order of magnitude above HeLa cells, as well as old normal somatic cells. Several authors have shown that germ cell tissues (testes) display a 10-fold increase in transcriptional activation of the L1 promoter by the testes-determining factor gene, SRY.  Even mesenchymal stem cells express L1 transcripts, but at low levels that are 20% of what is seen in MCF7 cancer cells.

References:

2010 Somatic expression of LINE-1 elements in human tissues  “Tests of the senescence-associated β-galactosidase expression suggest that expression of exogenous full-length L1, or the SpORF2 mRNA alone in human fibroblasts and adult stem cells triggers a senescence-like phenotype, which is one of the reported responses to DNA damage. In contrast to previous assumptions that L1 expression is germ line specific, the increased spectrum of tissues exposed to L1-associated damage suggests a role for L1 as an endogenous mutagen in somatic tissues. These findings have potential consequences for the whole organism in the form of cancer and mammalian aging.”

2006 Accumulation of Senescent Cells in Mitotic Tissue of Aging Primates

14. Melatonin suppresses LINE-1 expression, as does sleep and turning off the lights at night – Light exposure at night and disruption of circadian rhythms prevents the circadian-based silencing of L1 retrotransposons

For a long time, it has been well-known that the expression of LINE-1 element mRNAs is increased in cancer.  It has also been known for quite some time that night shift workers have and increase risk of cancer and female airline flight attendants who are constantly disrupting circadian rhythms have a 1.4 o 1.6 fold higher risk of breast cancer.  However, the exact mechanism by which working at night and disrupting circadian rhythms induces cancer remains a mystery.  Well, the mystery may be solved by LINE-1.

A fascinating paper recently showed that light exposure at night is associated with an inhibition of mobilization of L1 in cultured cells through the down regulation of L1 mRNA and ORF1 protein.  Specifically, the mechanism of action was that activating the melatonin receptor 1 inhibited the mobilization of L1.  They also showed that the administration of exogenous melatonin inhibited L1 mobilization in cultured cells.  Their conclusion was that the decreased melatonin production in shift workers increased L1 transcription into mRNA and increased L1 mobilization.  This is one of the first papers to link sleep, transposable elements, and cancer.  However, many papers prior to this have linked melatonin to a reduced risk of breast cancer via a MT-1 receptor-mediated mechanism.  In these papers, other molecular mechanisms of action besides LINE-1 repression have been shown to exist.  This includes the regulation of the DNA repair mechanism by melatonin called the “Nucletoide Excision Repair” (NER) pathway, which repairs single stranded DNA breaks.

The good news is that exogenous melatonin supplementation is well-absorbed, inexpensive, and has very few side effects besides being sleepy.  Not only does it suppress LINE-1 transcription, it also preserves SIRT1 expression in the hippocampus, even in sleep deprived mice.  It is likely that melatonin works via both SIRT1 and SIRT6 to suppress LINE-1 expression.

Image may be NSFW.
Clik here to view.
LINE1-13

Image source  “FIGURE 1. Light exposure at night accelerates aging by impeding or enhancing processes associated with aging. (A) Usually aging involves normal light exposure that is characterized by alternating intervals of light and dark over a 24-h period, which result in circadian production of nocturnal melatonin. This leads to the synchronization of peripheral clock (PC) function controlling many biochemical processes in cells including L1 expression and activity (Deharo et al., 2014) and the DNA damage response (DDR). (B) Exposure to light at night (LAN) is reported to accelerate aging. LAN blocks nocturnal melatonin production which prevents synchronization of PCs, leading to the disruption of timely function of many biochemical processes in cells including L1 expression and activity, DDR, and metabolism.”

References:

2015 The aging clock and circadian control of metabolism and genome stability  “It is widely accepted that aging is characterized by a gradual decline in the efficiency and accuracy of biological processes, leading to deterioration of physiological functions and development of age-associated diseases. Age-dependent accumulation of genomic instability and development of metabolic syndrome are well-recognized components of the aging phenotype, both of which have been extensively studied. Existing findings strongly support the view that the integrity of the cellular genome and metabolic function can be influenced by light at night (LAN) and associated suppression of circadian melatonin production. While LAN is reported to accelerate aging by promoting age-associated carcinogenesis in several animal models, the specific molecular mechanism(s) of its action are not fully understood. Here, we review literature supporting a connection between LAN-induced central circadian disruption of peripheral circadian rhythms and clock function, LINE-1 retrotransposon-associated genomic instability, metabolic deregulation, and aging. We propose that aging is a progressive decline in the stability, continuity, and synchronization of multi-frequency oscillations in biological processes to a temporally disorganized state. By extension, healthy aging is the ability to maintain the most consistent, stable, and entrainable rhythmicity and coordination of these oscillations, at the molecular, cellular, and systemic levels.”

2015 Melatonin: an inhibitor of breast cancer

2009 Melatonin preserves longevity protein (sirtuin 1) expression in the hippocampus of total sleep-deprived rats

 15.  SIRT6 – An important silencer of transposable element expression and a candidate “longevity gene

SIRT6 has a unique role in silencing transposable elements.  Specifically, it silences transposable elements, telomeric DNA, and satellite DNA by ribosylating KAP1, a nuclear co-repressor protein that organizes and compacts chromatin into heterochromatin.  It is not surprising then that in GWAS studies, SNPs in the SIRT6 gene have showed up as being  “longevity SNPs.”   Recently, researchers from the University of Iowa looked at a elderly cohort aged > 65 for variations in the Sirtuin genes (SIRT1-7), FOXO3a, and SOD3.  Of these genes, by  far the most significant SNPs were found in the SIRT6 genes.  “Good SNPs” in the SIRT6 gene conferrred a longevity advantage of over 5 years.  No other gene SNPs gave a longevity advantage of more than 1.6 years.

Specifically rs107251 showed that individuals with the homozygous “CC” or heterozygous “CT” genotype lived 5.5 and 5.9 years longer than those with the homozygous “TT” genotype for this SIRT6 SNP.

References:

2014 SIRT6 represses LINE1 retrotransposons by ribosylating ​KAP1 but this repression fails with stress and age

2014 SIRT6 Minor Allele Genotype Is Associated with >5-Year Decrease in Lifespan in an Aged Cohort

16. Longevity is associated with gene polymorphisms that may play a role in reducing TE activity and reducing inflammation – IFN-gamma SNPs IL-6 SNPs, ADARB1 and ADARB2 SNPs, YTHDF2 SNPs, and SIRT6 SNPs may all work to extend lifespans via transposable elements

    IFN-gamma and IL-6 SNPs

Inflammation triggers transposable element expression and this may be a major link between inflammation and aging. Only SNPs in genes that trigger transcription factors that can activate LTRs (IFN-gamma and IL-6) are associated with longevity.  For instance, a SNP in the IFN-gamma gene that reduces IFN-g function is associated with Longevity and a SNP in IL-6 gene that reduces IL-6 mediated signaling is associated with Longevity. It has been known for a long time that inflammation is associated with accelerated aging.  This has often been referred to as “inflammaging”. There is now strong evidence that Transposable elements become activated and TE transcription  increases with inflammation and cellular stress.

When studies showed that SNPs in IFN-gamma reduced inflammation, this was not surprising. If TE expression shortens life span, this could be one of the mechanisms by which the molecular mechanism by which inflammation, aging, and shortened lifespan were linked. Interferons are known to be produced in response to viral infections and trigger a host of pathways that help the cell survive the viral invasion.

Unfortunately, some of the inflammatory transcription factors produced by IFN-gamma can activate LTRs found near human genes.  These inflammatory transcription factors can use the LTR as a “landing strip” and activate nearby genes that can produce cancer and aging. This is why chronic viral infections are associated with an increased risk of cancer and accelerated aging.  For instance, chronic CMV infections increase IFN-gamma secretion and this results in accelerated telomere shortening.

In a study of Italian centenarians, polymorphisms in the first intron of the interferon-gamma (IFN-g) gene that decreased IFN-gamma production were associated with longevity (the +874A allele), whereas the “T” copy of the +874T SNP which was associated with increased IFN-gamma production was found less frequently in centenarians. Since then, other researchers have elucidated the mechanisms of action for the +874A polymorphism’s “longevity effect” – it appears to be associated with a micro satellite repeat in this intron.  When this micro satellite repeat was expanded, it resulted in a down regulation in the IFN-gamma gene expression.  The general theory for how IFN-gamma could reduce longevity was hypothesized to be mediated by increased inflammation, according to the authors of this paper.   If the “longevity allele” in the IFN-gamma SNP decreased IFN-gamma production by expanding the micro satellite repeat, this could be a plausible mechanism of action.  However the effect of IFN-gamma on activating transcription factors associated with LTRs is entirely possible with this mechanism of action. In other words, +874A allele reduced inflammation.    Researchers in Belfast, UK also found polymorphisms in a micro satellite repeat in intron 1 of the IFN-gamma gene to be enriched  in centenarians in the UK.  This same group also found polymorphisms in the IL-6 gene that were associated with longevity.  Specifically, the -174CC allele of the IL-6 gene was enriched in centenarians, whereas the -174GG allele were not enriched in centenarians.  Again, there is no question that “inflammaging” is one of the hallmarks of aging.

SNPS in several other inflammatory cytokines were also analyzed, but no correlation with longevity was found for these other SNPs (IL-2, IL-8, IL-10, and IL-12).  A group from Finland also found no association between longevity and polymorphisms in IL-10, but they also found no association of SNPs in IL-6 or TNF-alpha and lifespan.  Obviously more studies in this arena need to be done before any conclusions are reached.

References:

2009 The role of transposable elements in the regulation of IFN-λ1 gene expression

2002 Allele frequencies of +874T→A single nucleotide polymorphism at the first intron of interferon-γ gene in a group of Italian centenarians

2003  Study_of_age-association_with_cytokine_gene_polymorphisms_in_an_aged_Irish_population problem with link

2001 Lack of association between human longevity and polymorphisms of IL-1 cluster, IL-6, IL-10 and TNF-α genes in Finnish nonagenarians

17. The human brain is a very active site of L1 transcription and insertions into neurons, in a cell-specific manner that produces gene mosaicism – Researchers have already shown that L1 retrotranspositions not only copy their own genomes — they also copy human genes such as AKT3 and APP.  This produces a “gene dosage problem” which can account for hemimegalencephly, increases in Amyloid-beta production, and other diseases.

Recent studies using Next Generation Sequencing (NGS) conduced on a single cell analysis has showed that somatic neurons (i.e. post mitotic cells) undergo L1 retrotransposition at a rate of 0.04 to 0.07 inserts per neuron (Evrony, et al,  2012 Single-Neuron Sequencing Analysis of L1 Retrotransposition and Somatic Mutation in the Human Brain).  With an estimated 50 trillion cells in the human body, it is estimated that 4 billion neurons per brain may contain somatic L1 insertions.  Not only can L1 “copy machines” copy their L1 genomes — they can also copy adjacent human genes. The consequences for human aging could be most serious.

Reference: 2014 The aging clock and circadian control of metabolism and genome stability

18.  TE-originated genetic mosaicism – a likely cause of Alzheimer’s disease

The beta amyloid overload so characteristically seen in Alzheimer’s disease may be largely due to TE-originated genetic mosaicism which leads some cortical neurons to have large copy numbers of the amyloid precursor protein (APP) gene.

Another major breakthrough in the understanding of the link between disease and transposable elements was published this year by a group from Scripps Institute in La Jolla, California.  In February, 2015, Dr. Jerold Chun and colleagues published their data showing that extra copies of the gene that encode for the precursor protein for amyloid beta (APP) was copied when retrotransposons were copied off chromosome 21.  The copy number for the APP gene should normally be 2, but in the cerebral cortical neurons harvested from autopsies done on patients who had Alzheimer’s disease, some of the cortical neurons showed a “gene copy amplification” of the APP gene with some cells having as many as 12 copies of APP.  The pattern of “genetic mosaicism” that was seen has been described in the brain from earlier work, but this was the first evidence linking over-expression of APP  to retrotransposon activity.  This may be a major component of the cause or Alzheimer’s disease.

The 2015 publication Genomic mosaicism with increased amyloid precursor protein (APP) gene copy number in single neurons from sporadic Alzheimer’s disease brains reports:  ” Previous reports have shown that individual neurons of the brain can display somatic genomic mosaicism of unknown function. In this study, we report altered genomic mosaicism in single, sporadic Alzheimer’s disease (AD) neurons characterized by increases in DNA content and amyloid precursor protein (APP) gene copy number. AD cortical nuclei displayed large variability with average DNA content increases of 8% over non-diseased controls that were unrelated to trisomy 21. Two independent single-cell copy number analyses identified amplifications at the APP locus. The use of single-cell qPCR identified up to 12 copies of APP in sampled neurons. Peptide nucleic acid (PNA) probes targeting APP, combined with super-resolution microscopy detected primarily single fluorescent signals of variable intensity that paralleled single-cell qPCR analyses. These data identify somatic genomic changes in single neurons, affecting known and unknown loci, which are increased in sporadic AD, and further indicate functionality for genomic mosaicism in the CNS.”

Alas, AD is not the only aging-related disease where retrotransposon activity has been implicated.  Others include cancer, rheumatoid arthritis, diabetes type I, schizophrenia, infertility, and Amyotrophic Lateral Sclerosis (ALS).

19. Vaccines with cancer-associated ERVS and HIV infection-associated ERVs appear to be safe and immunogenic – This is potentially a therapeutic way to fight cancer and prevent HIV, but only animal studies have been done so far.

One reason why so few people are interested in transposable elements is that they do not understand that unwanted TE expression is a “solvable” problem that might lead to multiple preventative measures and therapies.  As an example, cancer and HIV-infected individuals many times do not produce a robust T cell immune response because of a number of “immune evasion” techniques that cancer cells and HIV-infected cells use to evade the immune response against the cancer or HIV virus.  A group of researchers at Pfizer in La Jolla are currently working on a novel way of doing something about this.  They vaccinated mice with the Human Endogenous Retrovirus (HERV-K) envelope and gag proteins to induce a T cell response. This produced a robust T cell response. They also tried immunizing mice with LINE-1 open reading frame 2 (ORF2).  This produced a robust T cell response as well.  No tissue damage was noted with these vaccines.

Reference:  2012 Vaccination with Cancer- and HIV Infection-Associated Endogenous Retrotransposable Elements Is Safe and Immunogenic

20. Reverse Transcriptase inhibitors that suppress transposable element retrotransposition may effectively treat cancer  – This is potentially a therapeutic way to fight cancer and prevent HIV, but only animal studies have been done so far. These drugs may also have potential to slow aging

Calorie restriction has been proven to reduce age-related increases in TE expression.  In the study above, 40% CR reduced the increase in MSAT expression by 50-60% in livers and muscle, but CR did not reduce it to zero. Likewise CR reduced L1 expression by 25-35% in livers and muscle, but CR did not completely reverse the increase in L1 transposable element expression with aging.

There may be other ways to more effectively reduce satellite and transposable element expression.  One of them is to use FDA-approved drugs that block the enzyme reverse transcriptase, which is used by the HIV virus but also is used to copy L1s, Alu elements, SVA elements, and other TEs.

An important workshop was held in Erice, Italy, in October, 2013.  A select group of experts in the field of aging research were invited to attend this meeting which was titled “Interventions to Slow Aging in Humans: Are We Ready?”  The conference published a great review article in the journal, Aging Cell, in April, 2015.  Here is the reference for it:

Reference: 2015 Interventions to Slow Aging in Humans: Are We Ready?

In this article, they talked about biomarkers to test efficacy, biomarkers for pro-aging mechanisms, companion biomarkers, safety biomarkers, dietary interventions (CR, fasting, alternative day fasting, methionine restriction, etc.) and pharmacologic interventions that mimicked CR. In this category, they identified the following class of drugs that targeted various CR pathways as follows:

a. mTOR pathway inhibitors

b. Glycolysis inhibitors

c. hGH/IGF-1 pathway inhibitors

d. Sirtuin activators

e. AMPK pathway activators

f. Inhibitors of inflammatory pathways

g. Modulators of epigenetic pathways

h. beta2-adrenergic receptor signaling

i. NDGA

j. statins and ACE inhibitors

k. Hexosamine pathway and glycobiology inhibitors

l. DNA damage signaling drugs

m. stem cell therapy

n. drugs that suppress retrotransposable elements

If you look at the list of authors on this paper, it is a list of the future “hall of fame” in aging research.  None of these guys are amateurs and they all are well aware of the futility of things like anti-oxidants, multivitamins, hormone replacement therapy, etc.  I thought it was interesting that they included retrotransposable element drugs in the list of strategies for treating aging. Specifically, they mentioned two drugs that were reverse transcriptase inhibitors (lamivudine  and adefovir).  When I looked these up, I found a paper that was written in 2008 where researchers from UC San Francisco and Toronto, Canada; had already tried nucleoside analogues that inhibited reverse transcriptase enzymes.  These drugs were mostly developed and FDA approved in the 1990s to treat HIV.  Although some are still used today, the protease inhibitors have largely taken over the market for treating HIV infections.

These reverse transcriptase inhibitors also inhibit the reverse transcriptase encoded by LINE-1 transposable elements.  As a result, these FDA-approved drugs inhibit retrotransposition in a human cell lines.  They proved this with a reporter assay for LINE-1 retrotransposition.  Here are two references showing how FDA-approved reverse transcriptase inhibitors inhibit LINE-1 retrotransposition:

References:

2008 Nucleoside Analogue Reverse Transcriptase Inhibitors Differentially Inhibit Human LINE-1 Retrotransposition

2011 Effect of reverse transcriptase inhibitors on LINE-1 and Ty1 reverse transcriptase activities and on LINE-1 retrotransposition

They found that all of the nucleoside inhibitors reduced LINE-1 retrotransposition by as much as 90%, but the non-nucleoside (HIV-1) reverse transcriptase inhibitors like nevirapine did NOT inhibit LINE-1 retrotransposition.  Although the doses required for treating HIV infection with these drugs is associated with a lot of side effects, the lower doses used to treat Hepatitis B infections with these drugs is much lower and do not have as much side effects.  To date, I do not believe any animal model has been done to see if the nucleoside analog reverse transcriptase inhibitors have any effect on health span or life span in model organisms.

21. Retrotransposon activity is likely to be a MAJOR cause of aging

This is the last point I will make on this subject.  I think that the evidence now is irrefutable.  L1 activity causes aging by 3 mechanisms:

1) retrotransposition-induced mutagenesis, silencing of genes, and gene copy number increase,

2) L1 endonuclease-mediated double stranded DNA breaks due to the multiple DNA “nicks” that each copy of ORF2 produces, and

3) direct toxicity of L1 transcripts which can trigger pathways that lead to cellular senescence and apoptosis.

As a factor in aging, the relative impact of TEs is likely to be much larger in older people, because: a) transposon activity is much larger in older cells, b) metabolic factors that inhibit TE activity including NAD+ and SIRT1 are scarcer in older people and are drawn off by the larger number of single and double strand DNA breaks that goes along with aging.  This is with negative health and pro-aging consequences for other key processes, such as maintenance of mitochondrial health and mitochondrial biogenesis, and avoidance of Warburg-type metabolism, c) increasing activation of endogenous TEs associated with global genome demythelation that comes with aging, and d) increases in copy numbers of some pro-inflammatory and other pro-aging genes in certain cells associated with increasing genetic moscisism.

HERVs and LTR remnants of HERVs can play a role in aging because of their effects in the inflammatory pathways, where they can turn on inflammation by using the LTRs as “alternative promoters” for NF-kB and many other inflammatory transcription factors.

There may be a role for LTRs in chronic viral infections that induce accelerated aging as well, in HIV, hepatitis, CMV, and EBV chronic infections.  Alu elements play a role in aging that is much more complex and may include the role of paired Alu elements producing double stranded motifs that allow ADAR to do A-to-I editing.  In addition, Alu motifs can disrupt genes by insertional mutagenesis, gene silencing, and disruption of gene regulatory networks.  Then there is the role for the RNA Alu motif on the long noncoding RNA called ANRIL, which plays a central role in the genetic risk of all atherosclerotic diseases, cancer, diabetes, and Alzheimer’s disease.

The combined effects of L1s, HERV LTRs, and Alu elements on aging make transposable elements one of the greatest overlooked components of the pathogenesis of aging.  All of this evidence on transposable elements is validated by the fact that caloric restriction, fasting, and genetic knock-out of the Insulin/IGF-1 pathway silences retrotransposon activity via RNAI and PIWI-piRNA pathways, as well as activating the gene for the DNA binding protein called TDP-43.  This is “good news”, since caloric restriction and fasting are free, effective methods to silence transposons.  In addition, melatonin, SIRT6 activators, biotin, histone deacetylase inhibitors, histone acetyl transferase inhibitors, and Sirtuin activators may all be promising strategies to suppress TE expression.  Last of all, vaccines against ORF2 and HERV proteins are being developed to prevent cancer and HIV infections.  So far, they show no toxicity.  Reverse transcriptase inhibitors look like a promising strategy to deal with TE-mediated aging as well.  Here are the best references that support this view:

2015 The mechanism of ageing: Primary role of transposable elements in genome disintegration

2006 LINE-1 Endonuclease-Dependent Retrotranspositional Events Causing Human Genetic Disease: Mutation Detection Bias and Multiple Mechanisms of Target Gene Disruption

2009 The impact of retrotransposons on human genome evolution

2015 Interventions to Slow Aging in Humans: Are We Ready?

2013 Transposable elements become active and mobile in the genomes of aging mammalian somatic tissues

2015 Intrinsic retroviral reactivation in human preimplantation embryos and pluripotent cells


Transposable DNA elements – Part 3 TEs and and other key mechanisms of evolution: incRNAs, A to I editing, alternative splicing and exonization

By Vince Giuliano, with inspiration by Jim Watson

Image may be NSFW.
Clik here to view.
Primitivecells


Image source:  “These clusters of cells are 1 billion years old, the oldest to appear in freshwater/land ecosysems   Credit: Oxford University/Martin Brasier ”  This blog entry is about how we got to here from there.

This is the promised third blog entry in a three-part series concerned with transposable DNA entries (TEs).  The Part 1 entry focused on basics of what TEs are, and why they are important for us concerned with health and aging.  The  Part 2 entry, The Self-copy Machines in Your Genes, was mainly generated by Jim Watson and provides the “meat and potatoes” of technical content.  Twenty one key aspects of TEs are discussed there.  This entry is Part 3 of that series.  It outlines the key role of TEs in making evolution possible in response to stresses in a changing environment.  And it lays out how TEs fit into an emerging unified theory of how evolution works.  It tells important parts of the genomic story about how we evolved through becoming higher primates and eventually humans.

This entry also includes an introductory discussion  of highly-associated basic mechanisms of evolution.  These include in addition toTEs: long non-coding RNAs (incRNAs), A to I  RNA editing, alternative DNA splicing, and exonization.  These fit together and go a long way towards explaining what kicks evolution off on the genomic level and then how it proceeds to happen.  These mechanisms are not that familiar to many longevity or biomedical researchers.  However, they have a lot to do with normal biological functioning, driving aging, and a multiplicity of disease processes.  As a matter of fact, their importance may be paramount.  So, Jim Watson and I are working on additional blog entries related to them.

What I think about evolution 

Here is some of what I think in a nutshell.  Later I will cite research backing these statements up.

  • The human genome – archive of our life history The human genome not only encodes in our DNA what we are now and how we function and can reproduce, but also a complete history of how we got here from the start of life on earth, including all tried and abandoned biological adaptations.  This history is encoded in our various RNA sequences, especially in our long non-coding RNA sequences (incRNAs), in our other RNA species (such as circular RNAs),  in our TEs, in fossil viruses, and of course in our genes and pseudogenes.  Remarkably this  immense archive of life history is in every cell of every individual.  And similar genomic archives exist in every cell of every other living organism leading up to their current status.  These archives of life are essential components of the incredible machinery we have for evolution, allowing us to innovate on a genomic level when there is a challenge, perhaps need for survival, or perhaps just an opportunity to do better.  They embody repurposable coding for an enormous number of biological adaptions that have been tried at one point or the other and proven useful, and also for one-time threats such as fossil viruses.  The genome documents challenges we have confronted, solutions we have tried and a very large number of solutions and solution components that have hitherto proved useful.  And it contains repurposable code for everything tried.

Note that this is what I think, hypothesize based on numerous clues, and is not fully supported yet by hard research.  What is known is that the human genome archive is more than 50% fossil DNA including some known to be ancient and exist in primitive organisms and is incredibly extensive,  there being over  98,000 fragments of leftover “fossil viruses” in our genomes (HERVs)  alone.  Why do I think it makes sense?.  Because if God/Nature had given me the job of designing evolution, I would have started very early on building a gigantic database characterizing what worked and what did not work under various circumstances.  And I would make sure that everything tried in my evolutionary history is handily repurposable in case it is needed again.  Until a few years ago, most of our genome was thought to consist of dark-matter “junk DNA.”  Now I believe it is a major historical asset for problem-solving and biological innovation.

I do ask my readers to cut me a little slack especially in this “what I think” section, for I know I may be simplifying the situation too much for some of you.  For exanple, I know that some or most of our fossil DNA has been damaged or fallen into disrepair after many generations and is no longer functional in its original role.  Most human endegenous retroviruses, for example, have lost their original promoter sequences – thank goodness for that.  But even so, many exon and intron components of our ancient DNA probably remain reporposable.  And I trust biology to keep around chunks of code that it thinks may be useful in the future.

  • Genomic machinery for survival, thrival and evolution.  We also have evolved sophisticated genomic machinery for reaching into this archive of life and using it for innovation as well as for normal biological functioning – to serve to enhance the health of a cell, an organ, an individual, for evolution in a population, and even for the evolution of new species.  Research cited below establishes that we have identified mechanisms for creating new proteins, for example.  We know about some of the key elements of this machinery and talk about them here, including TEs of course, long non-coding RNAs (incRNAs). A to i editing, exonization and alternative splicing.
  • Evolution is driven by stress signaling.  Expression of TEs and the genomic machinery for evolution are activated by stresses, particularly stresses that go beyond the constitutive ones normally experienced. When a cell detects stress signaling a possible need for evolution to support survival, a response is “Let’s see what there might be in our archive of life that might be combined with what we are using right now to support  our evolving to survive and thrive despite the stress.”  Perhaps this could be  a chunk of DNA that was once useful when our ancestors were amphibians starting to emerge from the ocean 420 million years ago but that we stopped using 130 million years ago.  Perhaps it is a more recent chunk of DNA from an ancestor hominoid from only 25 million years ago.
  • Evolution is based on guided genomic innovation.,  So evolution on the genomic level is not based on random mutation followed by trial for survival.  Rather it is a matter of guided genomic innovation based on an archive of our entire history of evolution and sophisticted machinery for figuring out what is to be tried next, and only then is there trial for survival.
  • Much of the same machinery employed for evolution also serves our health and functioning as individuals.  Expression of TEs and alternative splicing for example, are quite universal processes in a many of routine and necessary biological processes such as generating a vast vocabulary of proteins starting with a limited number of protein-encoding genes.  When I did Basic Training as a draftee in the US Army eons ago I was taught a basic principle.  “Whatever your position and situation is when out in the field, always be improving it.”   I think that is also a basic principle of biological systems. 

I argue here that current genomic research supports these statements, via our growing knowledge of non-coding DNA and RNA species, and of behavior of TEs and genomic processes such as alternative splicing, A to I editing and exonization.  This seems to cut across all species that have DNA  – that is, across all life as we know it.

Stress, transposable elements and evolution

The Part 1 blog entry discussed how TEs are activated by stresses, an initial step in the processes of genomic evolution.  Stresses also activate alternative splicing.

The role of stress that I suggested above is supported by the 2015 publication  Response of transposable elements to environmental stressors, which is concerned about stresses driving disease processes today.   “Transposable elements (TEs) comprise a group of repetitive sequences that bring positive, negative, as well as neutral effects to the host organism. Earlier considered as “junk DNA,” TEs are now well-accepted driving forces of evolution and critical regulators of the expression of genetic information. — Evidence summarized in this review suggests that TEs are the sensitive endpoints for detection of effects caused by such environmental stressors, as ionizing radiation (terrestrial, space, and UV-radiation), air pollution (including particulate matter [PM]-derived and gaseous), persistent organic pollutants, and metals. Furthermore, the significance of these effects is characterized by their early appearance, persistence and presence in both, target organs and peripheral blood. Altogether, these findings suggest that TEs may potentially be introduced into safety and risk assessment and serve as biomarkers of exposure to environmental stressors. Furthermore, TEs also show significant potential to become invaluable surrogate biomarkers in clinic and possible targets for therapeutic modalities for disease treatment and prevention.”

Getting back to my views on evolution: The environmental conditions for every life form continues to evolve and change.  Some change is fast, some slow.  There are situations of relative stability, and life forms depend on these. But there can be no “forever” stability.  Here again are some things I think about stress:

  •  Each life form at any time has adopted for survival in the semi-stable environment it exists in at that time.  They calibrate their multiple internal homeostasis-seeking systems to function in that semi-stable environment. A thermoacidophile likes it very hot and acid.  We can’t stand that. A  methanogen likes it anaerobic with lots of methane, like in a sewer.  We don’t.  What we have in common is that we have DNA, RNA and have evolved according to some common mechanisms described here.  Most everything else is different.
  • Yet, because of constant flux, life forms experience a variety of stresses.  Many of these will be mild and more or less expected; some are likely to be serious.  Some will be  wellness or life-threatening.  A short draught or having insects eat a few if its leaves may stress a plant; having all of its leaves eaten by foraging deer may seriously threaten that plant; being overrun by a lava flow will kill it.
  • Lifeforms have developed strategies for going on in the presences of change.  Two important ones I focus on here are hormesis and evolution.  Both of these strategies are triggered by stress. 

Hormesis is the strategy used for surviving on the individual level, the capability of an organism or a biological subsystem to respond to a stress by mobilizing its defenses so as to actually improve its functionality, providing that the duration/intensity of the stress falls within a certain range.  We have discussed hormesis extensively in this blog.  In particular see 2012 Multifactorial hormesis,  2013 The Hormesis Bars, 2012 Radiation hormesis, 2012 Mitohormesis, and 2009 Hormesis and age retardation.  

Evolution is a stress response mediated by transposable element and alternative splicing expression that leads to genomic change as discussed in this blog entry.  This may effect individuals, germ lines, populations or species.

At least for certain common stress inducers (like heat, cold, hypoxia, oxidative load, pressure, presence of many toxins), the response of an organism is conditioned by the range of duration/intensity of the stressor

Sub-hormetic stress little or no observable effect
Hormetic stress stress-response mechanisms of the organism provides healthy survival-giving response
TE-activating stress TEs are activated, leading to an enhanced probability of evolution on the genomic level
Lethal stress stress too great for organismic survival

I do not know exactly how these ranges may overlap each other and I suspect that some stress responses are both hormetic and TE-activating.  Impacts of a given stressor may be different in different organs and in different cells.  And they will certainly be different in different individuals.  And impacts may be  determined by multiple variables such as initial redox state of the organism, circadian status, and other complicating factors.  Remember the important distinction known to every engineering student but usually glossed over in the biomedical literature (and, I admit, glossed over here too), the difference between strain and stress.

  • The external stimulus creating a challenge is called a strain, be this an insect attack on a plant a  toxin ingested by your dog, or a fight with your boss.
  • A stress is the response to the strain, and a given strain may be responded to very differently.  Some plants of a given species may survive a given level of insect attack and some may die. A given dose of ingested castor oil may make some dogs of the same breed, weight and age only slightly sick and kill others.  A fight with a boss may be shrugged off by one employee and lead to a mental breakdown in another.  So stress is a function of system state as well as what is going on “our there.”

TEs: facilitators of evolution

Back while I was in 8th grade, I heard that evolution  was due to a combination of random variation and natural selection for survival – whatever those meant.  Later, perhaps early in college years, I learned further that the random variation was due to changes in DNA such as a DNA base pair mutation caused by a random oxidative event such as the passage of a cosmic ray.  As time passed, it gradually became clear to me that there had to be lot more involved for evolution to happen.  Evolution involves multiple complex and simultaneous adoptions and happens far more rapidly than can be explained by random molecule or gene-at-a-time events. Transposable elements in our genome – millions of different ones — provide a much more powerful framework for originating possibly useful mutations in our DNA, where long sequences can be exported within and across chromosomes.  Sometimes a LINE-1 TE may pick up an unrelated segment of DNA and ship it “to who may be concerned.”   Some times a gene may be duplicated that confers an evolutionary advantage, one like P53.   TEs both provide a massive mechanism for introducing more than random variations, and they raise the question of the extent to which the “random variation” of evolution  is really random, after all.

TEs can unquestionably mess up DNA, shipping large sequences into places where they seem to have no function other than to create problems.  “LINE-1 expression damages host DNA via insertions and endonuclease-dependent DNA double-strand breaks (DSBs) that are highly toxic and mutagenic(ref).” Yet I side with some biologists who have been increasingly seeing TEs as facilitators of evolution.

The 2012 article Transposable Elements, Epigenetics, and Genome Evolution summarizes the situation.  “Today, we know that TEs constitute more than half of the DNA in many higher eukaryotes. We know, too, that the fingerprints of TEs and transposition are everywhere in their genomes, from the coarsest features of genomic landscapes and how they change through real and evolutionary time to the finest details of gene structure and regulation. My purpose here is to challenge the current, somewhat pejorative, view of TEs as genomic parasites with the mounting evidence that TEs and transposition play a profoundly generative role in genome evolution. I contend that it is precisely the elaboration of epigenetic mechanisms from their prokaryotic origins as suppressors of genetic exchanges that underlies both the genome expansion and the proliferation of TEs characteristic of higher eukaryotes. This is the inverse of the prevailing view that epigenetic mechanisms evolved to control the disruptive potential of TEs. The evidence that TEs shape eukaryotic genomes is by now incontrovertible. My thesis, then, is that TEs and the transposases they encode underlie the evolvability of higher eukaryotes’ massive, messy genomes.”  Epigenetic silencing of TEs is one of the topics Jim Watson treated in the Part 2 blog entry of this series.

Stresses lead to TE expression

Evolution appears to go far beyond protecting species.  When the survival of a species begins to be seriously threatened by stresses, evolutionary innovation starts to happen.  Evolutionary processes are kicked into gear  which lead to multiple genetic variations in the species and possibly to the creation of new related species.  Among such processes and perhaps key is the upgrading of expression of transposable elements.  This has been observed in multiple species and with multiple kinds of stresses.  Some examples are offered in these publications:

The 2012 publication Transposable elements: from DNA parasites to architects of metazoan evolution relates “The most unexpected insights that followed from the completion of the human genome a decade ago was that more than half of our DNA is derived from transposable elements (TEs). Due to advances in high throughput sequencing technologies it is now clear that TEs comprise the largest molecular class within most metazoan genomes. TEs, once categorised as “junk DNA”, are now known to influence genomic structure and function by increasing the coding and non-coding genetic repertoire of the host. In this way TEs are key elements that stimulate the evolution of metazoan genomes. This review highlights several lines of TE research including the horizontal transfer of TEs through host-parasite interactions, the vertical maintenance of TEs over long periods of evolutionary time, and the direct role that TEs have played in generating morphological novelty.”

The 2000 document Stress and transposable elements: co-evolution or useful parasites?  relates: “In the natural world, individuals, populations and species all have to cope with environmental change. Individual organisms and their cells have to adapt physiologically through responses that are immediate and reversible. At the population and species levels, selection may lead to genetic changes and to the evolution of the inherited characteristics of an individual organism. In such organisms this long-term response is irreversible. — During the last two decades several authors have reported that stress increases the genetic variability of many quantitative traits in a population, see for instance Imasheva et al., (1998), including life history and morphology (Hoffmann & Parsons, 1997). This genetic variability may have various origins. For example, different genes may be expressed in normal as opposed to stressful environments. It has also been shown recently that genetic variability can be hidden by buffering proteins such as Hsp90 (Rutherford & Lindquist, 1998). This variability can be revealed by stress and then maintained when the protein function is restored. Finally, mutator mechanisms can be induced by stress. These are the origin of the genetic variability that allows selection to take place in response to environmental changes. At least two mechanisms are frequently described: those involving the SOS response (the activation of mutagenic activity) or the MRS response (inhibition of an antimutagenic system, the mismatch repair system) (Taddei et al., 1997) and those involving transposable elements (TEs) (Capy et al., 1997). Here we review and discuss findings of the impact of TEs on the host genome under stressful conditions and also summarize the various models put forward to account for these findings.”

1992 Induction of the mobile genetic element Dm-412 transpositions in the Drosophila genome by heat shock treatment  “Males of a Drosophila melanogaster isogenic line with a mutation of the major gene for radius incompletus (ri) were treated by standard light heat shock (37 degrees C for 90 min) and by heavy heat shock (transfer of males from 37 degrees C for 2 hr to 4 degrees C for 1 hr and back; this procedure was repeated three times). In the F1 generation of treated males mated with nontreated females of the same isogenic line, mass transpositions of copia-like mobile genetic element Dm-412 were found. The altered positions of the element seem nonrandom; five “hot spots” of transposition were found. Probabilities of transpositions were estimated after light heat shock and heavy heat shock and in the control sample. These probabilities were, respectively, 3.4 x 10(-2), 8.7 x 10(-2), and less than 4.1 x 10(-4) transpositions per genome per occupied position per generation. Therefore, as a result of heat shock treatment, the probabilities of transpositions were two orders of magnitude greater than those of the control sample in the next generation after induction. Comparison of the results with those after stepwise temperature treatment shows that the induction depends on the intensity of the stress action (temperature treatment) rather than on the type of the stress action.”

2013 Transposable elements: powerful contributors to angiosperm evolution and diversity. “Transposable elements (TEs) are a dominant feature of most flowering plant genomes. Together with other accepted facilitators of evolution, accumulating data indicate that TEs can explain much about their rapid evolution and diversification. Genome size in angiosperms is highly correlated with TE content and the overwhelming bulk (>80%) of large genomes can be composed of TEs. Among retro-TEs, long terminal repeats (LTRs) are abundant, whereas DNA-TEs, which are often less abundant than retro-TEs, are more active. Much adaptive or evolutionary potential in angiosperms is due to the activity of TEs (active TE-Thrust), resulting in an extraordinary array of genetic changes, including gene modifications, duplications, altered expression patterns, and exaptation to create novel genes, with occasional gene disruption. TEs implicated in the earliest origins of the angiosperms include the exapted Mustang, Sleeper, and Fhy3/Far1 gene families. Passive TE-Thrust can create a high degree of adaptive or evolutionary potential by engendering ectopic recombination events resulting in deletions, duplications, and karyotypic changes. TE activity can also alter epigenetic patterning, including that governing endosperm development, thus promoting reproductive isolation. Continuing evolution of long-lived resprouter angiosperms, together with genetic variation in their multiple meristems, indicates that TEs can facilitate somatic evolution in addition to germ line evolution. Critical to their success, angiosperms have a high frequency of polyploidy and hybridization, with resultant increased TE activity and introgression, and beneficial gene duplication. Together with traditional explanations, the enhanced genomic plasticity facilitated by TE-Thrust, suggests a more complete and satisfactory explanation for Darwin’s “abominable mystery”: the spectacular success of the angiosperms.”

Rapid mobilization of TEs by stresses may be critical for the success of invasive species.

2015 Transposable elements as agents of rapid adaptation may explain the genetic paradox of invasive species  “Rapid adaptation of invasive species to novel habitats has puzzled evolutionary biologists for decades, especially as this often occurs in the face of limited genetic variability. Although some ecological traits common to invasive species have been identified, little is known about the possible genomic/genetic mechanisms that may underlie their success. A common scenario in many introductions is that small founder population sizes will often lead to reduced genetic diversity, but that invading populations experience large environmental perturbations, such as changes in habitat and environmental stress. Although sudden and intense stress is usually considered in a negative context, these perturbations may actually facilitate rapid adaptation by affecting genome structure, organization and function via interactions with transposable elements (TEs), especially in populations with low genetic diversity. Stress-induced changes in TE activity can alter gene action and can promote structural variation that may facilitate the rapid adaptation observed in new environments. We focus here on the adaptive potential of TEs in relation to invasive species and highlight their role as powerful mutational forces that can rapidly create genetic diversity. We hypothesize that activity of transposable elements can explain rapid adaptation despite low genetic variation (the genetic paradox of invasive species) — .”

2014 Transposable element islands facilitate adaptation to novel environments in an invasive species.  This one is about an ant species.

Stress-activated TEs and the other pro-evolutionary mechanisms characterized in this blog entry also play roles in the stress responses of individuals for maintaining homeostasis and in disease processes.  These topics are not just about what went on during tens of millions of years of evolution,  They are also about what goes on in us right now.

An example of this is reported in the 2015 publication Stress and the dynamic genome: Steroids, epigenetics, and the transposome:  “Stress plays a substantial role in shaping behavior and brain function, often with lasting effects. How these lasting effects occur in the context of a fixed postmitotic neuronal genome has been an enduring question for the field. Synaptic plasticity and neurogenesis have provided some of the answers to this question, and more recently epigenetic mechanisms have come to the fore. The exploration of epigenetic mechanisms recently led us to discover that a single acute stress can regulate the expression of retrotransposons in the rat hippocampus via an epigenetic mechanism. We propose that this response may represent a genomic stress response aimed at maintaining genomic and transcriptional stability in vulnerable brain regions such as the hippocampus. This finding and those of other researchers have made clear that retrotransposons and the genomic plasticity they permit play a significant role in brain function during stress and disease. These observations also raise the possibility that the transposome might have adaptive functions at the level of both evolution and the individual organism.”

In plants as well as animals, stresses activate TEs wich results in higher expression of stress responsive genes.  For example, the1997 document The expression of the tobacco Tnt1 retrotransposon is linked to plant defense responses reports:  “Activation of retrotransposons by stresses and external changes is common in all eukaryotic systems, including plants. The transcription of the tobacco Tnt1 retrotransposon was studied in its natural host as well as in Arabidopsis and tomato. It is activated by factors of microbial origin, by external stresses, and by viral, bacterial, and fungal attacks. Tnt1 expression is linked with the biological responses of the plant to the elicitor or to the pathogen attack and in particular with the early steps of the metabolic pathways leading to the activation of plant defense genes. In most cases, the basic features of Tnt1 regulation in tobacco are maintained in tomato and Arabidopsis, but some host-specific regulations were shown.”

2013 How do mammalian transposons induce genetic variation? A conceptual framework: the age, structure, allele frequency, and genome context of transposable elements may define their wide-ranging biological impacts. “We present a conceptual framework to understand how the ages, allele frequencies, molecular structures, and especially the genomic context of mammalian TEs each can influence their various possible functional consequences.  While most TEs are ancient relics, certain classes can move from one chromosomal location to another even now. Indeed, striking recent data show that extensive transposition occurs not only in the germline over evolutionary time, but also in developing somatic tissues and particular human cancers. While occasional germline TE insertions may contribute to genetic variation, many other, similar TEs appear to have little or no impact on neighboring genes. However, the effects of somatic insertions on gene expression and function remain almost completely unknown.”

Additional references:

2009 The impact of retrotransposons on human genome evolution

2012 Presidential address. Transposable elements, epigenetics, and genome evolution.

The evolution of epigenetics.

1995 LTR-retrotransposons and MITEs: important players in the evolution of plant genomes.

2013 Abundance and distribution of transposable elements in two Drosophila QTL mapping resources.

But TEs are only part of the picture as we will see;

Other key biological mechanisms work with TEs to support evolution (and normal biological functioning)

As pointed out above, the important role that TEs seem to play in evolution is that of selectively enhancing genetic diversity in response to stress.  This begs the question of exactly how that genetic diversity can lead to enhanced survivability.  What are the evolutionarily conserved mechanisms of “survival of the fittest?”  Is genomic evolution purely a matter of trial and error once TEs mix-and-match and spread the DNA around?

No.   Absolutely not.  We could ever have gotten this far with evolution if that were the case, even after 450 million years.  A picture of the situation is beginning to emerge, but it carries us off into frontier areas of genomic research. The answers are far from being all in but we already have quite a bit to work with.  Among the mechanisms that work with TEs are other processes that go on in DNA, including incRNAs, alternative splicing. A to I editing, and exonization.  I briefly characterize these and then go on to illustrate how they contribute to evolution along with TEs by quoting from a variety of research publications

Long non-coding RNAs – incRNAs and lincRNAs

incRNAs are long non-coding RNAs generally greater than 200 nucleotides in length, an important species in the RNA Zoo known for their regulatory functions and possible association with cellular senescence(ref)(ref). lincRNAs are long intergenic noncoding RNAs(ref).  That is, they live in the regions of DNA between genes.

Recent research suggests that TE insertions contribute significantly to the DNA found in long non-coding RNAs.  This can explain the rapid gene evolution observed in long non-coding RNAs.

A very recent chapter of the TE-incRNA-evolution story has to do with SINEUPs, as told by this 2015 publication SINEUPs: A new class of natural and synthetic antisense long non-coding RNAs that activate translation.  “Over the past 10 years, it has emerged that pervasive transcription in mammalian genomes has a tremendous impact on several biological functions. Most of transcribed RNAs are lncRNAs and repetitive elements. In this review, we will detail the discovery of a new functional class of natural and synthetic antisense lncRNAs that stimulate translation of sense mRNAs. These molecules have been named SINEUPs since their function requires the activity of an embedded inverted SINEB2 sequence to UP-regulate translation. Natural SINEUPs suggest that embedded Transposable Elements may represent functional domains in long non-coding RNAs. Synthetic SINEUPs may be designed by targeting the antisense sequence to the mRNA of choice representing the first scalable tool to increase protein synthesis of potentially any gene of interest. We will discuss potential applications of SINEUP technology in the field of molecular biology experiments, in protein manufacturing as well as in therapy of haploinsufficiencies.”

The theme in this publication of TEs contributing significant insertions into long non-coding RNAs is also supported by this 2015 publication: Transposable Element Insertions in Long Intergenic Non-Coding RNA Genes.  “Transposable elements (TEs) are abundant in mammalian genomes and appear to have contributed to the evolution of their hosts by providing novel regulatory or coding sequences. We analyzed different regions of long intergenic non-coding RNA (lincRNA) genes in human and mouse genomes to systematically assess the potential contribution of TEs to the evolution of the structure and regulation of expression of lincRNA genes. Introns of lincRNA genes contain the highest percentage of TE-derived sequences (TES), followed by exons and then promoter regions although the density of TEs is not significantly different between exons and promoters. Higher frequencies of ancient TEs in promoters and exons compared to introns implies that many lincRNA genes emerged before the split of primates and rodents. The content of TES in lincRNA genes is substantially higher than that in protein-coding genes, especially in exons and promoter regions. A significant positive correlation was detected between the content of TEs and evolutionary rate of lincRNAs indicating that inserted TEs are preferentially fixed in fast-evolving lincRNA genes. These results are consistent with the repeat insertion domains of LncRNAs hypothesis under which TEs have substantially contributed to the origin, evolution, and, in particular, fast functional diversification, of lincRNA genes.”

The same theme is articulated in the 2014 publication The RIDL hypothesis: transposable elements as functional domains of long noncoding RNAs. “Our genome contains tens of thousands of long noncoding RNAs (lncRNAs), many of which are likely to have genetic regulatory functions. It has been proposed that lncRNA are organized into combinations of discrete functional domains, but the nature of these and their identification remain elusive. One class of sequence elements that is enriched in lncRNA is represented by transposable elements (TEs), repetitive mobile genetic sequences that have contributed widely to genome evolution through a process termed exaptation. Here, we link these two concepts by proposing that exonic TEs act as RNA domains that are essential for lncRNA function. We term such elements Repeat Insertion Domains of LncRNAs (RIDLs). A growing number of RIDLs have been experimentally defined, where TE-derived fragments of lncRNA act as RNA-, DNA-, and protein-binding domains. We propose that these reflect a more general phenomenon of exaptation during lncRNA evolution, where inserted TE sequences are repurposed as recognition sites for both protein and nucleic acids. We discuss a series of genomic screens that may be used in the future to systematically discover RIDLs. The RIDL hypothesis has the potential to explain how functional evolution can keep pace with the rapid gene evolution observed in lncRNA. More practically, TE maps may in the future be used to predict lncRNA function.”

So, TEs can insert segments in incRNAs.  What are the downstream consequences of this in terms of incRNA regulation of transcription and ultimately evolution?  This diagram illustrates various ways in which incRNAs can regulate transcription:

Image may be NSFW.
Clik here to view.
ab1


Image and legend source: 2013  RNA in unexpected places: long non-coding RNA functions in diverse cellular contexts a–c | Long non-coding RNAs (lncRNAs) can modulate chromatin through transcription-independent (part a) and transcription-dependent mechanisms (parts b and c). lncRNAs can bind one or more chromatin-modifying complexes and target their activities to specific DNA loci (part a). Depending on the nature of the enzymes bound, lncRNA-mediated chromatin modifications can activate or repress gene expression22, 23, 26, 27, 120. Chromatin-modifying complexes bound to the RNA polymerase II (Pol II) carboxy-terminal domain (CTD) can modify chromatin during transcription of lncRNAs33, 34, 35 (part b). Transcription of lncRNAs can also result in chromatin remodelling that can either favour or inhibit the binding of regulatory factors (part c). Depending on the nature of the factors that bind during remodelling, gene expression is activated or repressed37, 38, 39, 40. d–g | lncRNAs can modulate both the general transcription machinery (parts d and e) as well as specific regulatory factors (parts f and g). lncRNAs can bind Pol II directly to inhibit transcription47 (part d). Formation of lncRNA–DNA triplex structures can also inhibit the assembly of the pre-initiation complex48 (part e). lncRNAs can fold into structures that mimic DNA-binding sites (left) or that generally inhibit or enhance the activity of specific transcription factors (right)50, 51, 52, 53 (part f). lncRNAs can also regulate gene expression by binding specific transport factors to inhibit the nuclear localization of specific transcription factors54 (part g).”

Alternative splicing

Up through the mid-late 70s, biologists thought that a single gene could make only one unique protein.  Now we know that a single gene can make tens or hundreds of thousands of different proteins,  The secret is alternative splicing together of gene components – exons or introns converted to exons – going into the translation phase of protein making.  Alternative splicing is not “alternative.”  It is the regular way biology operates.

“Alternative splicing is a regulated process during gene expression that results in a single gene coding for multiple proteins. In this process, particular exons of a gene may be included within or excluded from the final, processed messenger RNA (mRNA) produced from that gene.[1] Consequently the proteins translated from alternatively spliced mRNAs will contain differences in their amino acid sequence and, often, in their biological functions (see Figure). Notably, alternative splicing allows the human genome to direct the synthesis of many more proteins than would be expected from its 20,000 protein-coding genes. Alternative splicing is sometimes termed differential splicing. — Alternative splicing occurs as a normal phenomenon in eukaryotes, where it greatly increases the biodiversity of proteins that can be encoded by the genome;[1] in humans, ~95% of multi-exonic genes are alternatively spliced.[2] There are numerous modes of alternative splicing observed, of which the most common is exon skipping. In this mode, a particular exon may be included in mRNAs under some conditions or in particular tissues, and omitted from the mRNA in others.[1]

Quoted text and illustration from Wikipedia

Image may be NSFW.
Clik here to view.
ab2

Alternative splicing produces three protein isoforms.

Alternative splicing is evolutionarily conserved, known to be applicable in insects as well as in mammals including us(ref).   Although the mechanisms of it have become more sophisticated in higher lifeforms, alternative splicing is ancient and possibly came into being as an essential feature of multi-celled organisms.  The 2004  the publication How did alternative splicing evolve? relates: “Alternative splicing creates transcriptome diversification, possibly leading to speciation. A large fraction of the protein-coding genes of multicellular organisms are alternatively spliced, although no regulated splicing has been detected in unicellular eukaryotes such as yeasts. A comparative analysis of unicellular and multicellular eukaryotic 5′ splice sites has revealed important differences — the plasticity of the 5′ splice sites of multicellular eukaryotes means that these sites can be used in both constitutive and alternative splicing, and for the regulation of the inclusion/skipping ratio in alternative splicing. So, alternative splicing might have originated as a result of relaxation of the 5′ splice site recognition in organisms that originally could support only constitutive splicing.”

Alternative splicing is extremely important, not only for evolution but also for health and longevity.  James Watson and I are currently working on blog entries on it which I expect we will  publish shortly.

A to I editing

Adenosine-to-inosine (A-to-I) RNA editing is the most important form of RNA editing in us. It is not an oddball phenomenon, but has played an important role in making us human.  The 2014 publication A-to-I RNA editing occurs at over a hundred million genomic sites, located in a majority of human genes describes the mechanism and its importance: “RNA molecules transmit the information encoded in the genome and generally reflect its content. Adenosine-to-inosine (A-to-I) RNA editing by ADAR proteins converts a genomically encoded adenosine into inosine. It is known that most RNA editing in human takes place in the primate-specific Alu sequences, but the extent of this phenomenon and its effect on transcriptome diversity are not yet clear. Here, we analyzed large-scale RNA-seq data and detected ∼1.6 million editing sites. As detection sensitivity increases with sequencing coverage, we performed ultradeep sequencing of selected Alu sequences and showed that the scope of editing is much larger than anticipated. We found that virtually all adenosines within Alu repeats that form double-stranded RNA undergo A-to-I editing, although most sites exhibit editing at only low levels (<1%). Moreover, using high coverage sequencing, we observed editing of transcripts resulting from residual antisense expression, doubling the number of edited sites in the human genome. Based on bioinformatic analyses and deep targeted sequencing, we estimate that there are over 100 million human Alu RNA editing sites, located in the majority of human genes. These findings set the stage for exploring how this primate-specific massive diversification of the transcriptome is utilized.”

Here is an illustration of A to I editing.

Image may be NSFW.
Clik here to view.
ab3

Image source The double-stranded RNA loop of the human 5-HT2C receptor transcript. ADAR enzymes have been shown to bind only to double-stranded RNA. The specific sites of activity of ADARs 1 and 2 are indicated.”

Note that  we have discussed Alu TE elements in the Part2 blog entry

“Conversion of a genetically encoded adenosine (A) into an inosine (I) while preserving sequence in RNA is accomplished by adenosine deaminases (ADARs). “The primate specific Alu sequences are the dominant short interspersed nuclear element (SINEs) in the primate genomes (International Human Genome Sequencing Consortium 2001Cordaux and Batzer 2009). Humans have about a million copies of Alu, roughly 300 bp long each, accounting for ∼10% of their genome. Since these repeats are so common, especially in gene-rich regions (Korenberg and Rykowski 1988), pairing of two oppositely oriented Alus located in the same pre-mRNA structure is likely. Such pairing produces a long and stable dsRNA structure, an ideal target for the ADARs. Indeed, recent studies have shown that Alu repeats account for >99% of editing events found so far in humans (Athanasiadis et al. 2004Blow et al. 2004Kim et al. 2004Levanon et al. 2004Ramaswami et al. 20122013).”

This 2008 publication RNA editing in regulating gene expression in the brain discusses how A to I editing and alternative splicing have had ” profound importance for normal nervous system function in a wide range of invertebrate and vertebrate model organisms.”

Exonization

“A funny thing happened to my RNA on the way to making a protein”

Exonization can convert an intron in a segment of RNA into an exon, which means that instead of being left out during translation it gets converted into a protein-encoding segment of DNA.  If the intron so-converted comes from a TE insertion, an alternative splicing and possible new protein results.  The result can frequently be negative.

The 2011 publication Exonization of transposed elements: A challenge and opportunity for evolution relates: “Protein-coding genes are composed of exons and introns flanked by untranslated regions. Before the mRNA of a gene can be translated into protein, the splicing machinery removes all the intronic regions and joins the protein-coding exons together. Exonization is a process, whereby genes acquire new exons from non-protein-coding, primarily intronic, DNA sequences. Genomic insertions or point mutations within DNA sequences often generate alternative splice sites, causing the splicing system to include new sequences as exons or to elongate existing exons. Because the alternative splice sites are not as efficient as the originals the new variants usually constitute a minor fraction of mature mRNAs. While the prevailing original splice variant maintains functionality, the additional sequence, free from selection pressure, evolves a new function or eventually vanishes. If the new splice variant is advantageous, selection might operate to optimize the new splice sites and consequently increase the proportion of the alternative splice variant. In some instances, the original splice variant is completely replaced by constitutive splicing of the new form. Because of the fortuitous presence of internal splice site-like structures within their sequences, portions of transposed elements frequently serve as modules of exonization. Their recruitment requires a long and versatile optimization process involving multiple changes over a time span of millions, even hundreds of millions, of years. Comparisons of corresponding genes and mRNAs in phylogenetically related species enables one to chronologically reconstruct such changes, from ancient ancestors to living species, in a stepwise manner. We will review this process using three different exemplary cases: (1) the evolution of a constitutively spliced mammalian-wide repeat (MIR), (2) the evolution of an alternative exon 1 from an alternative 5′-extended primary transcript containing an Alu element, and (3) a rare case of the stepwise exoniztion of an Alu element-derived sequence mediated by A-to-I RNA editing.”

The 2011 publication Characteristics of transposable element exonization within human and mouse reported “Insertion of transposed elements within mammalian genes is thought to be an important contributor to mammalian evolution and speciation. Insertion of transposed elements into introns can lead to their activation as alternatively spliced cassette exons, an event called exonization. Elucidation of the evolutionary constraints that have shaped fixation of transposed elements within human and mouse protein coding genes and subsequent exonization is important for understanding of how the exonization process has affected transcriptome and proteome complexities. Here we show that exonization of transposed elements is biased towards the beginning of the coding sequence in both human and mouse genes. Analysis of single nucleotide polymorphisms (SNPs) revealed that exonization of transposed elements can be population-specific, implying that exonizations may enhance divergence and lead to speciation. SNP density analysis revealed differences between Alu and other transposed elements. Finally, we identified cases of primate-specific Alu elements that depend on RNA editing for their exonization. These results shed light on TE fixation and the exonization process within human and mouse genes.”

Some supporting research publications

Italics in quoted segments of text are my own, for emphasis of particularly important points.

TEs contribute to evolution by furnishing functional intron and exon domains to long non-coding RNAs (incRNAs)

TEs, A to I editing, alternative splicing, exonization and evolution

How do the DNA processes of A to I editing, alternative splicing, exonization together with TE expression come together to support the sweeping view of evolution that I outlined in the introduction to this blog – that our genome consists of a gigantic archive of mostly-unused DNA segments from our evolutionary history that can be repurposed and recombined in the interest of evolution?  The following publications suggest how, each with their own viewpoints:

The 2015 publication Alternative splicing and co-option of transposable elements: the case of TMPO/LAP2α and ZNF451 in mammals relates: “Transposable elements constitute a large fraction of vertebrate genomes and, during evolution, may be co-opted for new functions. Exonization of transposable elements inserted within or close to host genes is one possible way to generate new genes, and alternative splicing of the new exons may represent an intermediate step in this process. The genes TMPO and ZNF451 are present in all vertebrate lineages. Although they are not evolutionarily related, mammalian TMPO and ZNF451 do have something in common-they both code for splice isoforms that contain LAP2alpha domains. We found that these LAP2alpha domains have sequence similarity to repetitive sequences in non-mammalian genomes, which are in turn related to the first ORF from a DIRS1-like retrotransposon. This retrotransposon domestication happened separately and resulted in proteins that combine retrotransposon and host protein domains. The alternative splicing of the retrotransposed sequence allowed the production of both the new and the untouched original isoforms, which may have contributed to the success of the colonization.”

There we have it.  Combine TE insertions, exonization and alternative splicing, and it seems we can come up with new genes.   The following documents tell important additional parts of the story about how we made it to becoming humans.

Remember what happened to your ancestors 40-60 million years ago?  The 2008 publication Beyond DNA: RNA editing and steps toward Alu exonization in primates discusses how Alu TE elements, A to I editing and alternative splicing worked together to create the gorilla, the chimp, many other of our primate cousins, and us. “The exaptation of transposed elements into protein-coding domains by a process called exonization is one important evolutionary pathway for generating novel variant functions of gene products. Adenosine-to-inosine (A-to-I) modification is a recently discovered, RNA-editing-mediated mechanism that contributes to the exonization of previously unprocessed mRNA introns. In the human nuclear prelamin A recognition factor gene transcript, the alternatively spliced exon 8 results from an A-to-I editing-generated 3′ splice site located within an intronic Alu short interspersed element. Sequence comparisons of representatives of all primate infraorders revealed the critical evolutionary steps leading to this editing-mediated exonization. The source of exon 8 was seeded within the primary transcript about 58-40 million years ago by the head-to-head insertions of two primate-specific Alu short interspersed elements in the common ancestor of anthropoids. The latent protein-coding potential was realized 34-52 million years later in a common ancestor of gorilla, chimpanzee, and human as a result of numerous changes at the RNA and DNA level. Comparisons of 426 processed mRNA clones from various primate species with their genomic sequences identified seven different RNA-editing-mediated alternative splice variants. In total, 30 A-to-I editing sites were identified. The gorilla, chimpanzee, and human nuclear prelamin A recognition factor genes exemplify the versatile interplay of pre- and posttranscriptional modifications leading to novel genetic potential.”

Another part of the same story is told in the 2013 publication related to TE DNA insertions, long non-coding RNAs, simian and our evolution is ANRIL/CDKN2B-AS shows two-stage clade-specific evolution and becomes conserved after transposon insertions in simians. “BACKGROUND: Many long non-coding RNA (lncRNA) genes identified in mammals have multiple exons and functional domains, allowing them to bind to polycomb proteins, DNA methyltransferases, and specific DNA sequences to regulate genome methylation. Little is known about the origin and evolution of lncRNAs. ANRIL/CDKN2B-AS consists of 19 exons on human chromosome 9p21 and regulates the expression of three cyclin-dependent kinase inhibitors (CDKN2A/ARF/CDKN2B).  — RESULTS:ANRIL/CDKN2B-AS originated in placental mammals, obtained additional exons during mammalian evolution but gradually lost them during rodent evolution, and reached 19 exons only in simians. ANRIL lacks splicing signals in mammals. In simians, multiple transposons were inserted and transformed into exons of the ANRIL gene, after which ANRIL became highly conserved. A further survey reveals that multiple transposons exist in many lncRNAs.  — CONCLUSIONS:ANRIL shows a two-stage, clade-specific evolutionary process and is fully developed only in simians. The domestication of multiple transposons indicates an impressive pattern of “evolutionary tinkering” and is likely to be important for ANRIL’s structure and function. The evolution of lncRNAs and that of transposons may be highly co-opted in primates. Many lncRNAs may be functional only in simians.”  We became smart and capable monkeys, poised later to evolve further into us humans.

You can also check out the publication One hundred million adenosine-to-inosine RNA editing sites: hearing through the noise. “A small subset of edited Alu elements has been shown to exhibit diverse functional roles in the regulation of alternative splicing, miRNA repression, and cis-regulation of distant RNA editing sites. The low level of editing for the remaining majority may be non-functional, yet their persistence in the primate genome provides enhanced genomic flexibility that may be required for adaptive evolution.”

The evolution-promoting actions of the mechanisms described here work in plants too.  The 2012 publication Genome-wide survey of ds exonization to enrich transcriptomes and proteomes in plants relates “Insertion of transposable elements (TEs) into introns can lead to their activation as alternatively spliced cassette exons, an event called exonization which can enrich the complexity of transcriptomes and proteomes. —  The insertion patterns of Ds and the polymorphic splice donor sites increased the transcripts and subsequent protein isoforms. Protein isoforms contain protein sequence due to unspliced intron-TE region and/or a shift of the reading frame. The number of interior protein isoforms would be twice that of C-terminal isoforms, on average. TE exonization provides a promising way for functional expansion of the plant proteome.”

There are many additional relevant citations such as:

2012 Intronic retroelements: Not just “speed bumps” for RNA polymerase II.

2013 Retroelements in human disease.

2005 Gene-breaking: a new paradigm for human retrotransposon-mediated gene evolution.

2011 Intronic L1 retrotransposons and nested genes cause transcriptional interference by inducing intron retention, exonization and cryptic polyadenylation.

2009 Exon-trapping mediated by the human retrotransposon SVA.

2007 Biased exonization of transposed elements in duplicated genes: A lesson from the TIF-IA gene.

2010 Transposable elements in disease-associated cryptic exons.

2009 Disease-causing mutations improving the branch site and polypyrimidine tract: pseudoexon activation of LINE-2 and antisense Alu lacking the poly(T)-tail.

2006 Identification of multiple transcription initiation, polyadenylation, and splice sites in the Drosophila melanogaster TART family of telomeric retrotransposons.

2004 Activation of cryptic 3′ splice sites within introns of cellular genes following gene entrapment.

2010 Functions and regulation of RNA editing by ADAR deaminases.

2010 Genomic gems: SINE RNAs regulate mRNA production.

2009 Transcription of the rat testis-specific Rtdpoz-T1 and -T2 retrogenes during embryo development: co-transcription and frequent exonisation of transposable element sequences.

I expect that we will discuss several of the intriguing ideas raised in these publications in forthcoming blog entries

On the way to a Grand Unified Theory of biology and aging

In November 2013, I published a blog entry treatise Prospectus for a Grand Unified theory of Biology, Health and Aging. The discussion was focused on the possibility of identifying unifying principles of biology that provide a simple basic structure for this field of incredible complexity.   The concept of a GUTb was introduced earlier in my PowerPoint presentation Multifactorial Hormesis which examines the roles of stresses and stress responses in biology.

The closest thing to a GUTb we have ever had in biology is Darwin’s theory of evolution, and it is precisely because of the importance of TEs to evolution that I was originally motivated to write this blog entry.  To start, I list some properties I would like a theory to have to qualify as a GUT.     A Grand Unified Theory of Biology (GUTb) must be concerned with universals.

  • It should apply to all life forms ranging from primitive viruses, molds and bacteria to plants, ants, gnats, mice. lice, whales, snails, dogs, frogs, hogs, monkeys, donkeys and all other animals including us.   And methanogens, certainhalophiles and thermoacidophiles and lot of other entities with strange names.  That is, it should apply to all entities in the three main categories of life: bacteria, archaea and the eukaryotes, which include animals, plants and fungi.
  • It should apply to all levels of biological organization (e.g. molecular, cell, organ, system, whole organism and organism in social context).
  • It should be interesting, exciting, have predictive power and be consistent with all we know, including about evolution.    It should apply historically, for now, and for the foreseeable future.
  • It should provide us with insights into what all life is about and help guide our research.

 I believe what is said in this blog entry related to TEs, non-coding RNAs, alternative splicing, A to I editing, exonization and evolution stands up to these criteria. 

In the process of researching these blogs, I believe we are beginning to discern the basic mechanisms of evolution – what kicks it, off, the genomic steps of it happening, and even more fundamental – what it is: how it works in species, in populations and even within individuals.  I believe Jim Watson joins me in finding this very exciting.  I think a GUT of biology is no more about specific processes in specific organelles, cells or organisms – rules, exceptions, and exceptions to exceptions – than a GUT of physics is about the specific ways specific substances move when subject to specific forces.  We can catalog, analyze and describe to our heart’s desire but this will always be about specific organisms living in particular circumstances at particular historical periods – the endpoint examples of evolution, not the process of how it works.  Rather the GUT should be about how evolution itself takes place, about how new biological entities, rules and even species can come into being when needed.  And about how they can go out of being when no longer needed, about mosaicism, about keeping an accessible record of what happened since the start of it all, about repurposing of solutions, and about the insatiable drive of biological entities not only for survival but also for improvement.

I don’t want to come across as saying I know a lot about evolution.  I don’t.  What I do want to convey is that I experience a lot of excitement about what I am learning discussed here.

We expect our readers will discover that these blog entries are not just about what happened 150 and 25 million years ago, and glass jars in musty museums with specimens in them.  They are about little-discussed but extremely important mechanisms that affect our health and longevity right  now, and that point to new interventions beyond those discussed in the usual medical or longevity literature.  We plan to discuss specific health and longevity implications of alternative splicing in the following two blog entries.

These new blog entries will be centered on the same biological processes discussed here and in the previous blog entries in this series, alternative splicing, TEs, incRNAs, A to I editing and exonization – but focused on disease processes and human health instead of on evolution.   Jim Watson and I  think that alternative splicing plays a major role in determining health span and lifespan. We discuss how alternative splicing controls protein diversity, protein localization, protein function, and aging.  And we discuss how ubiquitous alternative splicing is, playing key roles in such diverse areas as gender determination and autism, and in several key longevity-related pathways.  Alternative  splicing is a critical feature of both the IGF-1 gene, the high affinity IGF-2 protein found in cancer, and the IGF-1 receptor (and the insulin receptor). Alternative splicing may explain much of the difference between super centenarians and “regular people” who do not carry longevity-related mutations,  It could account for the differences in longevity in those of us who do not have a heterozygous “Loss-of-function” mutation in our IGF-1R gene. The next blog entry in particular, written by Jim Watson, will focus on  Hutchinson-Gilford Progeria Syndrome (HGPS), a model of aging where children go through all the steps of aging and die as old men and women from diseases of old age before their 20th birthdays.  The key matter involved is hereditary alternative splicing of a single gene, Lamin A.

Hutchinson-Gilford Progeria Syndrome – a disease of accelerated aging due to Alternative Splicing

By James P Watson with editorial assistance and contributions from Vince Giuliano

I.  WHY YOU SHOULD BE INTERESTED IN HUTCHINSON-GILFORD PROGERIA SYNDROME (HGPS)

Summary: HGPS is a major clue to solving the “puzzle of aging” and the molecular mechanisms here are relevant to normal aging. 

HGPS is one a dozen monogenetic diseases that accelerates aging and is extremely rare, occurring in only 1 out of every 4-8 million babies born.  However, the same protein that builds up in these children (called progerin) also builds up in your skin with normal aging and you can accelerate your own progerin-related aging with exposure to long wave length UV light!  The mechanism that accelerates aging in HGPS and in normal skin is the same.  It is called “Alternative Splicing” but in reality, there is “nothing alternative about it.” It happens with normal aging even without UVA light exposure. This is why you should be interested in the molecular mechanisms of “alternative splicing,” a mechanism discussed in the previous blog entry Transposable DNA elements – Part 3.

This disease just puts an exclamation point on how important the alternative splicing subject is for all of us, not just for children born with this terrible disease. Alternative splicing also appears to play a major role in sporadic cases of inherited and sporadic Autism Spectrum Disorder.  It also plays a major role in depression and anxiety.  It also plays a role in schizophrenia, cancer, arteriosclerosis, diabetes mellitus, and hundreds of extremely rare diseases.  For this reason, Vince Giuliano and I have written these blog entries to help our readers understand “alternative splicing”, and have chosen HGPS as an illustration, a “case report” on how alternative splicing works.

Interestingly, we also report on very recent research about how manifestations of progerin-related aging can be reversed at least on the cell level with the aid of certain simple familiar chemicals.

Because this blog entry goes into considerable technical depth on several arcane subtopics, it is easy to lose track of what the important messages are.  Here is a list of them as I (Vince) see them.

  • HGPS is now a well understood model of accelerated aging.  We think we know a lot about the molecular mechanisms of it and what might be done about them.
  • In a nutshell, HGPS is due to a single-point mutation on a cryptic splice site in the Lamin A gene.  The result is the production of progerin instead of Lamin A, a molecule with a farnesylated tail that cannot be cleaved off as normal, meaning that proteins responsible for the integrity of internal cell structures are not produced.  When Lamin A does not develop and mutant prelamin A (progerin) accumulates,  hetrachromin anchoring proteins disappear.  As a result, the heterochromatin (compacted chromatin around silenced DNA) cannot be anchored to the nuclear envelope.  Then, the histones can no longer silence the DNA that should be silenced (Ex: transposable elements, pseudogenes, micro satellite regions, etc.). Consequently, transposable elements become activated and this induces DNA damage and much additional mischief.
  • HGPS is an interesting and highly informative model of ordinary aging.  The changes that happen over 15 years in HGPS also normally happen in dermal cells and vascular cells of normal individuals, but at a much slower rate.  We all seem to have slow-acting HGPS.
  • HGPS provides an example of how alternative splicing can trigger or accelerate the entire aging cascade.  It also provides an example of how a single gene abnormality can trigger the entire aging process.
  • There are several known substances that seem to reverse HGPS progeria and restore cellular morphology and operations to normal, on the cell level at least.  One of these, identified in 2011 is rapamycin.  More-recently identified are the familiar substances methylene blue and the cabbage-broccoli phytochemical sulfaforaphane.  Therapies so simple as proper mitochondrial antioxidants may hold the key to reversal of HGPS phenotypical symptoms on a cell level.  As yet, however it does not appear that this knowledge has either been translated into an effective therapy for HGPS or explored as a therapy for ordinary aging.
  • HGPS acts via a program of aging, following a known sequence of well-defined steps, although of course these are subject to a certain amount of stochastic variability.  Comparison of HGPS and normal aging gives additional credence to the fact that normal aging is also a programmed phenomenon and that the typical period of human aging is probably not immutable.
  • This blog explores many related technical topics such as morpholino oligonucleotides, cytoplasmic SRSF1and farnesylation inhibitors. And there are many complex diagrams illustrating molecular mechanisms. Please don’t let the technical detail derail you from getting these central messages.
  • More important results are sure to come soon.  There are too may leads and clues to cures for HGPS reported here for the research situation to slow down soon.  And in the process we may well get some important additional clues as to how further slow down normal aging.

As background, Vince provided an introduction to alternative splicing and a discussion of it in the context of genomic evolution in the blog entry just preceding this one Transposable DNA elements – Part 3 TEs and and other key mechanisms of evolution: incRNAs, A to I editing, alternative splicing and exonizationAlso, as a bit of ancient history, Vince published a short blog entry introducing HGPS back in 2009 Progerin, HGPS and a possible new theory of agingThe present blog entry expands on and updates that one.

II.  ABOUT SAM BURNS

To put a face on this terrible disease, We would like to share the story of Sam Burns, a child who was born to normal parents and has become the poster child for HGPS.  Unfortunately, Sam died last year, despite all of the efforts of modern science to ameliorate the disease.  Here is his picture and his story.

Image may be NSFW.
Clik here to view.
HGPS-1
Image may be NSFW.
Clik here to view.
HGPS-2

Image source:                            Image source: Sam at the age of 14 and his mother

Meet “Sam”, a happy child who has touched the lives of millions people with his positive attitude about life, despite being diagnosed with HGPS. The picture on the right is a picture of Sam with his mother when Sam was 14 years old.  He died in 2014 when he was only 17 years old. About 350 people worldwide have HGPS like Sam.  All of them die by age 20. Sam went public about his condition in the HBO documentary, “Life According to Sam” and a book about him was written.  See the trailer here.  Despite this dreadful condition that has killed everyone afflicted with HGPS, Sam remained upbeat about life and has shared his philosophy about how to live a happy life with 30 million people via a TEDx talk.  His TEDx talk is currently the 2nd most viewed TEDx talk out of over 30,000 TED talks that have been given.

Sam lived in Foxborough, Massachusetts and went to high school, like everyone else. He played percussion in the band and this was one of his favorite things to do.  He would have graduated this spring. A living memorial to him is being created now by his friends and family.  If he had survived, he would have graduated from high school this year.  Sam’s Mother, Leslie Gordon, PhD, an Associate Professor of Pediatrics at Brown University, was instrumental in starting the Progeria Research Foundation.  This foundation funded the recently published study which showed that rapamycin decreased the levels of the mutant form of Lamin A, called progerin, which builds up in the cells of HGPS patients.  Rapamycin is one of three strategies described below that have been shown to help treat this disease.

Following are some references about Sam and the Progeria Research Foundation.  Please view the TEDx talk that Sam Burns gave.  It is very touching and true for all of us.

Ref: https://www.youtube.com/watch?v=36m1o-tM05g&app=desktop

Breaking News: Sam Berns’ TEDx Talk Reaches 10 Million Views

<iframe width=”640″ height=”360″ src=”https://www.youtube.com/embed/36m1o-tM05g” frameborder=”0″ allowfullscreen></iframe>    embed code

2015 Living memorial being built as tribute to Sam Berns HBO documentary called ‘Life According to Sam’ gave people a rare look at progeria

2011 Good news in fight against premature aging disease

Progeria Researh Foundation

Despite being so rare, HGPS has received more attention than any other genetic mutation disease because it so closely “mimics” the normal picture of aging.  A main difference between normal aging and HGPS is that the entire “aging program” is completed in about 15 years with HGPS, whereas with normal aging, the “aging program” takes almost 100 years to complete. Whereas a few people with normal aging can live as long as 122 years, almost all of the people with HGPS die by 16-20 years of age. The most common findings in HGPS include features that mimic normal aging, such as alopecia, skin atrophy, mottled pigmentation of the skin, generalized lipodystrophy, joint stiffness, arthritis, arteriosclerosis, coronary artery disease, left ventricular enlargement, and strokes.  However, HGPS children also have unique findings that do not “mimic” normal aging, such as absent eyebrows, prominent eyes/proptosis, micrognathia, open cranial bone fontanelles, and absent sexual maturation.  This is why some have called HGPS a “caricature of normal aging”, rather than a “copy of normal aging.

For most of us, we don’t really care about this semantic difference. We are really looking for an answer to the question “what is the true cause of aging” and are hoping to find some clues in this rare, but tragic condition.  First I will talk about how our skin also accumulates the same protein that accumulated in Sam’s body and how this affects our skin and blood vessel aging.

III.  ALL OF US HAVE “DERMAL PROGERIA

Summary: Long wavelength UV light (e.g. tanning booth light) induces oxidative stress, which induces alternative splicing and the use of the cryptic splice site of LMNA, which produces the mutated prelamin A protein in both young and old human skin fibroblasts!   This is a major cause of skin aging and skin cancer.

Key distinctions

Before diving in further, here is a review of a few key distinctions related to alternative splicing for those of you less familiar with this area:

Alternative RNA splicing — “RNA splicing is an essential and precisely regulated post-transcriptional process that occurs prior to mRNA translation. It is thought that at least 70% of the approximately 25,000 genes in the human genome undergo alternative splicing and that, on average, a given gene gives rise to 4 alternatively spliced variants – encoding a total of 90,000 -100,000 proteins which differ in their sequence and therefore, in their activities.

A gene is first transcribed into a pre-messenger RNA (pre-mRNA), a copy of the genomic DNA containing both introns (destined normally to be removed during pre-mRNA processing) and exons (usually destined to be retained within the mRNA in order to code the protein sequence).

During RNA splicing, exons are either retained in the mRNA or targeted for removal in different combinations to create a diverse array of mRNAs from a single pre-mRNA.  This process is known as alternative RNA splicing.”

Citation and following illustration source

Image may be NSFW.
Clik here to view.
HGPS-3

Image may be NSFW.
Clik here to view.
HGPS-4

‘RNA splicing is specifically deregulated in disease conditions.  A precise understanding of these deregulations can reveal new targets for the discovery of more efficacious drugs or new biomarkers for the development of more accurate diagnostics.”

Spliceosome: “Pre-mRNA splicing is an essential, precisely regulated process that occurs after gene transcription and prior to mRNA translation. Pre-mRNA splicing begins with the ordered assembly and coordinated action of the particles U1, U2, U4, U5 and U6 snRNPs (small nuclear ribonucleoprotein particles) and non-snRNP proteins on the pre-mRNA. Each snRNP particle contains a small nuclear RNA molecule (snRNA) and several proteins. The complex of snRNPs and non-snRNPs is called the spliceosome. The process of pre-mRNA splicing can be divided into three stages (Visit the diagram from the Molecular Cell Biology book for more details or the animated movie –” Source; Human Splicing Finder , pre messenger RNA splicing.  You can also check out these additional explanations.

Cryptic splice site: “Eukaryotic genomes contain large numbers of splice sites, known as cryptic splice sites (css), which are generally held to be disadvantageous sites that are dormant or used only at low levels unless activated by mutation of nearby authentic or advantageous splice sites (1,2). Once activated, css may be used extremely efficiently, resulting in a wide range of genetic disease (3–5). It is generally accepted that css are suppressed by nearby stronger splice sites and that splice site selection can be viewed as a competition between the various potential splice sites in a pre-mRNA for the splicing machinery (1,2). — For genes with many introns it is suspected that up to 50% of mutations that cause disease do so by affecting splicing, either through the activation of css, exon skipping or disruption of alternative splicing (4–7). Css are found in exons as well as introns and their recognition by the splicing machinery is similar to splice site recognition in general and is dependent upon information both at the splice site and outside this region at enhancer and silencer sequences (8–10).” From the 2011 publication Cryptic splice sites and split genes.

HGPS and progerin indeed have a lot to do with normal aging

Until 2006, no one really thought that there was much true overlap between HGPS and normal aging.  After all, many experts called HGPS a “caricature of aging”, saying that this disease had no resemblance to normal aging.  Even expert scientists studying the biology of aging did not think that progerin, the mutant form of prelamin A, accumulated in cells undergoing normal aging.  No one says that today.  All of that old “dogma” has been thrown out the window as several independent research teams have published data between 2006 and 2013 which confirm that progerin accumulates in normal skin cells with aging and triggers the same cellular and molecular features of HGPS (which will be explained in detail in section #3 below).  Here are the studies that have over-turned the “dogma:”

2006 Lamin A-Dependent Nuclear Defects in Human Aging Scaffidi and Mistelli from the NIH laboratories showed that the same cryptic splice site in exon 11 of the LMNA gene is used by the spliceosome in healthy individuals and contributes to normal aging in everyone.  Whereas this alternative splice site is used constitutively in HGPS, it is used only sporadically in normal aging but creates the same nuclear defects as HGPS (abnormal nuclear shape, changes in histone modifications, and increased DNA damage).

2007 – The Mutant Form of Lamin A that Causes Hutchinson-Gilford Progeria Is a Biomarker of Cellular Aging in Human Skin   McClintock and a group from Columbia University, Brown University, and the NIH did a series of biopsies in normal individuals from newborn to age 97 showed that progerin mRNA and progerin protein levels were measurable in 150 skin biopsies from all age groups at low levels, but that the progerin protein was primarily localized in the skin in a subset of dermal fibroblasts near the basement membrane and the papillary dermis in young people, whereas with aging the number of dermal fibroblasts with progerin increased and extended to the deep reticular dermis in older patients. They documented that progerin was a biomarker of normal cellular aging and was linked to “terminal differentiation” and cellular senescence.

2013 – Longwave UV Light Induces the Aging-Associated Progerin   Takeuchi and Runger showed that UVA light (315-400nm) but not UVB, induced progerin expression and HGPS-like changes to all cells exposed to UVA light, but more in aged cells.  The molecular mechanism was UVA induction of reactive oxygen species (singlet oxygen), which triggered alternative splicing of the LMNA pre-mRNA, and the subsequent production of progerin proteins.  A single dose of UVA radiation increased progerin production by 2.5-2.7 fold, but this increase did not induce levels of progerin like what was seen at baseline in skin cells derived from HGPS patients where the progerin mRNA levels were 47.5 fold higher.  Moreover, the increased levels of progerin mRNA returned to normal within 24 hours in young skin fibroblasts but did not in normal skin from older patients or in skin from HGPS patients. A well designed part of this study proved that the increase in progerin mRNA was not due to an overall increase in the expression of the LMNA gene, since the normal LMNA pre-mRNA did not increase with UVA or UVB light exposure (in other words, UV light does not increase the transcription of the LMNA gene, but it changes the alternative splicing of the LMNA gene).

There was some “good news” in this landmark study by Takeuchi and Runger. They repeated the experiment in normal dermal fibroblast cells, but added an anti-oxidant to the in vitro study that quenched singlet oxygen free radicals (sodium azide).  This completely inhibited the production of progerin after exposure to UVA light, but did not decrease baseline progerin in the dermal fibroblasts.  This study lends credence to the    idea that anti-oxidants may help prevent but not treat skin aging.

Summary: The studies above clearly show that use of the cryptic splice site in exon 11 occurs with normal aging from age 0 to 97 and this induces alternative splicing of the LMNA pre-mRNA, producing progerin proteins with normal skin aging.  It also shows that UVA light (315-400 nm) accelerates this phenomena, but not UVB light (which damages DNA and RNA) which does not induce alternative splicing.  Previous studies had shown that UVC also induces alternative splicing of several genes that regulate apoptosis and cell proliferation (exon 4 skipping in the PIG3 transcripts, alternative splicing of MDM2 and MDM4 transcripts, alternative splicing of ABL1, CHEK2, and MAP4K2 transcripts). Thus the “old dogma” that HGPS and normal aging have no similarities is clearly wrong and has been abandoned.

Additional References:

2004 UV-dependent Alternative Splicing Uncouples p53 Activity and PIG3 Gene Function through Rapid Proteolytic Degradation  

2006 Genotoxic Stress Induces Coordinately Regulated Alternative Splicing of the p53 Modulators MDM2 and MDM4   

2009 DNA Damage Regulates Alternative Splicing through Inhibition of RNA Polymerase II Elongation

IV. WE ALL HAVE “VASCULAR PROGERIA

Summary: The LMNA gene is alternatively spliced in our blood vessels with telomere shortening-induced cellular senescence, along with 3 other alternatively spliced genes. We all have the same kind of progeria as in HGPS.  It is just working a lot slower.

A.  Introduction

Recently, a publication by Olive and colleagues showed that progerin builds up in a few of the cells in adventitia of arterial walls, with progerin being present in only 1 out of every 1,000 cells in a one month-old newborn, to 20 in 1,000 cells by 97 years of age. The increase amounted to a 3.34% increase per year.  Interestingly, the progerin in these cells was accumulating in the cytoplasm, which suggested that the mutant protein was accumulating over time after repeated mitotic events.  When these cells were analyzed, it was clear that the same cryptic splice site in exon 11 was being used in these endothelial cells which came from normal, healthy volunteers.  Here is a photomicrograph of the progerin building up in the adventitia, media, and plaque in coronary blood vessels in non-HGPS patients:

Image may be NSFW.
Clik here to view.
HGPS-5

Reference:  2010 Cardiovascular Pathology in Hutchinson-Gilford Progeria: Correlation with the Vascular Pathology of Aging  “…Importantly, though progerin was detected at higher rates in the HGPS coronary arteries, it was also present in non-HGPS individuals. Between ages one month and 97 years, progerin staining increased an average of 3.34% per year (P<0.0001) in coronary arteries. — Conclusion:  We find concordance between many aspects of cardiovascular pathology in both HGPS and geriatric patients.  HGPS generates a more prominent adventitial fibrosis than typical CVD.  Vascular progerin generation in young non-HGPS individuals, which significantly increases throughout life, strongly suggests that progerin has a role in the CV aging of the general population.”

Another recent study showed that cellular senescence activates the LMNA cryptic splice side and induces progerin production, whereas immortalized cells suppressed progerin production.  When they looked closely at the cause of cellular senescence, they showed that the production of progerin was dependent on telomere shortening.  Specifically, this happens when cellular senescence was induced by an oncogene (H-rasV12) or by sodium butyrate, an HDAC inhibitor that induces cell senescence in cells with normal telomeres.  Here is data from this:

Image reference:  (2011 Progerin and telomere dysfunction collaborate to trigger cellular senescence in normal human fibroblasts)

Image may be NSFW.
Clik here to view.
HGPS-6

The most interesting study, however, was a recent publication that showed how alternative splicing in 4 key genes occurs with endothelial cell senescence. One of these 4 genes that undergoes senescence-associated alternative splicing is the LMNA pre-mRNA.  This study is covered in detail below.

B.  Alternative Splicing Plays a Role in Endothelial Senescence

SRSF1 appears to be the regulator of how much and what kind of alternative splicing occurs in endothelial cells

The possibility that alternative splicing played a role in endothelial senescence spawned a flood of research over the past 8 years that has led to several ground-breaking discoveries. Specifically, there is now strong evidence that alternative splicing of at least 4 gene pre-mRNAs plays a major role in endothelial cell senescence, atherosclerosis, hypertension, coronary artery disease, cerebrovascular disease, renovascular disease, and peripheral artery disease. The most studied splicing factor that controls alternative splicing of genes involving atherosclerotic disease is serine-arginine splicing factor 1 (SRSF1).  SRSF1 plays a role in both “constitutive splicing” and “alternative splicing” of pre-mRNA, but has many other non-spacing roles in the cell as well (mRNA nuclear export, mRNA stability, mRNA quality control, mRNA translation, maintenance of genomic stability, and oncogenic transformation.

Image may be NSFW.
Clik here to view.
HGPS-7

2012 The splicing factor SRSF1 as a marker for endothelial senescence (full)

Image source

C. Examples of four genes that are alternatively spliced in endothelial cellsleading to endothelial cell senescence, atherosclerosis, CAD, hypertension, stroke, etc.

Although more alternatively spliced genes may be found that play a role in endothelial cell senescence, now it is clear that at least four genes undergo alternative splicing that are regulated by SRSF1.  This includes vascular endothelial growth factor A (VEGFA), tissue factor (TF) gene (T3), the lamin A gene (LMNA), and the endoglobin gene (ENG).  Interestingly, each of these four genes undergo a different type of alternative splicing.  For this reason, this is a good time to delve into the different types of alternative splicing that have been discovered.

C1. Tissue Factor gene (T3) An example of “exon skipping” in a key endothelial gene                             involving cell senescence

The protein made by tissue factor gene (T3) is the primary initiator of blood coagulation.  With atherosclerosis, a state of hypercoaguability exists that is due in part to the Tissue Factor protein (TF). Normally, TF is expressed as a transmembrane glycoprotein and is not secreted       into the bloodstream, but when tissue trauma occurs or when there are pro-inflammatory cytokines in the bloodstream, a soluble form of TF is produced and secreted by endothelial cells.  This soluble form of the TF protein occurs because of alternative splicing that is due to the activation of SRSF1.  When SRSF1 is activated or over-expressed, exon #5 is “skipped” during pre-mRNA splicing.  Exon #4 is directly connected to exon #6, producing an mRNA with a “translational frameshift”, leading to the production of a soluble form of TF.  The “exon skipping” type of alternative splicing of the T3 gene is illustrated below:

Image may be NSFW.
Clik here to view.
HGPS-8

Image source: 2012 The splicing factor SRSF1 as a marker for endothelial senescence

One of the consequences of circulating pro-inflammatory cytokines is deep venous thrombosis (DVT) and arterial clots with heart attacks and strokes.  The pro-inflammatory cytokine induced alternative splicing, directed by SRSF1, leads to exon #5 skipping of the T3 gene, thereby creating a soluble, secreted form of Tissue Factor (TF).  This phenomenon contributes to endothelial senescence and the disease called arteriosclerosis.

C2. Vascular Endothelial Growth Factor A gene (VEGFA) An example of abnormal 3’ splice site (3’-SS) selection in a key endothelial gene involving cell senescence.

The VEGF gene is a well-known growth factor gene that is normally thought of as having only an angiogenic role.  However, this is a major misconception!  The VEGFA gene actually can be either pro-angiogenic or anti-angiogenic, depending on how it is spliced.  The VEGFA gene actually produces two families of isoforms that are generated by alternative splice sites in its terminal exon #8.  In response to IGF-1 signaling, SRSF1 is inhibited and the spliceosome chooses the 3’ proximal splice site (PSS) in exon 8, which produces a pro-angiogenic isoform of VEGF (aka VEGFa).  However if TGF-beta signaling occurs and overpowers IGF-1 signaling, SRSF1 is activated and then chooses the 3’ distal splice site (DSS) in exon 8, which produces an anti-angiogenic isoform of VEGF, called VEGFb. Here is a diagram illustrating two alternative splice sites in the VEGF pre-mRNA:

Image may be NSFW.
Clik here to view.
HGPS-9

Image source: 2012 The splicing factor SRSF1 as a marker for endothelial senescence

Conclusion about VEGFA:  IGF-1 induces the use of the proximal 3’ splice site in             exon #8 and inhibits SRSF1, producing a vascular endothelial growth factor isoform that is pro-angiogenic.  TGF-beta extinguishes this effect activates SRSF1, which chooses the distal 3’ splice site in exon #8, producing a vascular endothelial growth factor isoform that is anti-angiogenic.  The phenomena occurs with endothelial cell senescence.

C3. Endoglin gene (ENG) An example of intron retention in a key endothelial cell gene involving cell senescence — explains TGF-beta mediated vascular fibrosis, endothelial telomerase suppression, and varicose veins!

Endoglin is an auxiliary co-receptor for TGF-beta that is found on the surface of endothelial cells. It plays a key role in vascular remodeling and angiogenesis.  Mutations in this gene lead to a terrible disease called “hereditary hemorrhagic telangiectasia Type I.”  The phenotype of this disease is vascular malformations.  When endothelial cells are not senescent, they express a pro-angiogenic long isoform of the gene called “L-endoglin”.  However, when endothelial cells become senescent, they express an alternatively spliced version of the protein called “S-endoglin” which is anti-angiogenic and pro-fibrotic.  The difference between the L-endoglin and S-endoglin pre-mRNA transcripts involves the inclusion of the intron between exon #13 and #14. If this intron is excluded, you get L-endoglin and the protein product is pro-angiogenic.  If this intron is included, due to SRSF1 activation of the spliceosome, then you get S-endoglin and a protein product that produces fibrosis of the blood vessel wall. The details on how this works is fascinating, since it explains why the telomerase gene (hTERT) is down-regulated in endothelial cells, in response to TGF-beta/Smad3/c-myc signaling.

Image may be NSFW.
Clik here to view.
HGPS-10

Image source: 2012 The splicing factor SRSF1 as a marker for endothelial senescence

This S-endoglin alternative-splicing induced effect also explains why varicose veins occur, also due to TGF-beta signaling.  However, the details of how this works is complicated and is beyond this introduction to alternative splicing.  For more information, however, look up some of the references below.

References:

2008 S-endoglin expression is induced in senescent endothelial cells and contributes to vascular pathology.

2012 PAI-1 in Tissue Fibrosis

2007 TGF-beta1 upregulation in the aging varicose vein

2007 Mechanisms of action of TGF-beta in cancer: evidence for Smad3 as a repressor of the hTERT gene

2002 The helix-loop-helix protein id-1 delays onset of replicative senescence in human endothelial cells

Conclusion about ENG:  The endoglobin gene plays a key role in endothelial cells, since      it encodes an auxiliary receptor for TGF-beta, a growth factor involved with fibrosis, endothelial  senescence, varicose veins, and telomere shortening in endothelial cells.  The ENG gene transcripts undergoes alternative splicing, producing two proteins with almost opposite effects, depending on SRSF1 splicing factor activation.  When SRSF1 is not activated, the ENG pre-mRNA undergoes normal splicing.  When SRSF1 is activated, intron inclusion occurs of the intron between exon #13 and #14, producing a protein that favors TGF-beta/Smad4/c-myc signaling.  This pathway leads to fibrosis of the blood vessel wall, the down regulation of the hTERT gene in endothelial cells, and the pathology of varicose veins.  This all starts with the inclusion of one intron!

C4. Lamin A gene (LMNA) – Example of alternative 5’ splice site (5’-SS) selection in a key endothelial cell gene involving cell senescence

The Lamin A gene is ubiquitously expressed in all mammalian cells, since it is an            indispensable structural member of the nuclear envelope.  As was seen in HGPS, in normal skin fibroblast aging, and in UVA-induced skin fibroblast aging, the same cryptic splice site in exon #11 is also used in endothelial cell aging (senescence).  Here SRSF1 triggers the use of the cryptic splice site in response to oxidative stress (ROS).  This produces a pre-mRNA that is 150 nucleotides short and a prelamin A protein that is missing 50 amino acids.  This shorter version of prelamin A does not go through the last of 4 steps in post translational modification of normal prelamin A, leading to a mutant form of prelamin A that cannot be incorporated into the nuclear envelope.  As a result, the mutant prelamin A builds up in the cell and leads to endothelial cell senescence.  Here is an illustration of this abnormal 5’ splice site selection in the LMNA gene.

Image may be NSFW.
Clik here to view.
HGPS-11

Image reference:2012 The splicing factor SRSF1 as a marker for endothelial senescence (full)

D.  What triggers SRSF1-induced alternative splicing? Cellular senescence and cellular stress induces cytoplasmic SRSF1-mediated alternative splicing. As a consequence, it is actually the accumulation of SRSF1 in the cytoplasm that occurs with cellular senescence.

D1. The many “jobs” of SRSF1?SRSF1 has 5 “jobs” in the nucleus and 2 “jobs” in the cytoplasm. 

By now we hope you are convinced that alternative splicing is an important subject.  We have raised more questions than we have answered.  However, it should also be clear by now that SRSF1 is a key “player” in the alternative splicing game. Some would say that SRSF1 is the “card dealer” that is mixing up the “exon cards” in this game of “gene cards”.  To call SRSF1 a “splicing factor”, however, is a gross understatement!  SRSF1 has been shown to have many different functions, depending on where it is located.  In the cell nucleus, it controls normal alternative splicing, miRNA processing, nonsense-mediated RNA decay, and mRNP export.  In the cytoplasm, it activates mTOR, which enhances mRNA translation initiation.  Another function of it in the cytoplasm is to mediate splicing of mRNA in the minor spliceosome, found in the cytoplasm.  Here is a diagram of 6 of these 7 “jobs” that SRSF1 has:

Image may be NSFW.
Clik here to view.
HGPS-12

Image reference: 2014 Emerging Functions of SRSF1, Splicing Factor and Oncoprotein, in RNA Metabolism and Cancer  “Figure 2. The multifunctional SR protein SRSF1. Splicing-dependent and independent functions of SRSF1 in the nucleus and the cytoplasm. EJC, exon junction complex; NFX1, nuclear exchange factor 1; NPC, nuclear pore complex; PTC, premature termination codon.”

Here is a list of the protein interactions of SRSF1 and its binding partners:

Image may be NSFW.
Clik here to view.
HGPS-13

Table reference: 2014 Emerging Functions of SRSF1, Splicing Factor and Oncoprotein, in RNA Metabolism and Cancer

By now, we are sure that you are curious as to what activates SRSF1?  The simple answer is that it depends on if SRSF1 is doing “constitutive splicing” or “stress-induced splicing”.  SRSF1 is necessary for both types of splicing events, so it is not necessary for cellular stress to occur for SRSF1-mediated constitutive splicing events to occur.  With alternative splicing, however, the usual triggers are stresses.  Not only oxidative stress, but other stressors can also activate SRSF1, such as oncogenic stress, UV-induced stress, X-ray induced stress, and osmotic stress.  However, SRSF1 must undergo phosphorylation by another splicing factor before both constitutive and alternative splicing can occur.  There are several enzymes that phosphorylate SRSF1 at specific sites, including Clk/Sty 1,2,3,    and 4 kinases; SRPK 1 and 2 kinases; and topoisomerase I.  SRSF1 is also dephosphorylated by phosphatases 1 and 2 if SRPK1 or 2 phosphorylates SRSF1 at a specific site that induces nuclear transport of SRSF1.  The actual transport occurs by a transport protein called “Transportin-SR”.  Clk/Sty kinases further phosphorylate SRSF1 in the nucleus.  This moves SRSF1 from the nuclear speckles to the active sites of transcription, where it promotes splicing.  Below is a graph of the effect of SRSF1 in exon skipping of the MDM2 pre-mRNA exon 11, which occurs when MCF-7 cells were radiated with UV light, with and without siRNA knockdown of SRSF1.

References:

2015 The RNA Splicing Response to DNA Damage

2015 Splicing factor SRSF1 negatively regulates alternative splicing of MDM2 under damage

Image may be NSFW.
Clik here to view.
HGPS-14

D2. The Key to Understanding SRSF1: Location, Location, Location!

What is more important than the source of cellular stress is the location of SRSF1.  As they say in real estate, the 3 keys are “location, location, location”. The same is true for SRSF1.  Normally, SRSF1 is found in both the cytoplasm and in the nucleus.  It can phosphorylate the major spliceosome proteins in the nucleus (triggering normal splicing of pre-mRNA) or it can remain in the cytoplasm where it can phosphorylate the minor spliceosome proteins in the cytoplasm (triggering alternative splicing of mRNA).  What determines if SRSF1 stays in the cytoplasm or migrates into the cell nucleus?  The protein kinases SRPK1 and Clk/Sty determine this.  SRPK1 is another important splicing factor that must be present in the cytoplasm to phosphorylate SRSF1 in response to cellular stress.  If the “dose” of stress is not too large, then SRPK1 stays in the cytoplasm and continuously phosphorylates SRSF1.  Once SRSF1 is phosphorylated by SRPK1, then a transport protein called “Transportin-SR” can bind to SRSF1 and “carry” it into the cell nucleus. When SRSF1 migrates into the cell nucleus, it localizes to heterochromatin granules called “nuclear speckles”. Thus the phosphorylation of SRSF1 by SRPK1 allows SRSF1 to migrate into the cell nucleus and participate in “constitutive splicing” events.

Thus the “location, location, location” rule for normal splicing is the nuclear localization of SRSF1, where SRSF1 mediates normal splicing. This is illustrated in the diagram below:

Image may be NSFW.
Clik here to view.
HGPS-15

Image reference from 2013 Pre-mRNA processing factors meet the DNA damage response

D3. What happens with high dose stress?Cytoplasmic “Location, Location, Location” of SRSF1

When the dose of cellular stress is high enough (due to ROS, UV, X-rays, osmotic stress, heat, etc.), it can trigger the check-point pathway mediated by p53 and Rb.  This triggers cellular senescence.  (A thorough discussion of cellular senescence is beyond the scope of this blog).  When this occurs, SRPK1 is released from its binding partners (heat shock proteins and co-chaperones) and is phosphorylated by Akt.  This triggers the nuclear localization of SRPK1.  When this occurs, SRPK1 can no longer phosphorylate SRSF1, and as a result, SRSF1 cannot migrate to the nucleus.  As a consequence, more SRSF1  is left behind in the cytoplasm.  This sounds “paradoxical”, but this is actually what occurs.  SRSF1 can actually modulate alternative splicing in the cytoplasm of some mRNA, such as the ENG mRNA, since this involves the minor spliceosome.

Image may be NSFW.
Clik here to view.
HGPS-16

Image reference: 2012 The splicing factor SRSF1 as a marker for endothelial senescence (full)

E.  What other factors determine Exon Skipping vs Exon Inclusion – UV light and Topoisomerase inhibitors acting on RNA Polymerase II

Cellular stressors such as UV light and genotoxic stress also can affect alternative splicing via other molecular mechanisms besides SRSF1 and SRPK1.  One example of this is how UV light or topoisomerase I inhibitors like camptothecin affect exon skipping or exon inclusion.  UV light or camptothecin both slowed the rate at which RNA Polymerase II elongation occurred, as it copied the RNA transcript from DNA.  When RNA Polymerase II was transcribing at a fast rate, exon skipping would occur sometimes.  When UV light or camptothecin were administered to colon cancer or breast cancer cells in vitro, exon skipping did not occur.  The details of exactly how this occurs is too complicated to present here.  Here is a reference for those who wish to delve into this in more detail.

Image may be NSFW.
Clik here to view.
HGPS-17

Reference and image source: 2013 Pre-mRNA processing factors meet the DNA damage response.  “FIGURE 2. DNA damage affects splicing decisions by modulating the phosphorylation status of RNAPII and the elongation rate of transcription.   CPT-induced Top1ccs have immediate and specific effects on RNAPII. CPT triggers a high degree of phosphorylation of the largest subunit (Rpb1) of RNAPII (Baranello et al., 2010). Ultraviolet (UV) irradiation affects cotranscriptional alternative splicing in a p53-independent manner, through hyperphosphorylation of the RNAPII carboxy-terminal domain (CTD) and subsequent inhibition of transcriptional elongation (Muñoz et al., 2009).”

Summary:  In this section, we clearly showed the scientific evidence that progerin accumulates as a function of chronological aging in the blood vessel walls of normal individuals who do not have HGPS.  Although the adventitia has the highest concentration of progerin, it also accumulates in the media and intima as well.  Progerin accumulation in the walls of blood vessels only affects 1 out of every 1,000 cells at birth and increases at a rate of 3.34% per year.  As the endothelial cells divide, they “pass on” the progerin to subsequent generations of daughter cells.  Cellular senescence induced by short telomeres but not by oncogenes is the necessary trigger for the activation of the cryptic splice site in the LMNA exon 11.  At least 3 other genes undergo alternative splicing with endothelial cell senescence – VEGFA, ENG, and T3. These 3 genes and LMNA are each alternatively spliced by different splicing methods, with each one undergoing the following alternative splicing:

Gene    Location of SRSF1 & AS Method  Trigger of Alternative Splicing Consequence of AS
T3 cytoplasmic SRSF1-induced exon skipping of exon #5 Pro-inflammatory cytokines or cellular senescence Tissue factor protein becomes prothrombotic and soluble (circulates in plasma)
VEGFA               cytoplasmic SRSF1-induced distal 3’ splice site in exon #8 TGF-beta cytokine or cellular senescence                                                     VEGF  becomes anti-angiogenic
ENG cytoplasmic SRSF1-induced intron inclusion cellular senescence Endoglin protein acts as a TGF-beta receptor, inducing fibrosis, down regulation of hTERT, etc.
LMNA cytoplasmic SRSF1-induced 5’ splice site in exon #11 oxidative stress or replicative senescence prelamin A induces aging of the cells, loss of heterochromatin mark,


H3K9me3, loss of HP1a

These four genes are all induced by the cytoplasmic localization of SRSF1, a splicing protein that is involved in a diverse set of cellular activities including alternative splicing, miRNA processing, RNP export out of the nucleus, nucleolar stress response, nonsense-mediated mRNA decay in the nucleus, and the activation of mTOR in the cytoplasm. In summary, SRSF1 plays a key role in alternative splicing and incellular senescence.

V.  HGPS: AN EXAMPLE OF HOW ALTERNATIVE SPLICING CAN TRIGGER AND ACCELERATE THE ENTIRE AGING CASCADE

Summary:The trigger of aging in HGPS is a single mutant protein that cannot get rid of its farnesylated “tail” (no “clipping site” on the protein). The “unclipped”, farnesylated version of prelamin A accumulates and causes accelerated aging.

The first obvious lesson we can learn from HGPS is that “a single gene abnormality can trigger the entire aging program”. This is not to say that aging is simply due to a cryptic space site mutation in the LMNA gene, but rather that one cryptic splice site can trigger all of aging.  HGPS is not the only disease that can do this.  Several other diseases due to single point mutations in completely different genes can do the same thing (Ex: Werner’s syndrome, Cockayne syndrome, xeroderma pigmentosum, Fanconi’s anemia, etc.). However none of these other mutations produce an “aging phenotype” at such a young age or that has such a close resemblance to normal aging.  For instance, Werner’s syndrome does produce an accelerated aging phenotype that looks like normal aging, but occurs later in life (This is why Werner’s syndrome is often called “adult progeria”).  In the case of HGPS, the aging trigger is a point mutation in a exon for a protein-coding gene called called Lamin A (LMNA). LMNA codes for a key structural component of the nuclear cytoskeleton, which is required to maintain nuclear shape and DNA organization.  Maintaining this 3D structure of the nucleus is vital for normal cellular function.  Lamin A, Lamin B, and Lamin C produce a nuclear scaffold along with several other Lamin proteins, which creates the 3D structure of the nucleus.  In HGPS, the point mutation in the LMNA gene causes an abnormal splice signal in codon 608 in exon 11 of the LMNA pre-mRNA.  At this point, a cytosine is substituted for a thymine nucleotide (C > 608 T).  Here is an illustration of this:

Image may be NSFW.
Clik here to view.
HGPS-19
Image may be NSFW.
Clik here to view.
HGPS-18

Illustration source: What causes progeria?

This results in part of exon 11 being excised with the adjacent intron (between exon 11 and exon 12).  As a result, the last 150 amino acids of the prelamin A protein are missing. When the last 150 nucleotides of exon 11 are cut off by the spliceosome, the mRNA produces a mutant pre-protein called prelamin A, with 50 missing amino acids.  This prelamin A does not get processed correctly during post-translational modification.  Here are the post translational modifications of the prelamin A protein in wild type and HGPS prelamin A:

Image may be NSFW.
Clik here to view.
HGPS-20

Image source: 2009 Genomic Instability and DNA Damage Responses in Progeria Arising from Defective Maturation of Prelamin A

When prelamin A is not processed correctly and does not loose its “tail, the protein is called “progerin”. It does not get incorporated into the nuclear envelope correctly and accumulates in the nucleus. As a result the Lamin Associated Domains (LADs) of condensed chromatin do not get anchored to the nuclear envelope. Here is an illustration of how the lamin proteins are so important for anchoring condensed chromatin (silenced DNA) to the nuclear envelope.

Image may be NSFW.
Clik here to view.
HGPS-21

Image reference: 2013 Mechanisms of heterochromatin subnuclear localization

When lamin A does not develop and mutant prelamin A (progerin) accumulates the anchoring proteins disappear (like HP1a).  As a result, the heterochromatin (compacted chromatin around silenced DNA) cannot be anchored to the nuclear envelope.  Heterochromatin is normally localized in this subnuclear location.

As a result, the histones can no longer silence the DNA that should be silenced (Ex: transposable elements, pseudogenes, micro satellite regions, etc.). Consequently, the transposable elements become activated and this induces DNA damage. The following illustration shows two chromosomes (blue and green) and how their condensed chromatin (heterochromatin) is anchored to the lamina of the nuclear envelope.

Image may be NSFW.
Clik here to view.
HGPS-22

Image and legend source:  Chromosomal Nature-Before, During and After Gene Activation:

“Lamin Associated Domains LADs may consist of relatively condensed chromatin (thick lines) and aggregate at the nuclear lamina. Other repressed regions may interact with each other in the nuclear interior, as do active regions. Complexes formed by components of the transcription machinery (transcription factories) and CTCF may tether active regions together. Parts of only two chromosomes are depicted, each in a different color for clarity. Most interactions occur within chromosomes, and relatively few occur between chromosomes;Bas van Steensel & Job Dekker; http://www.nature.com/”

Summary: 85-90% of HGPS cases are due to a single point mutation in codon 608 in exon 11 in the LMNA gene that encodes for two proteins – Lamin A and Lamin C. As a result, a cryptic splice site is used to “excise” the last 150 nucleotides of axon 11 during the processing of the LMNA pre-mRNA. This produces a pre protein that is 50 amino acids too short and does not contain the “endoproteolytic site” that is used by the enzyme Zmpste24 to “cut the tail” of the prelamin A. As a result, prelamin A cannot be incorporated into the cell nuclear cytoskeleton and the following cascade of events happens. It is this cascade of events that “causes the aging”, not the prelamin A, per se.

  1. Loss of the normal size and shape of the cell nucleus (Lamin A is a nuclear structural protein) in 70% of the cells. The nuclei have wrinkles, herniations, and lobules of their nuclear element.
  2. Loss of other nuclear cytoskeleton proteins – With HPGS, not only does Lamin A levels decrease by 95% in the cell nucleus, there is also a 6-fold decrease in the amount of Lamin B in the nucleus as well. Lamin B is an important nuclear cytoskeleton protein that is encoded by the same gene (LMNA. In HGPS, there is a 70% decline in Lamin B levels too. Other nuclear cytoskeletal proteins are also depleted or misplaced, such as the lamina-associated polypeptides (LAP2s), which are also depleted 6-fold.
  3. Loss of chromatin anchoring to the nuclear cytoskeleton. With HGPS, there is a 2-fold decrease in the protein (HP1), which is an anchoring protein that tethers chromatin (histone proteins) to the nuclear cytoskeleton (i.e. lamina proteins). HP1 is called an “adaptor protein” or “linker protein” that secures the chromatin to the nuclear skeleton, allowing the chromatin to be organized in a 3D fashion.
  4. Reduction or complete loss of “junk DNA” silencing. There is a very important histone mark that indicates the DNA wound around the nucleosome is “turned off” or “silent”. This histone mark is the trimethylation of lysine 9 on histone subunit H3 (aka H3K9me3).  With HGPS, in 60% of the cells the H3K9me3 histone modification is lost.  H3K9 trimethylation (H3K9me3) is a universal feature of heterochromatin, the part of our DNA that should remain “silenced”.  When histone H3K9 trimethylation is lost, the DNA is no longer compacted and the “junk DNA” gets transcribed.  This is a bad thing that leads to the re-expression of transposable elements, pseudogenes, and satellite repeats, which should NOT be transcribed. Thus the loss of  HP1 and H3K9me3 that occurs as a result of the abnormal lamin A-induced loss of 3D structure of the nucleus means that a massive amount of “junk DNA” gets transcribed, which is a major molecular feature of aging.

VI.  THERE IS HOPE FOR HGPS – THE AGING PROGRAM CAN BE REVERSED OR SLOWED DOWN

Another important lesson we can learn from HGPS is that this disease shows that aging is more like a program which is accelerated from the normal 100 years (normal aging) to 15 years (HGPS).  Nature has given us many examples of “molecular programs”, such as gestation (9 months long), embryogenesis (12 weeks long), apoptosis (3-5 days long), circadian rhythms (1 day long), and ultradian rhythms (less than 24 hours long).  It is hard for most people to accept that aging is programmed too, but there is good evidence for this.  The best line of evidence against a non-programmed type of aging is that 100% of humans develop the same set of features with aging in a similar order of events (presbyopia, alopecia, whitening of the hair, skin thinning, atherosclerosis, skin discoloration, menopause, andropause, osteoporosis, arthritis, cognitive changes, sarcopenia, etc.)  If aging was truly a random, stochastic event, the features of aging would occur in random order and would not affect 100% of human beings (i.e. random events don’t happen 100% of the time in the same order).  The fact that over 80% of the features of normal aging are also seen in children with HGPS suggest that this disease is truly an accelerated aging model. The million dollar question, however, is can this aging program be reversed or slowed?

The answer for HGPS is “yes” and the three methods below illustrate how this can be done, at least on the cellular level.. The first method tackles the “upstream cause” of HGPS.  The next two tackle more of the “downstream effects” of HPGS.  All three showed amazing results and have huge implications for human aging.  And, more recent even more amazing methods are reported in subsequent sections below.

  1. Morpholino oligonucleotides – In 2005, the first effective in vitro therapy for progeria cells derived from 5 individuals who actually had HGPS was demonstrated by Paola Scaffidi and Tom Mistily at the National Cancer Institute, NIH (ref).  Although their proof-of-concept experiment was only a test tube study, they were able to reverse the cellular and molecular features of HGPS cells, restoring normal ellipsoid shape of the cells and restoring the production of normal, non-mutant lamin A proteins.  Surprisingly, the strategy also restored normal lamin B, LAP2, and HP1⍺ in the 90% of the cells. Even the H3K9me3 histone status was restored.  Reversal of the HGPS phenotype on a cellular and molecular level did not require the cells to divide (mitosis) and did not require the cells to disassemble their nuclear cytoskeleton (which occurs with mitosis).  What was most amazing was that normal gene expression levels also occurred in the 5 genes that they checked (MMP3, HAS3, TIMP3, MMP14, and CCL8).  These fibroblast genes are dysregulated in both HGPS and normal aging (ref).  How did they induce such an astounding reversal of such a horrible disease?  By blocking the abnormal splice side on the LMNA pre-mRNA.  This was accomplished with a synthetic strand of nucleotides called a “morpholino oligonucleotide”.

The morpholinos had a sequence of nucleotides that perfectly matched the 25 nucleotide region at the abnormal splice site in exon 11 of the LMNA pre-mRNA. (i.e. it was an antisense strand of nucleotides).   Morpholinos are not made of normal DNA or RNA and therefore do not work (transiently) like siRNA do to block processed mRNA.  Instead, morpholinos are synthetic sequence that look like RNA or DNA, but do not have ribose and phosphate groups like RNA or DNA. Instead, the ribose (or deoxyribose) sugars have been replaced with 6-membered “morpholino rings” and the phosphate linkers have been replaced with  hosphorodiamidate groups. Here is picture of a morpholino oligonucleotide and an illustration of of a morpholino binding to the alternative splice site in an exon of a pre-mRNA (not exon 11 in HGPS).

Image may be NSFW.
Clik here to view.
HGPS-23

Image source:  Wikipedia Morpholino

As a result of the two synthetic changes to the oligonucleotide, the morpholinos are very stable and resist degradation by morpholine rings.  They are very stable and cannot be degraded by enzymes (Nucleases) that degrade nucleic acid fragments.  Scaffidi and Mistily took cultured fibroblast cells derived from patients with HGPS and showed that an antisense morpholino that covered up the a cryptic splice site on the pre-mRNAs transcribed from the LMNA gene.  The morpholinos blocked the pre-mRNA before the splicing machinery could get to the pre-mRNA. Then when the splicosome removed the introns from the LMNA pre-mRNA, they did not excise the last 150 oligonucleotides from exon 11, thereby allowing a full length Lamin A protein to be made in the ribosomes.

  1. Farnesyl Transferease Inhibitors – Lamin A, like most proteins, undergoes post translational modifications. Before the Lamin A protein is modified, it is called “prelamin A”. Prelamin A undergoes four, sequential post translational modifications, as follows:
    1. Farnesylation – Prelamin A has 98 amino acids on its C-terminus that are not present in the final processed lamin A protein. This 98 amino acid “tail” of prelamin A has a CaaX motif that triggers an enzyme called “Farnesyl Transferase” to add a 15 carbon isoprenoid lipid to the protein called “farnesyl”. Here is a diagram of this farnesyl attached to the protein:

Image may be NSFW.
Clik here to view.
HGPS-24

Image source: What-when-how — Farnesylation

Additional reference:  2006 Prelamin A Farnesylation and Progeroid Syndromes

B.  Endoproteolytic release of 3 amino acids – The next step in post-translational processing of prelamin A is the removal of three amino acids from the “tail” of prelamin A. This is probably done by the enzyme, Zmpste24 (see illustration below).

C.  Methylation of the carboxyterminus – The 3rd step in the post translational processing of prelamin A is the methylation of the “tail” of prelamin A.  This is probably done by the enzyme, Icmt.  This step is also illustrated below.  Unfortunately, in HGPS, this prelamin A is a mutant protein and does not undergo the last step in post translational processing, which is to remove this farnesylated, methylated “tail” of prelamin A.

Image may be NSFW.
Clik here to view.
HGPS-25

Image reference:  2005 Thematic Review Series: Lipid Posttranslational Modifications.Prelamin A, Zmpste24, misshapen cell nuclei, and progeria—new evidence suggesting that protein farnesylation could be important for disease pathogenesis

D. Clevage of the farnesylated, methylated “tail” of prelamin A – All of the above post-translational modifications of prelamin A must then be removed before prelamin A becomes “lamin A”. Interestingly, the same enzyme that carries out step #2 also carried out this step Zmpste24, a zinc metalloproteinase enzyme. Here is a diagram illustrating the difference between normal prelamin A processing and HGPS prelamin A processing, where this step does not occurImage may be NSFW.
Clik here to view.
HGPS-26

Image reference:  2005 Thematic Review Series: Lipid Post-translational Modifications.Prelamin A, Zmpste24, misshapen cell nuclei, and progeria—new evidence suggesting that protein farnesylation could be important for disease pathogenesis

Additional reference: 2004 Heterozygosity for Lmna deficiency eliminates the progeria-like phenotypes in Zmpste24-deficient mice

Inhibition of the first step in the above process has been shown to alleviate some of the symptoms of HGPS in cell models of the disease, in animal models of the disease, and in human clinical trials of the Farnesyl Transferase inhibitors.  Farnesyl Transferase inhibitors are of great interest in cancer biology, since they showed a lot of in vitro promise in treating cancers with mutations in the ras family of oncogenes (H-ras, N-ras, and K-ras). The proteins produced from each of these genes undergo farnesylation, just like prelamin A does.  As a consequence, farnesyl transferase inhibitors have shown promise in clinical trials for cancers where these genes are muted, such as pancreatic cancer (80% have K-ras mutations), colon cancer (40-50% have K-ras mutations), thyroid cancer (50-80%) have mutations in either K-ras, N-ras, or H-ras), and many other cancers. Here are some structures of different farnesyl transferase inhibitor drugs that have been developed for cancer.

Image may be NSFW.
Clik here to view.
HGPS-27

Image reference: 2004 Heterozygosity for Lmna deficiency eliminates the progeria-like phenotypes in Zmpste24-deficient mice

Unfortunately, the clinical trials of farnesyl transferase inhibitors (FTIs) for cancer have all failed and none of been FDA approved to date.  This has been due mostly to side effects of the drugs, since they not only inhibit the farnesylation of ras pre-proteins, but also inhibit the farnesylation of many other pre-proteins during post translational modification.  For HGPS, only one FTI has completed phase II clinical trials.  In progeria patients, this FTI, called “lanafarnib”, reduced the prevalence of stroke, transient ischemic attacks, and headaches.  It also improved height and diminished the rigidity of the bones in these progeria patients when combined with a cocktail of two other drugs.

References:

2012 Experimental Drug Is First To Help Kids With Premature-Aging Disease

2012 Clinical trial of a farnesyltransferase inhibitor in children with Hutchinson–Gilford progeria syndrome

  1. mTOR inhibitors – In 2012, Cao and colleagues from the NIH laboratory reported on a remarkable in vitro experiment where they treated HGPS fibroblasts with the mTOR inhibitor, rapamycin. Remarkably, rapamycin abolished nuclear blabbing, delayed the onset of cellular senescence, and enhanced the degradation of the progerin proteins in the HGPS fibroblasts. Rapamycin also induced autophagy, which decreased the insoluble progerin aggregates.

References:

2011 Rapamycin Reverses Cellular Phenotypes and Enhances Mutant Protein Clearance in Hutchinson-Gilford Progeria Syndrome Cells

2012 Rapamycin activates autophagy in Hutchinson-Gilford progeria syndrome – Implications for normal aging and age-dependent neurodegenerative disorders

Here is a diagram from an editorial written about this subject in a simple, clear cut mechanistic explanation:

Image may be NSFW.
Clik here to view.
HGPS-28

2011 Image source: Progeria, rapamycin and normal aging: recent breakthrough

VII.  Why the HGPS de novo mutations are only heterozygous (single copy) and why the inherited HGPS mutations require two copies homozygous) to create symptoms.

Understanding the molecular biology behind the principles of “loss of heterozygosity” and “autosomal dominance”

HGPS has one very odd finding.  Some cases require two “bad copies” of the LMNA gene (14%), whereas the majority of cases have only one “bad copy” of the LMNA gene (86%).  When it takes two bad copies to produce the disease and the gene is found on a non-sex chromosome (i.e. not an X or Y), this is called “homozygous autosomal recessive”. When the disease can be manifest even if only one copy of the gene is mutated (even though there is a normal copy of the gene), this is called “heterozygous autosomal dominant”.  

Another odd finding in HGPS is that all of the homozygous autosomal recessive cases are due to inherited “bad copies” of the LMNA gene.  This means that both parents have to have a “bad copy” of the LMNA gene and then must pass this “bad copy” on to their children.  However, the other odd finding in HGPS is that all of the heterozygous autosomal dominant cases are due to de novo mutations, which means the single “bad copy” of the LMNA gene occurred spontaneously, in the germ line cell from the mother’s ovary or father’s testes.  No cases of heterozygous autosomal dominant HGPS have been found, since these children cannot have children of their own (they are sterile and die as teenagers).

Reference: 2016 Homozygous missense mutation in the lamin A/C gene causes autosomal recessive Hutchinson-Gilford progeria syndrome

How can we understand this “heterozygous” vs “homozygous” paradox in HGPS?  Well, we have to go back and look at what portion of the LMNA gene is mutated to understand why certain parts of the gene produce symptoms with only one copy (autosomal dominance) whereas other parts of the gene produce symptoms only if both copies mutated (autosomal recessive).   Without understanding this, the puzzle will never be solved and we will miss a critical principle that is key to understanding aging and cancer – the concept of “loss of heterozygosity”.

a.  Mutations in non-splice sites create HGPS only if both copies are bad (i.e. heterozygous autosomal recessive). There are other mutations in the LMNA gene that produce HGPS. One of these is the “K542N” mutation, found in exon 10.  This mutation is called a “missense mutation” since it involves a protein coding part of the gene and it changes the amino acid sequence of the lamin proteins A and C from a lysine to an arginine.  The “K542N” mutation can be passed on from generation  to generation because carrying one copy of the gene does not cause the disease.  If a person only has one copy of the “K542N” mutation in the LMNA gene, they do not develop HGPS and are phenotypically normal.  If the person (inherits) two copies of the “K542N” mutation, they develop the disease. When geneticists looked at the gene sequence mutated in the “K542N” cases, they found that this mutation DID NOT affect splicing!  It was NOT in a splice site.  Instead, it was a coding portion of the gene (exon 10) shared by both the lamin A and lamin C versions of the protein (i.e. both splice variants, but not the splice site).  This discovery was a huge breakthrough in understanding why and how both copies of the gene had to be mutated if it was a “non-splice site” mutation, whereas with the splice site mutation, only one copy of the gene had to be mutated.

Reference: 2004 Homozygous missense mutation in the lamin A/C gene causes autosomal recessive Hutchinson-Gilford progeria syndrome

b.  Splice-site mutations create HGPS only if one copy of the gene is bad (i.e. homozygous autosomal dominant). The mutations are point mutations in a the LMN gene, found on the 1st chromosome, on the long arm at region 22 (1q22). 86% of the LMN mutations involve a heterozygous mutation of a splicing site, called the “G608G mutation”, which is expressed in an autosomal dominant manner. These heterozygous autosomal dominant cases are all de novo mutations and are therefore not inherited (since the carriers die before they can have children). However, autosomal recessive modes of inheritance have been found and are due to homozygous mutations in gremlin cells.  Here the mutation is called the “K542N mutation”.  With the K542N mutation, heterozygous carriers are phenotypically normal and this is why the mutation can be passed on from generation to generation.

 VIII.  AN OLD FAVORITE CHEMICAL -METHYLENE BLUE – APPEARS TO  COMPLETELY RESCUE PROGERIN-AFFETED HGPS CELLS AND COULD POSSIBLY BE USEFUL FOR TREATING HGPS ITSELF 

The research supporting this finding was published in Aging Cell with issue date of Dec 14 2015 in the publicatiom Methylene blue alleviates nuclear and mitochondrial abnormalities in progeria  “Hutchinson–Gilford progeria syndrome (HGPS), a fatal premature aging disease, is caused by a single-nucleotide mutation in the LMNA gene. Previous reports have focused on nuclear phenotypes in HGPS cells, yet the potential contribution of the mitochondria, a key player in normal aging, remains unclear. Using high-resolution microscopy analysis, we demonstrated a significantly increased fraction of swollen and fragmented mitochondria and a marked reduction in mitochondrial mobility in HGPS fibroblast cells. Notably, the expression of PGC-1α, a central regulator of mitochondrial biogenesis, was inhibited by progerin. To rescue mitochondrial defects, we treated HGPS cells with a mitochondrial-targeting antioxidant methylene blue (MB). Our analysis indicated that MB treatment not only alleviated the mitochondrial defects but also rescued the hallmark nuclear abnormalities in HGPS cells. Additional analysis suggested that MB treatment released progerin from the nuclear membrane, rescued perinuclear heterochromatin loss and corrected misregulated gene expression in HGPS cells. Together, these results demonstrate a role of mitochondrial dysfunction in developing the premature aging phenotypes in HGPS cells and suggest MB as a promising therapeutic approach for HGPS.”

The article notes a number of other interesting observtions related to HGPS not covered so far in this blog entry,   I (Vince) thought this passage on to be particularly interesting: “Progerin suppresses the expression of PGC-1α  PGC-1α serves as a master inducer of mitochondrial biogenesis through its co-activation of nuclear respiratory factors (NRFs), which control the expression of nuclear genes encoding mitochondrial proteins (Wu et al., 1999; Finck & Kelly, 2006). Using adipogenesis array, we previously reported that in HGPS adipocytes, PGC-1α was the most severely downregulated gene among the 84 genes involved in energy metabolism (Xiong et al., 2013). Thus, to understand how progerin causes mitochondrial defects, we first examined PGC-1α expression in HGPS fibroblasts. Quantitative RT–PCR experiments revealed that the PGC-1α mRNA level declined by eight folds in HGPS cell lines compared to normal cell lines (Fig. 3A). Immunofluorescence with an anti-PGC-1α antibody showed weakened or a complete loss of PGC-1α nuclear staining in HGPS cells (Fig. 3B). Western blotting analysis further confirmed the reduction of PGC-1α protein in HGPS cells (Fig. 3C). Consistent with the downregulation of PGC-1α, we found that most of PGC-1α’s downstream target genes, including Nrf1, Tfam1, Mfn1, Mfn2, Opa1, Fis1, and Drp1 (Dillon et al., 2012), were significantly suppressed in HGPS cells (Fig. 3D). We further confirmed the inhibitory effect of progerin on PGC-1α using lentiviruses expressing GFP-progerin (Fig. 3E). To test whether restoration of PGC-1α in HGPS cells alleviates the mitochondrial defects, lentiviruses carrying either a control lamin A gene (LA) or human PGC-1α gene were applied to HGPS fibroblast cells (Fig. 3F). To our surprise, we did not detect any obvious improvements in mitochondrial morphology or behavior (representative cell images shown in Fig. 3G). Instead, an elevated mitochondrial ROS in PGC-1α-expressing cells was found, in comparison with the control lamin A (LA)-expressing cells (Fig. 3F). Taken together, these results suggest that while PGC-1α has an established role in regulating mitochondrial biogenesis, correction of PGC-1α expression alone might not be sufficient to rescue the severe mitochondrial phenotypes caused by progerin.”

IX.   SULFORAPHANE ALSO APPEARS TO ENHANCE PROGERIN CLEARANCE

A 2015 article in Aging Cell. Reports on how another familiar substance appears to be able to clear progerin from HGPS cells and reverse phenotypic HGPS symptoms on a cell level.   Sulforaphane enhances progerin clearance in Hutchinson-Gilford progeria fibroblasts.  “Hutchinson-Gilford progeria syndrome (HGPS, OMIM 176670) is a rare multisystem childhood premature aging disorder linked to mutations in the LMNA gene. The most common HGPS mutation is found at position G608G within exon 11 of the LMNA gene. This mutation results in the deletion of 50 amino acids at the carboxyl-terminal tail of prelamin A, and the truncated protein is called progerin. Progerin only undergoes a subset of the normal post-translational modifications and remains permanently farnesylated. Several attempts to rescue the normal cellular phenotype with farnesyltransferase inhibitors (FTIs) and other compounds have resulted in partial cellular recovery. Using proteomics, we report here that progerin induces changes in the composition of the HGPS nuclear proteome, including alterations to several components of the protein degradation pathways. Consequently, proteasome activity and autophagy are impaired in HGPS cells. To restore protein clearance in HGPS cells, we treated HGPS cultures with sulforaphane (SFN), an antioxidant derived from cruciferous vegetables. We determined that SFN stimulates proteasome activity and autophagy in normal and HGPS fibroblast cultures. Specifically, SFN enhances progerin clearance by autophagy and reverses the phenotypic changes that are the hallmarks of HGPS. Therefore, SFN is a promising therapeutic avenue for children with HGPS.

————————————————

As a final comment, based on these very-recent results, I (Vince) would bet that there are several other common mitochondrial antioxidants that can reverse phenotypic characteristics of HGPS on a cell level at least.   I am optimistic that we will soon be able to defeat this dreadful disease for once and for all.  Learning about HGPS about a dozen years ago was a major emotional factor for my making longevity sciences my current career.


2016 meeting of the International Dose-response Society

Note by Vince Giuliano

As has been the case in several previous years, I intend to attend the 2016 annual meeting of the International Dose-response Society which will be held on the Campus of the University of Massachusetts in Amherst MA on April 19-20. As regular readers of this blog know, my opinion is that non-linear responses at very low doses to a broad variety of stimuli is a fundamental characteristic of all biological entities at each of their multiple levels of organization.  In various writings I have repeatedly pointed out how this property, broadly known as hormesis, is fundamental to biology and understanding of development and aging.  It is likely to be a fundamental pillar of any emerging Grand Unified Theory of Biology. Non-linear responses to dangerous stresses, for example, trigger evolution by  an identifiable mechanism(ref).  Some of the articles Jim Watson and I have produced on this hormesis phenomenon are listed here.     Suffice it to say that the International Dose-response Society is the central professional group concerned with hormesis, and the 2016 program looks at some of the highly practical and exciting applications of it.

Conference Program

The theme of the 2016 program is

Preconditioning in Biology and Medicine – Mechanisms and Translational Research  — Building Biological Shields Against Disease and Injury

The preliminary program for the 2016 meeting including registration information can be found here.

From the introduction to the program:  “A growing number of scientists, including toxicologists, pharmacologists, biostatisticians, epidemiologists, occupational and environmental medical researchers and others have begun to display considerable interest in the topic of hormesis, a dose response phenomenon characterized by a low dose stimulation and a high dose inhibition. While there are many professional societies that have a general interest in dose response relationships, none explicitly is devoted to the topic of understanding the nature of the dose response in general and hormesis in particular. The diversity of professional societies that may consider dose response issues, including hormesis, is nonetheless quite broad ranging from the agricultural to the biomedical and clinical sciences. However, nearly without exception, these societies tend to be strongly organized around professional advancement and not focused on specific scientific concepts. This makes the issue of hormesis one of diffuse interest across a broad range of professions. The present situation represents a major obstacle for the integrated assessment of the dose response in general and hormesis in particular. In order to provide intellectual and research leadership on the topic of hormesis, a professional association was created in 2005 called the International Dose-Response Society. The Society is dedicated to the enhancement, exchange, and dissemination of ongoing global research efforts in the field of hormesis. In addition, the Society also strongly encourages the assessment of the implications of hormesis for such diverse fields as toxicology, risk assessment, risk communication, medicine, numerous areas of biomedical research, and all other biological disciplines including relevant engineering domains dealing with the dose response. The International Dose-Response Society is administered by the School of Public Health & Health Sciences at the University of Massachusetts at Amherst.”

Areas of interest

Pre- Post-Conditioning: Alzheimer’s Disease/Dementia Parkinson’s Disease Depression and PTSD Concussions/Traumatic Brain Injury Improving Surgical Outcomes Stroke/Cardiovascular Disease Diabetes Glaucoma Stem Cell Transplantation Therapy

Healthy Lifestyles, Aging and Life Extension:Intermittent Fasting Exercise Chemical/Nutritional Supplements Low Dose Radiation and Longevity Adaptive response-based cosmetics

Enhancing Human Performance: Cognition Endurance, Strength and Speed Fatigue/Jet Lag: Prolong Onset/ Speed Up Recovery Wound Healing Acceleration – skin, tendon, muscle, bone, and vascular.”

My colleague Melody Winnig and I hope to see you there.


Coming in this blog

By Vince Giuliano and James P Watson

This entry signals some intended changes in our blogging approach and lists some blog entries we plan to publish soon.

A.  Changes in blogging approach

We expect to go to shorter more- focused entries, away from long encyclopedic ones that try to cover everything we know about a topic.  Our 8-year history has seen us gradually moving from frequent short entries (one or two computer screens) to relatively infrequent publication of what amounts to dissertations on key topics, perhaps 50-100 normal pages in length and comprising 100 or more citations.  This evolution has been somewhat natural for us as we have learned more and more about key topics and have had more and more to say about them.  But we are concerned that it also has led to intractable blog entries that are so long and complex that they are extremely difficult to follow and may act to anaesthetize our readers.

We will accomplish this in large part by an approach we have already started – breaking discussions of complex topics like The NAD World, Transposable Elements and Digital Health into more-digestible numbered parts.  We will be adding new entries under these established series that are already broken into parts as well as under other new categories.

Most of the accesses to this blog relate to archived rather than the latest entries – and we have published more than 500 of them now.   We believe these articles constitute a rich background related to many key sciences that impact health and aging.  So, as time progresses we intend to enhance the cross-linking among these items.  Up to this time there has only been cross-linking from newer to older articles among those we have already written.   So, we will seek to be more diligent in cross-referencing blog entries both backwards as well as providing forward references, at least in the initial paragraphs of older entries.  We expect soon to start going back through historical items and adding forward-looking reference links.

We will also list some new blog entries as belonging to two or more series as we see very important linkages.  For example the very next blog entry to be published after this one will be #5 in the established NAD World series as well as #1 in a brand new series on Inflammation.

 B.  Blog entries we expect to publish soon

  Stories on Inflammation

The blog entry to follow this one is just about ready to go and entitled Part 5 of the NAD world: the conflicting roles of NAMPT:  inflammation or rescue?  Also Part 1 on a new series on inflammation, by Jim Watson.  Jim has written the following introduction to the inflammation series in a recent e-mail to me:

“I completely agree that we should explain inflammation to our readers through a series of “Stories” with historical and human interest tales to help our readers understand and remember the stories.  I will call these stories the “Stories of Inflammation.”   These are mainly  “molecular stories” about inflammation that could be told separately, or merged into one massive “Grand Unified Theory of Inflammation” (GUTI).  As you know, my favorite movie is The Gods Must Be Crazy I (The sequels were not as good).  From here on, I will refer to the movie as “TGMBC”.  I love the fact that TGMBC movie was actually 4 apparently unrelated stories that were being told in parallel, as 4 separate “video tracks”.  The stories were not connected to each other until the very end of the movie, where the bungling terrorists (Sam Boga), the school teacher (Kate Thompson), the Pigmy (Xi), and the Elephant dung scientist (Andrew Steyn) all meet in the same Botswana plain.  Here in this field, all of the stories finally merge into one story.   There are multiple “story lines” in the story of inflammation.  So, the blog entries in the Inflammation series will be the “a molecular equivalent of TGMBC”.  It is a “movie about inflammation” with at least 8-10 seemingly unrelated stories – omega-3s, PPARs and their ligands, aspirin, exercise (aka ROS), the PGC -1a co-activator, autophagy, mitochondrial biogenesis, and the necessity of NAD-dependent Sirtuin deacetylation of at least one lysine acetyl group with all of the above (PGC-1a, PPARgamma, etc.) and the next blog which is about extra-cellular NAMPT.  For those who like to watch a movie with only one story line, these blog entries could be maddening – but we seek to tell it like it is.   The fact that so many drugs and so many researchers only look at “one story” may be a major reason why we have not yet solved the problem of inflammation. I hope this series of blogs will get this point across. – Inflammation is a TGMBC Movie with many stories!”

Here is a sample of three Major Stories of Inflammation (and their components)

 1.  The inflammatory story of NAD’s two-faced cousin 

Here is the story: “There once was (and still is) a wonderful substance that players in the anti-aging game like us want to have more of in our cells because it makes us healthy and maybe even live longer. Called NAD+, publications were written about this great substance by the best of researchers in the greatest temples of longevity research (and, by us in this blog). And supplement makers started selling expensive pills that could trick our cells into making more of this. One of the critical molecules in cells responsible for making NAD+, a close cousin molecule, is called NAMPT, so people in the know started wanting to have more of that too.  But then, a dark side of all of this begin to emerge as it was realized that NAMPT was actually a familiar substance, a carpet-bagger that travelled using various aliases, especially outside of cells where it did shocking things. We learned our trusted NAMPT was often behaving inappropriately for its princely role when it is outside ur cells. Not to be trusted, extra-cellularNAMPT, eNAMPT, can be caught creating horrible inflammation and is closely associated with highly disreputable diseases. We have written before about the good side of NAMPT when it is in cells. This blog entry is an exposure of its bad inflammation-generating side of eNAMPT.  And it is also about a few of its redeeming features.  This story is told in the next blog entry Part 5 of the NAD world: the conflicting roles of NAMPT: inflammation or rescue? Also Part 1 on a new series on inflammation.

2.  The “Fish Oil Story” and the misunderstood “Snake Oil Story” of the Wild West

We usually think of “snake oil” as a completely phony and useless health remedy sold by glib traveling con men like the Wizard of Oz, sold off the back of colorful wagons to clueless country folks. “Snake oil is an expression that originally referred to fraudulent health products or unproven medicine but has come to refer to any product with questionable or unverifiable quality or benefit. By extension, a snake oil salesman is someone who knowingly sells fraudulent goods or who is themselves a fraud, quack, or charlatan(ref).” Not necessarily so.  In the first instances in China, snake oil was made from real water snakes and had high concentrations of  the same omega-3 ingredients found now in concentrated fish oil supplements, EPA and DHA. And it therefore helped control certain forms of inflammation like the fish oil we take today does. . See this article on How Snake Oil got a Bad Rap

Image may be NSFW.
Clik here to view.
Google Images
 Image source     

Our blog entry will cover:

– how rattlesnake oil (8.5% omega-3s) was used instead of oil from Chinese water snakes (20% omega-3s) by the traveling salesmen of the Wild West

– how scientists initially misunderstood the molecular mechanisms of EPA and DHA as anti-oxidants

– the discovery of the bioactive lipids (Resolvins, Protectins, and Maresins) that are endogenously synthesized by evolutionarily conserved pathways 

– the discovery that DHA activates PPARs, but only after being oxidized (i.e. why exercise is needed for activating fish oil)

  Conclusion: Resolvins, Protectins, Maresins, Lipoxins, and oxidized DHA are actually the molecular mediators of the health effects of fish oil (and of real Chinese water snake oil) and all of these work by down-regulating inflammation

 3.  The “Willow Bark Story” and the misunderstood role of low-dose aspirin

– how Hippocrates, the Egyptians, and many ancient civilizations used salicylic acid teas and potions for fever and pain relief

– how willow bark tea was used by the native Americans and early explorers for inflammation

– aspirin, the COX genes and inflammatory diseases such as rheumatoid and osteoarthritis.

– risks and potential benefits of low-dose aspirin

And soon, we expect to publish a blog entry on research reported at the 2016 annual meeting of the International Dose Response Society


[VG1]

Part 5 of the NAD world: the conflicting roles of NAMPT – inflammation or rescue? Also Part 1 on a new series on inflammation

By James P Watson with commentary and assistance by Vince Giuliano

Introduction by Vince Giuliano

This blog entry relates another important story of what goes on in the NAD world. This is also the first entry of what I expect to be several having to do with inflammation. To quote Jim Watson, “The most important three things about aging are inflammation, inflammation, and inflammation.  Inflammation may be due to multiple causes, exist in multiple forms, and is a common factor to the vast majority of diseases including those most closely associated with aging.  Here is the story we will document here:

“There once was (and still is) a wonderful substance that players in the anti-aging game like us want to have more of in our cells because it makes us healthy and maybe even live longer.  Called NAD+, publications were written about this great substance by the best of researchers in the greatest temples of longevity research (and, by us in this blog). 

And supplement makers started selling expensive pills that could trick our cells into making more of this.  One of the critical molecules in your cells responsible for making NAD+, a close cousin molecule, is called NAMPT, so people in the know started wanting to have more of that too. 

But then, a dark side of all of this begin to emerge as it was realized that NAMPT has long been known to be a traveler using various aliases, especially outside of cells where it did shocking things. NAMPT was often behaving inappropriately for its princely role when it is outside our cells.   Not to be trusted, extra-cellular NAMPT (eNAMPT) can be caught creating horrible inflammation and is closely associated with highly disreputable diseases.  Oozing out of fat cells and helping create colorectal cancer is not politically correct for a supposedly good guy. The same is true for destroying cartilage in both osteo and rheumatoid arthritis.  We have written before about the good side of NAMPT when it is in cells.  This present blog entry is an expose of the bad inflammation-generating side of eNAMPT.  And, it turns out that eNAMPT is not completely bad, after all.”

This blog entry is concerned with one particular cause of inflammation associated with eNAMPT (extracellular NAMPT, nicotinamide phosphoribosyltransferase).  This molecule has a dual character and a history of aliases.  It is also known as Visfatin and as Pre-B Cell Colony Enhancing Factor.

We recall NAMPT is a rate-limiting enzyme in the biosynthesis of NAD+ (nicotinamide adenine dinucleotide), an essential cellular coenzyme which we generally want to see promoted. We have previously focused on the intra-cellular role of NAMPT which is as an enzyme in the pathway responsible for the generation of NAD. NAMPT generates nicotinamide mononucleotide NMN from nicotinamide. NMN is then converted to NAD via nicotinamide riboside (NR). How this all works is all laid out in first four blog entries related to the NAD world:

The  Part 1 blog entry in the NAD World series provided an overview treatment of the NAD World and its nuances: to identify the major molecular entities involved, their roles, health and longevity ramifications, the reasons for the current excitement, and to begin to clarify what is actually known and what the remaining uncertainties are. 

The Part 2 blog entry in the NAD World series concentrates on the reasons for focusing on NAD+, particularly with respect to interventions that are seriously likely to lead to longer healthier lives.  It discusses molecular processes in the NAD salvage cycle that are responsible for the health-inducing and life-extending properties of calorie restriction, and further discuss the key roles of Sirtuins, SIRT1, SIRT6 and SIRT7 in particular.

The Part 3 blog entry in the NAD World series identifies 30 Major Factors that Control SIRT1 Expression, SIRT1 Activity, and SIRT1-mediated Aging.I.  The NAD+/NADH ratio and what affects it.

The Part 4 blog entry in the NAD World series is concerned with the NQ01 gene, the Warburg effect, SIRT 1 and inflammation, and possible interventions.

Most of the concern in these blog entries has been with the roles of iNAMPT (intracellular NAMPT) which functions as an enzyme.

The extra-cellular role of NAMPT is a whole different story of concern in this current blog entry where e-NAMPT functions not only as an enzyme but also as a pro-inflammatory cytokine

 On to the Jim Watson entry

I have been uncovering more and more paradoxical factors associated with NAMPT.   eNAMPTappears to be both a “bad thing” and a “good thing”. The difference may have to do with the dose (i.e. Biphasic dose-response curve) or it may have to do with the zip code (i.e. What cell or what tissue), or eNAMPT may have what is called “pleiotropic effects”. What is clear to me is this fundamental fact: eNAMPT has both a “cytokine effect” and an “enzyme effect”. The inhibitor FK866 and NMN inhibit the “enzyme effect” but do not inhibit the “cytokine effect”.

The “cytokine effect” is mostly pro-inflammatory, but also promotes survival of cells such as cancer cells and macrophages. The “enzymatic effect” may indirectly affect inflammation/immunity by providing NMN substrates for conversion to NR, and subsequent plasma membrane uptake by cells that are NAD deficient (NMN does not appear to be taken up directly, but is usually converted into NR which is absorbed).

What is upsetting the apple cart even more is the fact that much of the “dogma about biomarkers of aging and biomarkers of cellular senescence” may be wrong!  Specifically, the Japanese as well as others showed that IL-6, TNF-alpha, and CRP all predict all cause mortality and lifespan more accurately than age or gender.  However, I have found that all of these 3 “biomarkers of aging” are triggered by increased levels of eNAMPT (IL-6, TNF-a, and CRP). Likewise, the classic biomarkers of cellular senescence (I.e. The SASP components…IL-6, IL-8, MCP-1, etc.) are all expressed from NON-SENESCENT CELLS in response to eNAMPT signaling! This makes me question the use of these cytokines as biomarkers for aging and biomarkers for cellular senescence, since their levels are easily altered by eNAMPT expression! We know that eNAMPT expression is NOT the entire picture of aging (aging includes DNA damage/mutations, epigenetic dysregulation, cellular senescence, increased mTOR signaling, mitochondrial dysfunction, proteotoxicity, autophagy failure, etc).

This raises many questions about the validity of inflammatory cytokines as true biomarkers of aging, since eNAMPT activity/signaling can be inhibited by NMN and by FK866. It also calls into question the link between cellular senescence and these same cytokines (IL-6, IL-8, MCP-1). Here are some more facts about eNAMPT and a list of the proteins that are secreted by cells in response to eNAMPT signaling.

This quote from the 2010 publication Pre-B Cell Colony Enhancing Factor/NAMPT/Visfatin in Inflammation and Obesity- Related Disorders telegraphs some key points which will be covered here: “Whereas prototypic adipocytokines such as adiponectin or leptin are mainly derived from adipocytes, others such as pre-B cell colony enhancing factor (PBEF)/nicotinamide phosphoribosyl transferase (NAMPT)/visfatin or resistin are produced by various cell types throughout the body. Although first discovery of this molecule as PBEF suggested primarily a cytokine function, its rediscovery as the key enzyme in nicotinamide adenine dinucleotide (NAD) generation has considerably widened its biological perspective. Finally, the same molecule was introduced as visfatin claiming an insulin-mimetic effect which has been questioned. Both extracellular (cytokine-like) and intracellular (enzymatic) functions are responsible for its relevance in immune, metabolic and stress responses. Its cytokine functions are mainly pro-inflammatory as it induces potently various other pro-inflammatory cytokines such as tumor necrosis factor alpha (TNFα) or interleukin-6 (IL-6). Its intracellular functions concentrate on the regulation of the activity of NAD-consuming enzymes such as various sirtuins thereby also affecting TNFα biosynthesis, cell life-span and longevity. Biochemical neutralization of PBEF/NAMPT/visfatin has been proven effective in various models of inflammation including sepsis/arthritis and in various models of cancer. Patients with non-alcoholic fatty liver disease (NAFLD) exhibit increased serum concentrations of PBEF/Nampt/visfatin and weight loss is associated both with a decrease in serum levels and reduced liver expression. Many of the biological functions of this “cytokine-enzyme” have been characterized in the last years, however, its definite role in various metabolic, inflammatory and malignant diseases has yet to be defined.”

  1. The pro-inflammatory effects of eNAMPT 

One of the most unusual molecules in nature is the secreted form of NAMPT, called “eNAMPT,”  eNAMPT is secreted in response to inflammation and also causes inflammation. Thus it is both a “cause” and an “effect” of inflammation. Many other names have been attached to eNAMPT before they were all found to be the same molecule. They include “Pre-B cell colony enhancing factor (PBEF) and Visfatin. (Here we shall just call it eNAMPT). eNAMPT increases circulating levels of pro-inflammatory cytokines, including IL-6, TNF-alpha, IL-1B, and TGF-B1. It also increases the chemokine receptor CCR3, VEGF, VEGFR, and MCP-1.  eNAMPT activates the Toll-like receptor 4 (TLR4) in a unique way, triggering NF-kB mediated gene expression in cells. In conclusion, eNAMPT may be the link between visceral fat and systemic inflammation. It also may be the major molecular mechanism behind “sterile inflammation” and “inflammaging”, which are ways of describing the phenomena seen with aging and age-related diseases.

References:

2013  Pre-B cell colony enhancing factor (PBEF), a cytokine with multiple physiological functions  “Extracellular PBEF has been shown to increase inflammatory cytokines, such as TNF-α, IL-1β, IL-16, and TGF-β1, and the chemokine receptor CCR3. PBEF also increases the production of IL-6, TNF-α, and IL-1β in CD14+ monocyctes, macrophages, and dendritic cells, enhances the effectiveness of T cells, and is vital to the development of both B and T lymphocytes.”

Image may be NSFW.
Clik here to view.
eMAMPT0

Image source  Note that eNAMPT creates these terrible problems traveling here when using the alias PBEF

2009  Nicotinamide phosphoribosyltransferase (Nampt): A link between NAD biology, metabolism, and diseases  “New interest in NAD biology has recently been revived, and enzymes involved in NAD biosynthetic pathways have been identified and characterized in mammals. Among them, nicotinamide phosphoribosyltransferase (Nampt) has drawn much attention in several different fields, including NAD biology, metabolism, and immunomodulatory response. The research history of this protein is peculiar and controversial, and its physiological function has been a matter of debate. Nampt has both intra- and extracellular forms in mammals. Intracellular Nampt (iNampt) is an essential enzyme in the NAD biosynthetic pathway starting from nicotinamide. On the other hand, an extracellular form of this protein has been reported to act as a cytokine named PBEF, an insulin-mimetic hormone named visfatin, or an extracellular NAD biosynthetic enzyme named eNampt. This review article summarizes the research history and reported functions of this unique protein and discusses the pathophysiological significance of Nampt as an NAD biosynthetic enzyme vs. a potential inflammatory cytokine in diverse biological contexts.”

  1. eNAMPT is secreted by neutrophils, microglia, macrophages, and visceral fat cells when these cells are stimulated by LPS or pro-inflammatory cytokines.

Pro-inflammatory cytokines trigger eNAMPT and eNAMPT triggers the gene transcription of more pro-inflammatory cytokines from the neurotrophils, macrophages, microglia, and visceral fat. With LPS stimulation of neutrophils, eNAMPT expression occurs 5 hours later. This is what is classically called a “positive feedback loop” in molecular biology, or could be called a “self-perpetuating fate” in theology. Regardless of the description, eNAMPT becomes a mediator of ongoing, chronic inflammation, long after the original trigger of inflammation is gone. This has often been referred to as “sterile inflammation”.

References:

From the book 2016 The Stress Response of Critical Illness: Metabolic and Hormonal Aspects 

2004  Pre–B cell colony–enhancing factor inhibits neutrophil apoptosis in experimental inflammation and clinical sepsis

  1. eNAMPT has a protein sequence that “mimics” bacterial lipopolysaccharide (LPS) which triggers Toll-like receptor 4 signaling. 

Lipopolysaccharide (LPS) is the molecular name for bacterial endotoxin. When lab experimenters want to create inflammation in a mouse or rat, they usually use  LPS to do that. LPS triggers inflammation by binding to cells via the mammalian cell Toll-like receptor 4 (TLR4). Although early reports suggested that TLR2 also mediated LPS toxicity, more up-to-date findings have confirmed that TLR4 is the sole molecular receptor for LPS. TLR4 receptor triggering leads to the secretion of many pro-inflammatory, pro-angiogenic, and anti-apoptotic compounds from neutrophils, activated lymphocytes, macrophages, and visceral fat cells.

References:

2004  Pre–B cell colony–enhancing factor inhibits neutrophil apoptosis in experimental inflammation and clinical sepsis

2007 Pre-B-cell Colony-enhancing Factor (PBEF/Visfatin) Gene Expression is Modulated by NF-κB and AP-1 in Human Amniotic Epithelial Cells

2004  Tlr4: central component of the sole mammalian LPS sensor.

2012 Regulation of neutrophil function by NAMPT

  1. Inflammation up-regulates eNAMPT and eNAMPT up regulates inflammation. 

In experimental studies where cells are activated by LPS, many genes are upregulated via NF-kB. One of these is NAMPT, which is transcribed, translated, and secreted from the cell as eNAMPT. Thus eNAMPT can be considered both the “cause” and the “effect” of Inflammation. Since bacterial infections (LPS) are common triggers of inflammation, eNAMPT can be consIdered an “amplifier of infectious inflammation” or in the absence of LPS, eNAMPT can be considered a mediator of “sterile inflammation.”  Unfortunately, chronic inflammation acts as a “damper” on NAD production in the liver, in adipose tissue, in the pancreatic beta-islet cells, and in the brain. Thus the “true enemy” is inflammation, NOT eNAMPT! The diagram below from Imai’s recent 2013 paper illustrates this well.

References:

2000  Role of MD-2 in TLR2- and TLR4-mediated recognition of Gram-negative and Gram-positive bacteria and activation of chemokine genes

2007 Pre-B-cell Colony-enhancing Factor (PBEF/Visfatin) Gene Expression is Modulated by NF-κB and AP-1 in Human Amniotic Epithelial Cells

2012 Regulation of neutrophil function by NAMPT

2013  The importance of NAMPT/NAD/SIRT1 in the systemic regulation of metabolism and ageing

Image may be NSFW.
Clik here to view.
eMAMPT1

Image and legend source.  “The concept of the NAD World and the possible effect of chronic inflammation. Pancreatic β-cells and neurons (the brain) are two major frailty points in the NAD World because these two cell types have very low levels of intracellular nicotinamide phosphoribosyltranferase (iNAMPT). These particular cell types likely depend on extracellular nicotinamide mononucleotide (NMN), which is speculated to be synthesized by extracellular nicotinamide phosphoribosyltranferase (eNAMPT) secreted by adipose tissue, and maintain optimal nicotinamide adenine dinucleotide (NAD) levels for their functions. Chronic inflammation, which is caused by inflammatory cytokines and oxidative stress, decreases NAMPT and NAD levels in multiple tissues, contributing to the pathogenesis of age-associated metabolic complications, such as type 2 diabetes. It still remains unclear whether chronic inflammation in adipose tissue also decreases plasma eNAMPT levels and remotely affects the functions of ‘frailty’ cell types.”   So is eNAMPT good or bad?  Like many other key molecules we have studied, the answer appears to be “both.”

  1. TLR4 signaling by eNAMPT triggers both NF-kB and AP-1 mediated signaling.

Whereas NF-kB is the classic “master switch” for inflammatory genes, AP-1 is a lesser known transcription factor that also triggers inflammatory genes. Because of the dual transcription factor signaling pathways for eNAMPT, blocking NF-kB alone with molecules like steroids or certain phytosubstances will fail to fully block the pro-inflammatory and pro-angiogenic effects of eNAMPT signaling.  Of course, certain phytosubstances like curcumin do block both NF-kB and AP-1 inflammation(ref).

Reference:  2007 Pre-B-cell Colony-enhancing Factor (PBEF/Visfatin) Gene Expression is Modulated by NF-κB and AP-1 in Human Amniotic Epithelial Cells

  1. SIRT1 deacetylates iNAMPT, which enhances NAMPT activity and drives the secretion of eNAMPT from visceral fat cells. 

This is one of the “paradoxical aspects” of the eNAMPT story. SIRT1 is typically thought of as a CR pathway enzyme that has anti-inflammatory effects.  But here SIRT1 is playing a positive role in the secretion of eNAMPT from fat cells by deacetylation of lysine 53 (K53) on the NAMPT protein. This is the “secrete me” signal that triggers the export of the deacetylated eNAMPT  out of the cell.  In the plasma, fat cell-derived eNAMPT secretion circulates systemically and affects the hypothalmus. In the hypothalmus, the circulating eNAMPT increases NAD+ in the hypothalmus. Decreased eNAMPT decreases NAD+ in the hypothalmus, whereas increased eNAMPT in the plasma increases NAD in the hypothalmus.  In NAMPT knock-out mice, NMN “rescues” the defect and the mice become more physically active. This is very puzzling until you put it in the context of fasting (CR) vs times of food abundance. Specifically, iNAMPT is normally acetylated at lysine 53 in both white fat and brown fat.  However with fasting or starvation, SIRT1 deacetylates iNAMPT at lysine 53 (K53) which promotes its export. Thus fasting is an iNAMPT export signal leading to eNAMPT and its possible sequela as outlined here.  Another example of the multiple good-bad roles played by eNAMPT.

References: 

2015 SIRT1-Mediated eNAMPT Secretion from Adipose Tissue Regulates Hypothalamic NAD+ and Function in Mice

2012 The Pathophysiological Importance of Nicotinamide Phosphoribosyltransferase as a Key NAD Biosynthesis Enzyme in Metabolic Homeostasis

Image may be NSFW.
Clik here to view.
eNAMPT2


Image and legend source.  “Nicotinamide phosphoribosyltransferase (NAMPT), the key NAD+ biosynthetic enzyme, has two different forms, intra- and extracellular (iNAMPT and eNAMPT), in mammals. However, the significance of eNAMPT secretion remains unclear. Here we demonstrate that deacetylation of iNAMPT by the mammalian NAD+-dependent deacetylase SIRT1 predisposes the protein to secretion in adipocytes. NAMPT mutants reveal that SIRT1 deacetylates lysine 53 (K53) and enhances eNAMPT activity and secretion. —“

  1. eNAMPT triggers systemic Insulin resistance and IGF-1 receptormediated PGE2-induced arthritis 

The link between insulin resistance and eNAMPT is among the most fascinating things I have learned recently. This finally explains the links between fat (eNAMPT source), the regulation of the Insulin/IGF-1 pathway, and NMN. For quite some time, eNAMPT (also called PBEF or Visfatin) has been linked to inflammation, but exactly how eNAMPT was linked was unclear. This has largely been cleared up in the last 3-4 years.

  1. eNAMPT, IGF-1 signaling, and inflammation

In 2012, Jacques and colleagues from Marie Curie University in Paris showed that in joints, eNAMPT triggers inflammation by inducing PGE2 synthesis by chondrocytes. In cells with no IGF-1 receptors, eNAMPT triggered PGE2 biosynthesis. In cells with two functional copies of the IGF-1R, eNAMPT did not trigger nearly as much PGE2 release. However, Jacques and colleagues were not able to show if eNAMPT regulated the insulin receptor. They did show that inhibiting eNAMPT with FK866 gradually decreased PGE2 release and administering exogenous Nicotinamide increased PGE2 release.

Reference:  2012 Proinflammatory actions of visfatin/nicotinamide phosphoribosyltransferase (Nampt) involve regulation of insulin signaling pathway and Nampt enzymatic activity  “We conclude that the proinflammatory actions of visfatin in chondrocytes involve regulation of IR signaling pathways, possibly through the control of Nampt enzymatic activity.”

  1. eNAMPT is the molecular cause of Insulin Resistance

The exact mechanism of how fat-induced inflammation causes insulin resistance has long remained a mystery. The mystery may have been solved in 2015 when a large, multi-center research group from Canada and China showed that eNAMPT induces the translocation if the insulin receptor out of lipid micro domains (lipid rafts) into non-lipid raft regions of the cell membrane. This had the net effect of making the insulin receptor resistant to insulin signaling (I.e. It did not trigger Akt phosphorylation). This effectively reduced insulin signaling by moving the IR to the non-raft region, which caused cells to become insulin resistant.  This has explained the mystery of why insulin receptor density in cells does not decrease with fat-Induced inflammation, but that insulin resistance still occurs with fat-induced inflammation.

References: 

2015 Pre-B cell colony enhancing factor induces Nampt-dependent translocation of the insulin receptor out of lipid microdomains in A549 lung epithelial cells   “We conclude that PBEF can inhibit insulin signaling through the IR by Nampt-dependent promotion of IR translocation into the nonraft domains of A549 epithelial cells. PBEF-induced alterations in the spatial geometry of the IR provide a mechanistic explanation for insulin resistance in inflammatory states associated with upregulation of PBEF.”

2013 Pre-B cell colony enhancing factor (PBEF), a cytokine with multiple physiological functions

Conclusion re, eNAMPT and insulin resistance

The circulating molecule by which obesity (mainly visceral fat) can induce insulin resistance in distant organs (muscle) has now been identified – it is eNAMPT.  eNAMPT is secreted mainly by visceral fat and inflammatory cells and circulates in the bloodstream as an enzyme and a pro-inflammatory, pro-angiogenic cytokine. In distant cells (such as muscle), it triggers insulin receptor movement from lipid rafts to non-lipid raft regions, effectively inactivating the intracellular signaling cascade that centers around Akt phosphorylation. Thus eNAMPT is the molecular “cause” of insulin resistance. eNAMPT also plays a role in triggering bioactive lipid-mediated inflammation (I.e. PGE2) in inflammatory diseases such as arthritis. For eNAMPT to trigger PGE2 release, there must be IGF-1 receptors (IGF1R) present. IGF1Rs are required for full eNAMPT-mediated PGE2 release. This IGF-1 and IGF1R play vital roles in the mechanism by which eNAMPT triggers PGE2 release in arthritis. This effect can be blocked with FK866, an eNAMPT inhibitor, or NMN, which inhibits eNAMPT by “feedback inhibition”.

  1.  IL-8

IL-8 is secreted by the eNAMPT target cell by eNAMPT binding to the TLR4 receptor on the target cell and triggering IL-8 gene expression. 

IL-8 is a classic biomarker of cellular senescence, proposed by Mayo Clinic and Buck Institute researchers. However, mRNA for IL-8 is increased 2-8 fold with eNAMPT over-expression in cells that are NOT senescent. The cell surface receptor activated by eNAMPT on the target cell is the Toll-like receptor 4 (TLR4). The two transcription factors that mediate this eNAMPT effect in the target cell are NF-kB and AP-1, classical villains of unwanted inflammation. These are not the transcription factors that trigger IL-8 secretion in senescent cells. (There it is JAK/STAT signaling pathway). Thus IL-8 may NOT always be due to senescent cell secretion….it may just be due to eNAMPT binding to a non-senescent cell and triggering AP-1 mediated IL-1B secretion, which then triggers IL-8.

References: 

2008 A critical role of PBEF expression in pulmonary cell inflammation and permeability

2009 Regulation of Inflammatory Cytokine Expression in Pulmonary Epithelial Cells by Pre-B-cell Colony-enhancing Factor via a Nonenzymatic and AP-1-dependent Mechanism

2004  Pre–B cell colony–enhancing factor inhibits neutrophil apoptosis in experimental inflammation and clinical sepsis

2002 Pre-B-cell colony-enhancing factor, a novel cytokine of human fetal membranes

  1. IL-6

eNAMPT triggers the production of IL-6 in target cells in humans. 

References:

2002 Pre-B-cell colony-enhancing factor, a novel cytokine of human fetal membranes

2010 Pre-B Cell Colony Enhancing Factor/NAMPT/Visfatin in Inflammation and Obesity- Related Disorders

  1. IL-1Beta

IL-Beta expression is triggered by eNAMPT

eNAMPT also triggers IL-1Beta secretion by cells. (IL-1B actually then triggers IL-8 secretion). While IL-1B is not a classic biomarker for cellular senescence, it is probably the #1 cytokine associated with osteoarthritis (OA), rheumatoid arthritis (RA), and many other chronic inflammatory diseases. Is OA and RA inflammation due to eNAMPT?   Probably not!  However I have read some articles that suggest that eNAMPT does play a role in arthritis. Here ls one:

Reference:  2004  Pre–B cell colony–enhancing factor inhibits neutrophil apoptosis in experimental inflammation and clinical sepsis

  1. IL-16

IL-16 expression triggered by eNAMPT

eNAMPT signaling also stimulates IL-16 gene expression and production of the IL-16 cytokine. Here there appears to be a clear difference from cellular senescence. With cellular senescence, there is an increase in IL-6 and other cytokines, but the literature related to senescence-stimulated cytokines does not appear to mention IL-16 to our knowledge.

References:

2008 A critical role of PBEF expression in pulmonary cell inflammation and permeability

2009 Regulation of Inflammatory Cytokine Expression in Pulmonary Epithelial Cells by Pre-B-cell Colony-enhancing Factor via a Nonenzymatic and AP-1-dependent Mechanism

  1. CCR3

CCR3 expression triggered by eNAMPT

CCR3 is a chemokine

References:

2008 A critical role of PBEF expression in pulmonary cell inflammation and permeability  “PBEF expression also affected the expression of two other inflammatory cytokines (IL-16 and CCR3 genes). These results suggest that PBEF is critically involved in pulmonary vascular and epithelial inflammation and permeability, which are hallmark features in the pathogenesis of acute lung injury. This study lend further support that PBEF is a potential new target in acute lung injury.”

2009 Regulation of Inflammatory Cytokine Expression in Pulmonary Epithelial Cells by Pre-B-cell Colony-enhancing Factor via a Nonenzymatic and AP-1-dependent Mechanism*

  1. eNAMPT may be the major molecular cause of normal, spontaneous labor and infection-induced pre-term labor. This was a surprising finding reported in 2002.

Reference:  2002 Pre-B-cell colony-enhancing factor, a novel cytokine of human fetal membranes

  1. Cancer cells secrete eNAMPT

Strong expression of eNAMPT has been seen in breast, colorectal, brain, stomach, thyroid, endometrial, ovarian, multiple myeloma, astrocytoma, and prostate cancer. This is not surprising, since cancer cells seem to up-regulate inflammatory pathways independently and autonomously from their environment.  Since there is evidence that both iNAMPT and eNAMPT are pro-survival factors, there may be more than one reason why cancer cells up regulate the NAMPT gene expression.  The transcription factor that upregulates eNAMPT in these cells is cMYC, an oncogene transcription factor critical in embryogenesis.

References:

Nicotinamide Phosphoribosyltransferase Promotes Epithelial-to-Mesenchymal Transition as a Soluble Factor Independent of Its Enzymatic Activity*

2011 The Role of Visfatin in Prostate Cancer

Nicotinamide Phosphoribosyl Transferase (NAMPT) Inhibitors: Novel Modulators of Cancer-Related Inflammation

  1. eNAMPT triggers one of the major steps in carcinogenesis – the epithelial-to-mesenchymal transition. Cancer cells must go through a critical transformation where they go from epithelial cells to mesenchymal cells that resemble mesenchymal stem cells. This step is most often triggered by chronic inflammation and may be one reason why aspirin inhibits cancer formation. eNAMPT has been shown in vitro, to promote the epithelial-to-mesenchymal transition in breast cancer. It did this via the TGG-Beta1 signaling pathway.  Thus eNAMPT plays a major role in cancer formation.

References:

Nicotinamide Phosphoribosyltransferase Promotes Epithelial-to-Mesenchymal Transition as a Soluble Factor Independent of Its Enzymatic Activity*

Nicotinamide Phosphoribosyl Transferase (NAMPT) Inhibitors: Novel Modulators of Cancer-Related Inflammation

  1. eNAMPT is secreted from cardiomyocytes and causes cardiac hypertrophy and ventricular remodeling.

This is a surprising finding. NAMPT transgenic mice developed cardiac hypertrophy at 6 months of age. Cultured cardiomyocytes secreted eNAMPT in response to H2O2.  The downstream signaling pathways in the cardiomyocytes that were exposed to eNAMPT were the transcription factors, JNK, p38, and ERK. There was also increased calcineurin and NFAT translocation into the nucleus in response to eNAMPT.

References:

2013 Nampt secreted from cardiomyocytes promotes development of cardiac hypertrophy and adverse ventricular remodeling

2013 Resistin and Visfatin Expression in HCT-116 Colorectal Cancer Cell Line

  1. eNAMPT is a major molecular mediator of cartilage destruction in RA and OA.

This was not known until 2013. eNAMPT levels are very high in both plasma and in the synovial fluid of patients with RA. Adding eNAMPT to fibroblast cultures triggers the synthesis and secretion of cartilage breakdown enzymes like MMP-3. This effect could be reversed with the eNAMPT inhibitor, FK866.

Reference:  2013 Investigating the role of Nicotinamide phosphoribosyltransferase (NAMPT) in cartilage catabolism

  1. eNAMPT inhibition reduces ROS secretion by neutrophils but did not inhibit their ability to kill bacteria

Many researchers were predicting that eNAMPT would be an essential mediator of innate immunity due to its ability to activate neurotrophils.   For this reason, it was somewhat surprising to find out that the inhibition of eNAMPT with FK866 decreased ROS production by neutrophils but did not reduce their ability to destroy bacteria. eNAMPT inhibition did decrease TNF-alpha mediated gene expression, however.

Reference:  2012 Regulation of neutrophil function by NAMPT

  1. eNAMPT inhibition by NMN prevents pro-inflammatory destruction of pancreatic islet cells.This is very good news for Type II Diabetics.

Reference:  2011 Nicotinamide mononucleotide protects against pro-inflammatory cytokine-mediated impairment of mouse islet function.  This article describes a situation where administration of exogenous NMN comes to the rescue.  “— We hypothesised that altered NAMPT activity might contribute to the suppression of islet function associated with inflammation, and aimed to determine whether NMN could improve cytokine-mediated islet dysfunction. — Acute effects of NMN on cytokine-mediated islet dysfunction were examined in islets incubated with TNFα and IL1β, and in mice fed a fructose-rich diet (FRD) for 16 weeks. Changes in iNAMPT, eNAMPT and inflammation levels were determined in FRD-fed mice.  Results:  FRD-fed mice displayed markedly lower levels of circulating eNAMPT, with impaired insulin secretion and raised islet expression of Il1b. NMN administration lowered Il1b expression and restored suppressed insulin secretion in FRD-fed mice.  NMN also restored insulin secretion in islets cultured with pro-inflammatory cytokines. The changes in islet function corresponded with changes in key markers of islet function and differentiation. The anti-inflammatory effects of NMN were partially blocked by inhibition of sirtuin 1.”

  1. eNAMPT promotes macrophage survival via an IL-6/STAT3 survival mechanism and is differentially expressed in M1 vs M2 macrophages. 

An interesting finding is that eNAMPT helps keep macrophages alive. This pro-survival effect is not due to the enzymatic activity of eNAMPT, but instead is due to the cytokine activity of eNAMPT. This pro-survival effect of eNAMPT could not be mimicked by adding NMN. It did not require the presence of Nicotinamide and it was not blocked by FK866. Thus it is clear that eNAMPT promotes survival as a cytokine in macrophages, not as an enzyme.  Given the long list of “bad” things we have had to say here about eNAMPT, it is nice to identify this potentially “good” thing.

Another interesting finding is that the NAMPT gene is markedly upregulated in M1 macrophages but is down regulated in M2 macrophages. M1 macrophages are the phenotype associated with chronic inflammation whereas M2 phenotype macrophages inhibit inflammation. Exercise can phenotypically “switch” M1 macrophages to M2 macrophages, even in obese mouse models of inflammation. (See ref below). PPARgamma activation is at least one of the exercise-induced molecular mechanisms responsible for this phenotypic switch. PPARgamma is also a suppressor of inflammation and has been associated with down-regulation of eNAMPT expression.

References: 

2008 Extracellular Nampt Promotes Macrophage Survival via a Nonenzymatic Interleukin-6/STAT3 Signaling Mechanism

Nicotinamide Phosphoribosyl Transferase (NAMPT) Inhibitors: Novel Modulators of Cancer-Related Inflammation

Exercise training inhibits inflammation in adipose tissue via both suppression of macrophage infiltration and acceleration of phenotypic switching from M1 to M2 macrophages in high-fat-dietinduced obese mice

2007 PPARγ Activation Primes Human Monocytes into Alternative M2 Macrophages with Anti-inflammatory Properties

  1.  eNAMPT makes cerebral ischemia worse. In a recent mouse model of cerebral ischemia, the non-enzymatic effect (cytokine effect) of eNAMPT was shown to exacerbate the oxygen/glucose deprivation injury. Exogenously administered eNAMPT triggered TNF-alpha release from glial cells and it appeared that this was the mechanism of injury. No enzymatic activity of eNAMPT was necessary for this effect. This eNAMPT is a “cytokine” and not an enzyme when it comes to ischemia-reperfusion injury.

References:

2013 Cerebral Ischemia Is Exacerbated by Extracellular Nicotinamide Phosphoribosyltransferase via a Non-Enzymatic Mechanism

2008 Extracellular Nampt Promotes Macrophage Survival via a Nonenzymatic Interleukin-6/STAT3 Signaling Mechanism

RECAP

In recap, here are some key facts I have covered:

  1. eNAMPT has a protein moiety on the protein that “mimics” endotoxin and activates the TLR4 receptor, essentially creating a “sterile inflammation.”
  2. eNAMPT is secreted by “angry microglial cells”, angry macrophages, and visceral fat.
  3. eNAMPT signaling via TLR4 triggers two pro-inflammatory intracellular cascades/transcription factors, NF-kB and AP-1.  Simply inhibiting only one of these pathways like NF-kB does NOT work!
  4. eNAMPT expression triggers the expression and secretion of practically every SASP biomarker/cytokine, such as IL-8, IL-6, MCP-1, IL-16, TNF-a, IL-1B, CCR3, etc.  Thus eNAMPT triggered secretions “mimic” cellular senescence!
  5. eNAMPT can be inhibited by NMN.
  6. eNAMPT can be inhibited by FK866 and MSO, two small molecule inhibitors of the enzyme.
  7. eNAMPT induces “insulin resistance” by making the IR translocated out of the lipid raft (i.e. it “pushes IR off the raft.”)
  8. eNAMPT induces “IGF-1 resistance” in joints by making the IGF-1R unable to trigger cell growth and cartilage ECM generation.
  9. eNAMPT is the “ISIS of Molecular Biology”
Viewing all 149 articles
Browse latest View live